OK, so by this time, it’s about a month after the Summer Solstice in the Northern Hemisphere. If the title bothers you, just replace “solstice” with “summer”. Then replace “on the” with “now that it’s” to make the sentence grammatically correct.
If you read the very first post on this blog (you may want to go back and read it again, even if you already did) you would know that it’s difficult to display VIIRS Day/Night Band (DNB) imagery when the day/night terminator is present. The data varies by 6-8 orders of magnitude between day and night (depending on the moon and other factors), which is tough to represent when you only have 256 colors available to make an image. That’s why the Near Constant Contrast EDR exists.
But, what if you don’t have access to the Near Constant Contrast (NCC) data? Is there anything one can do to get useful information on both sides of the terminator in the same image?
The short answer is: yes. The long answer is: yesss. But, that’s not to say the results are always going to be perfect.
Over the years, I have acquired examples of things that various people or groups have tried that didn’t work. Like this one:
Or this one that you should have seen before (if you re-read the blog post I told you to read):
This is not to single anyone out (especially because I don’t know the names of the people who produced these images) – I’ve tried a number of things that didn’t work out either. Knowing why they don’t work is the key to finding something that does work.
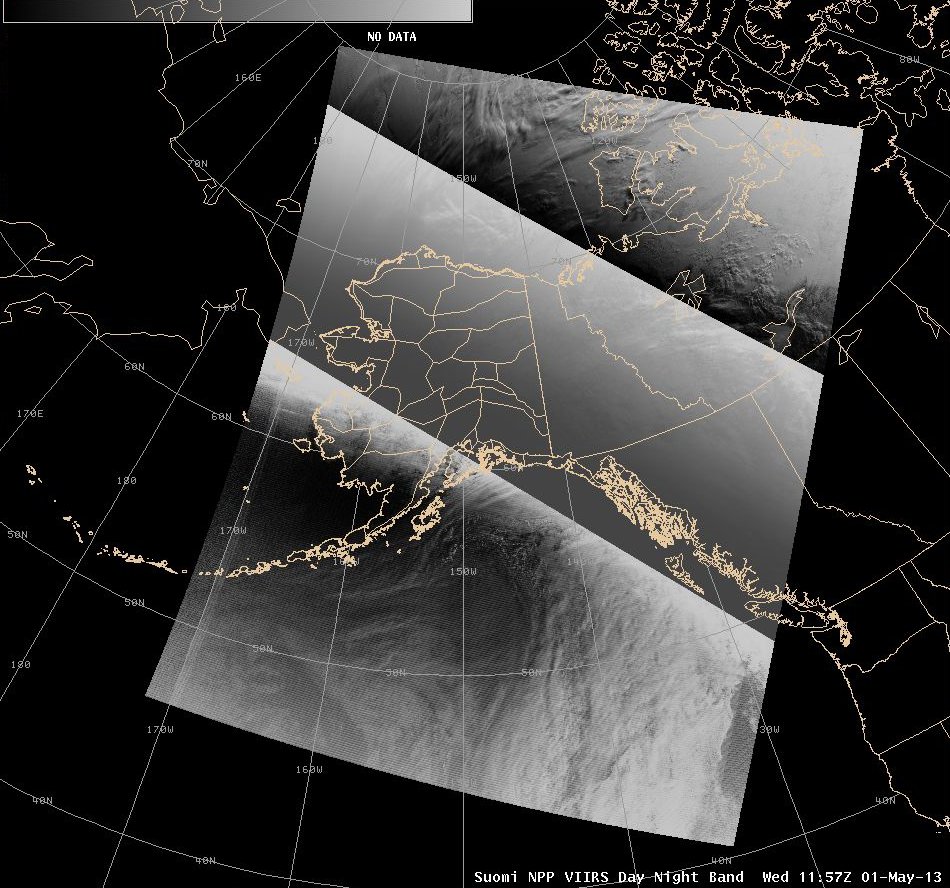
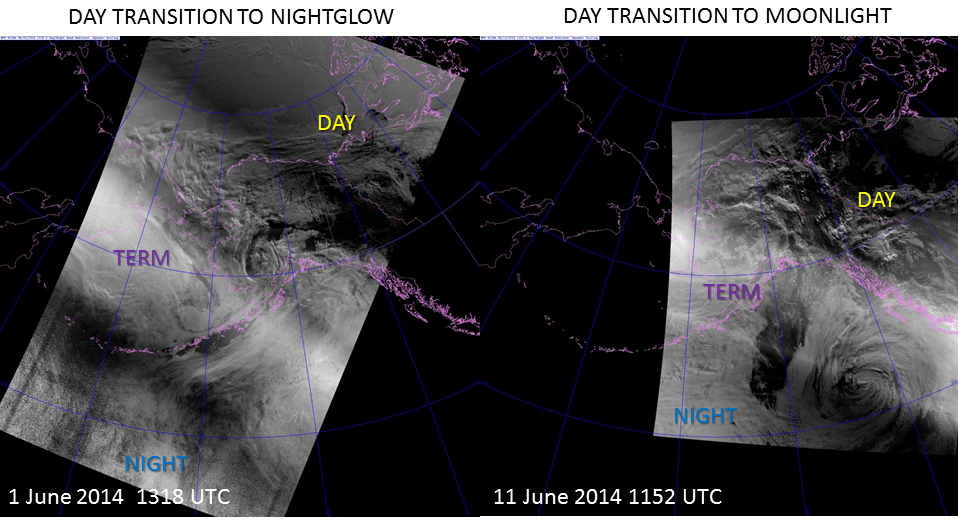
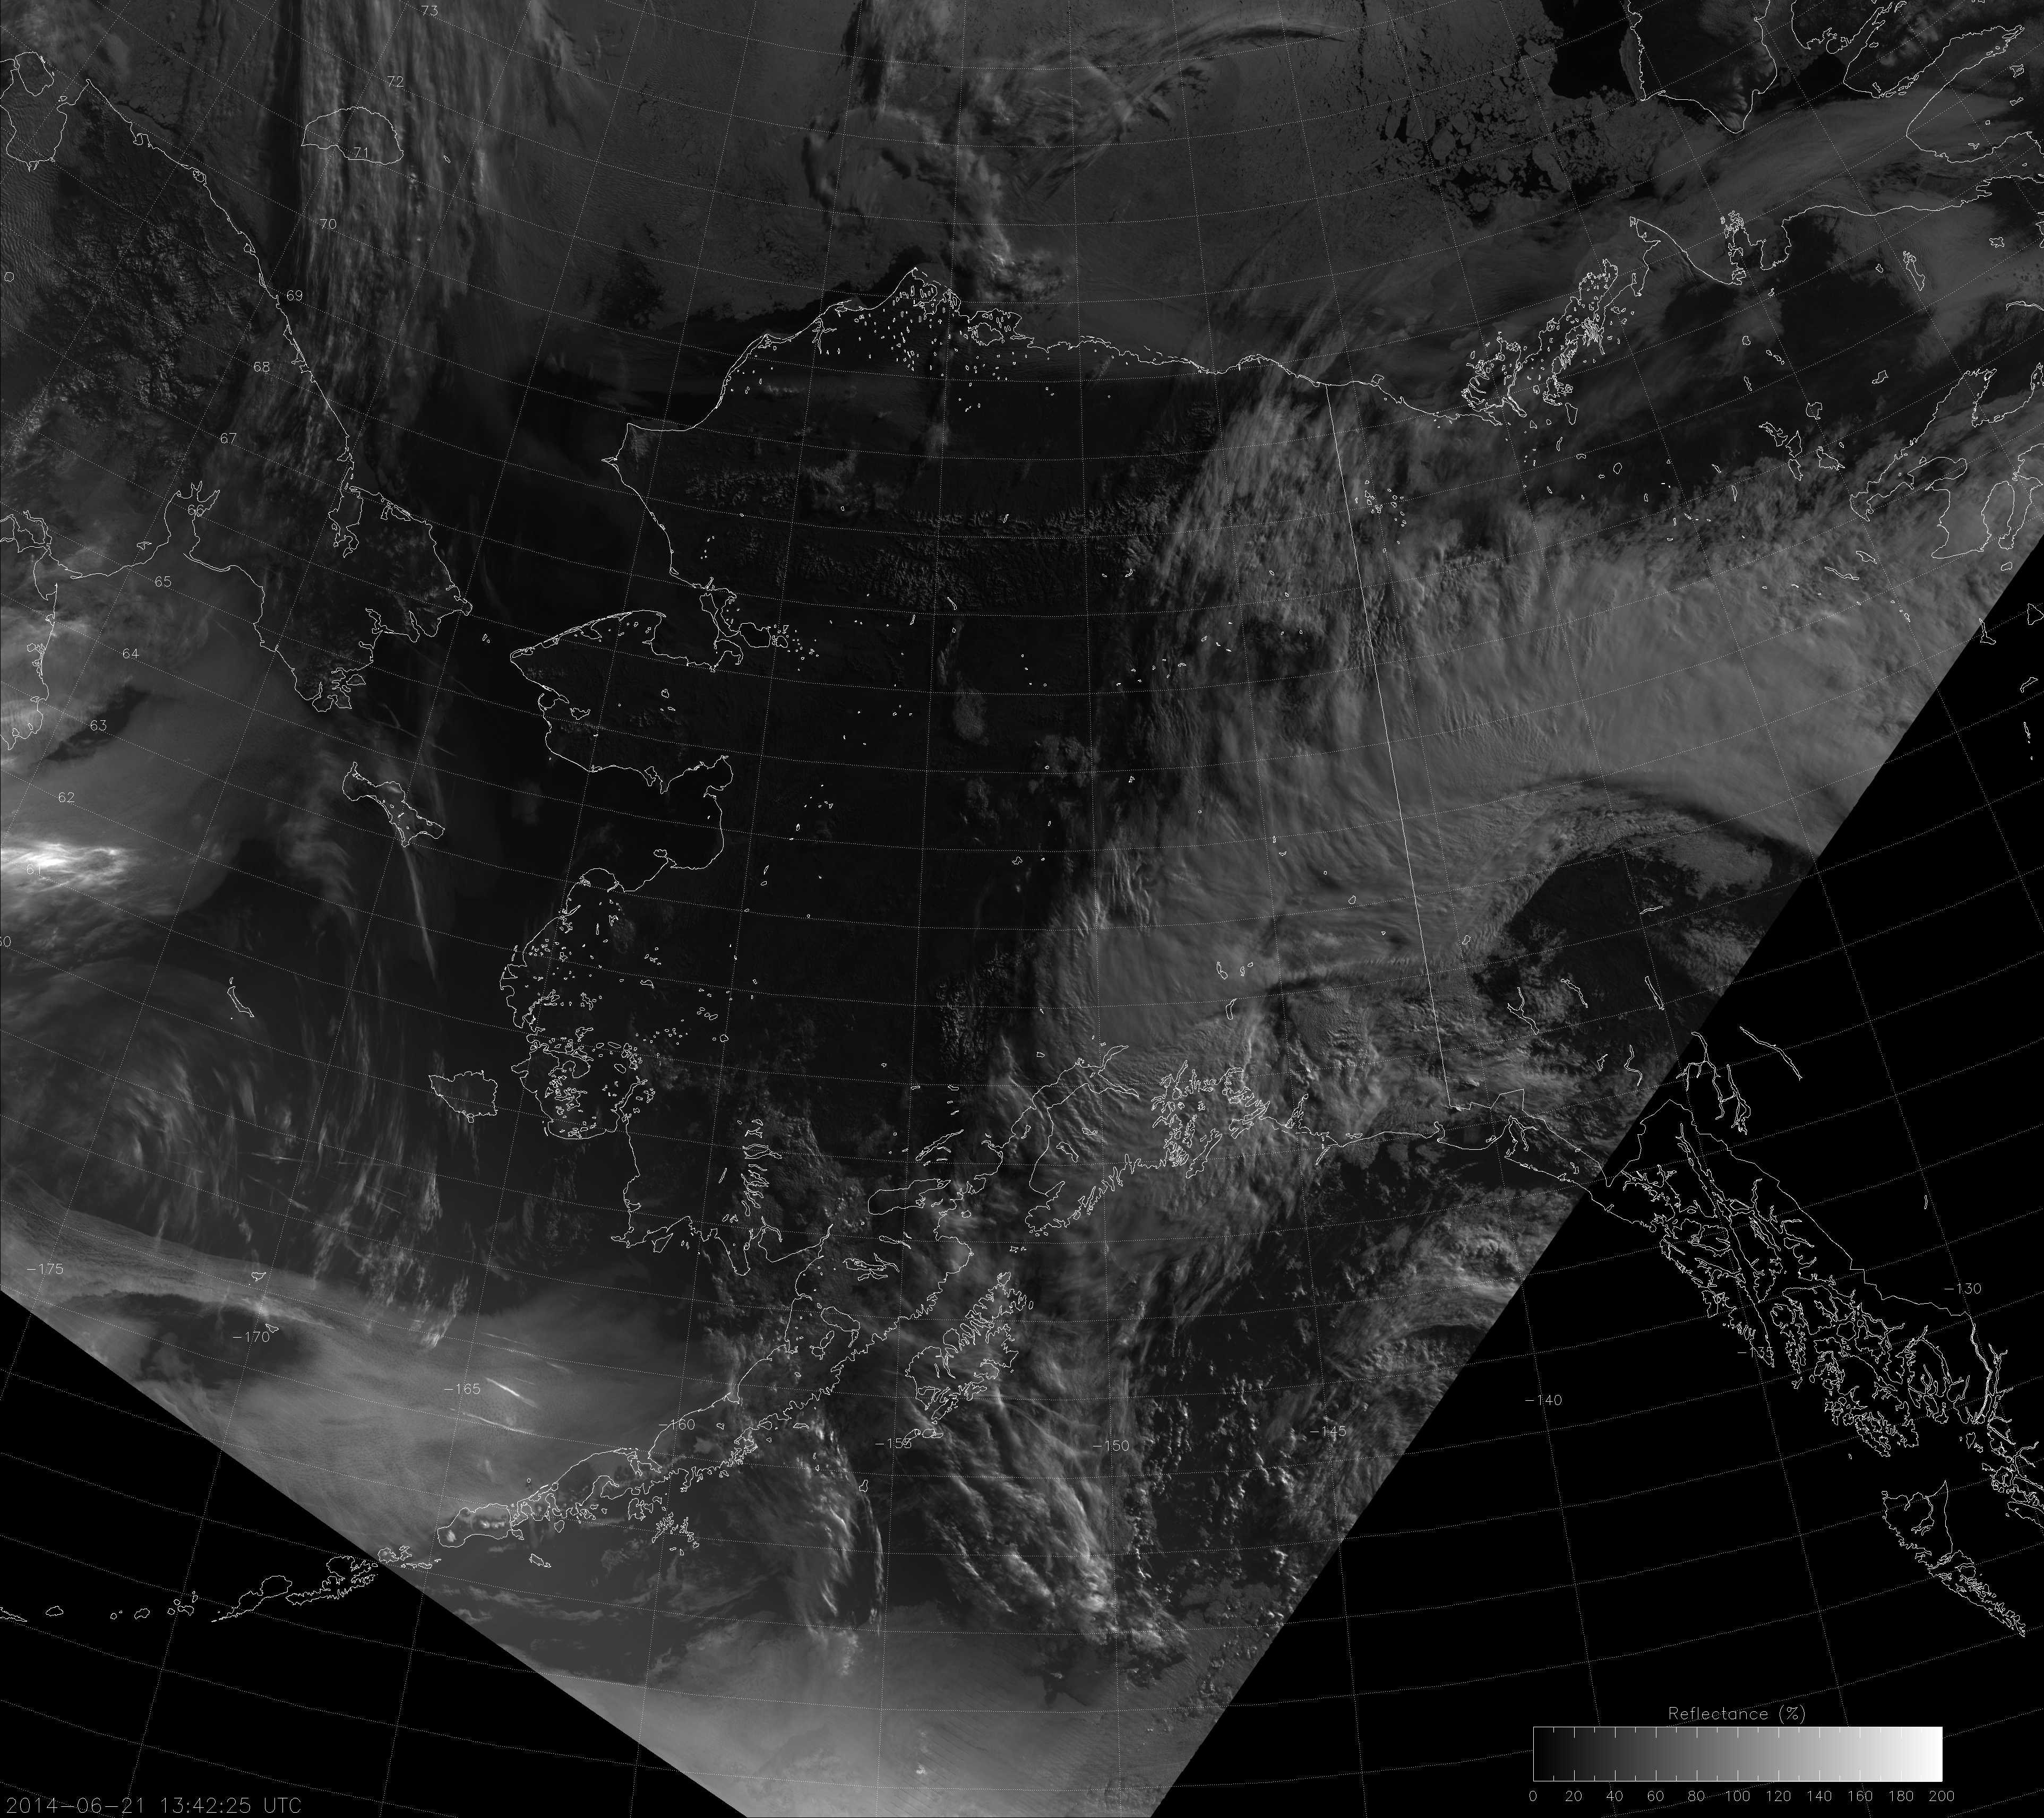
The first example tried to divide up the image into a “day” side, “night” side and “twilight” area in-between, then scale each region independently of the others. Of course, that leads to discontinuities at the boundaries of each region. (The brightest “twilight” pixels border the darkest “day” pixels, etc.)
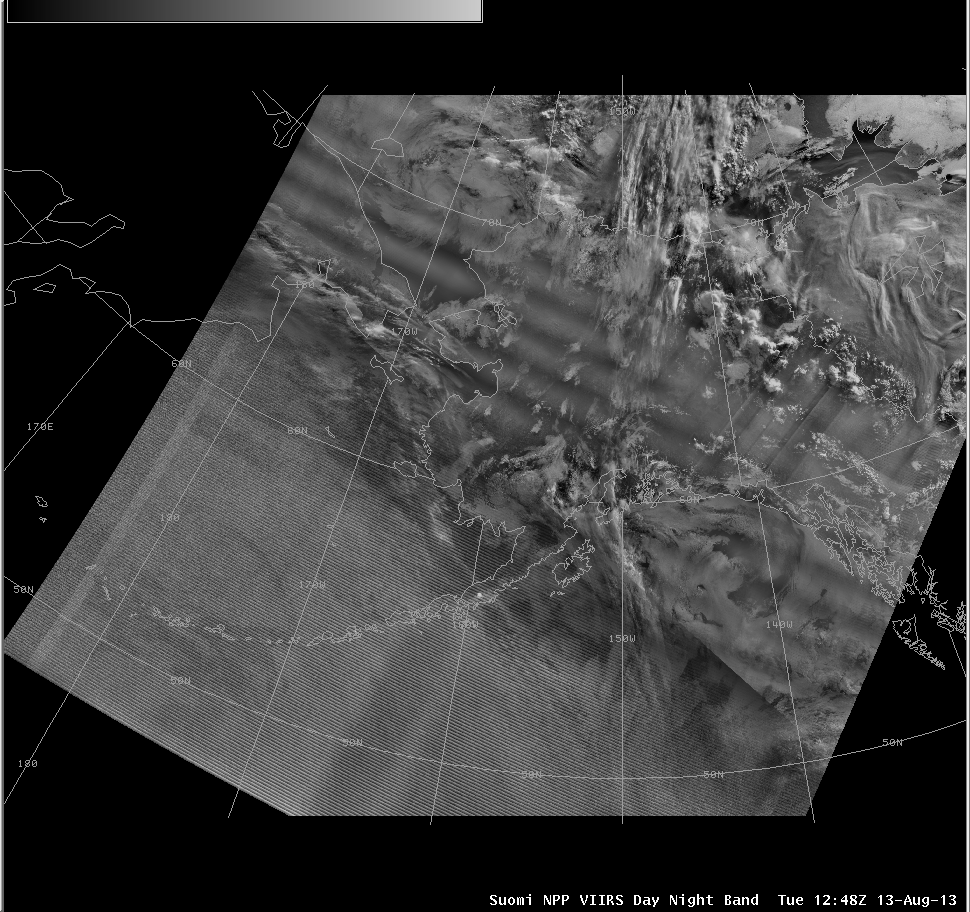
The second example broke up the image into many different zones based on solar zenith angle, and then (I assume) applied some kind of smoothing to prevent discontinuities. But, you still end up with a wavy pattern of anomalously brighter and darker areas within each solar zenith angle zones. That’s distracting.
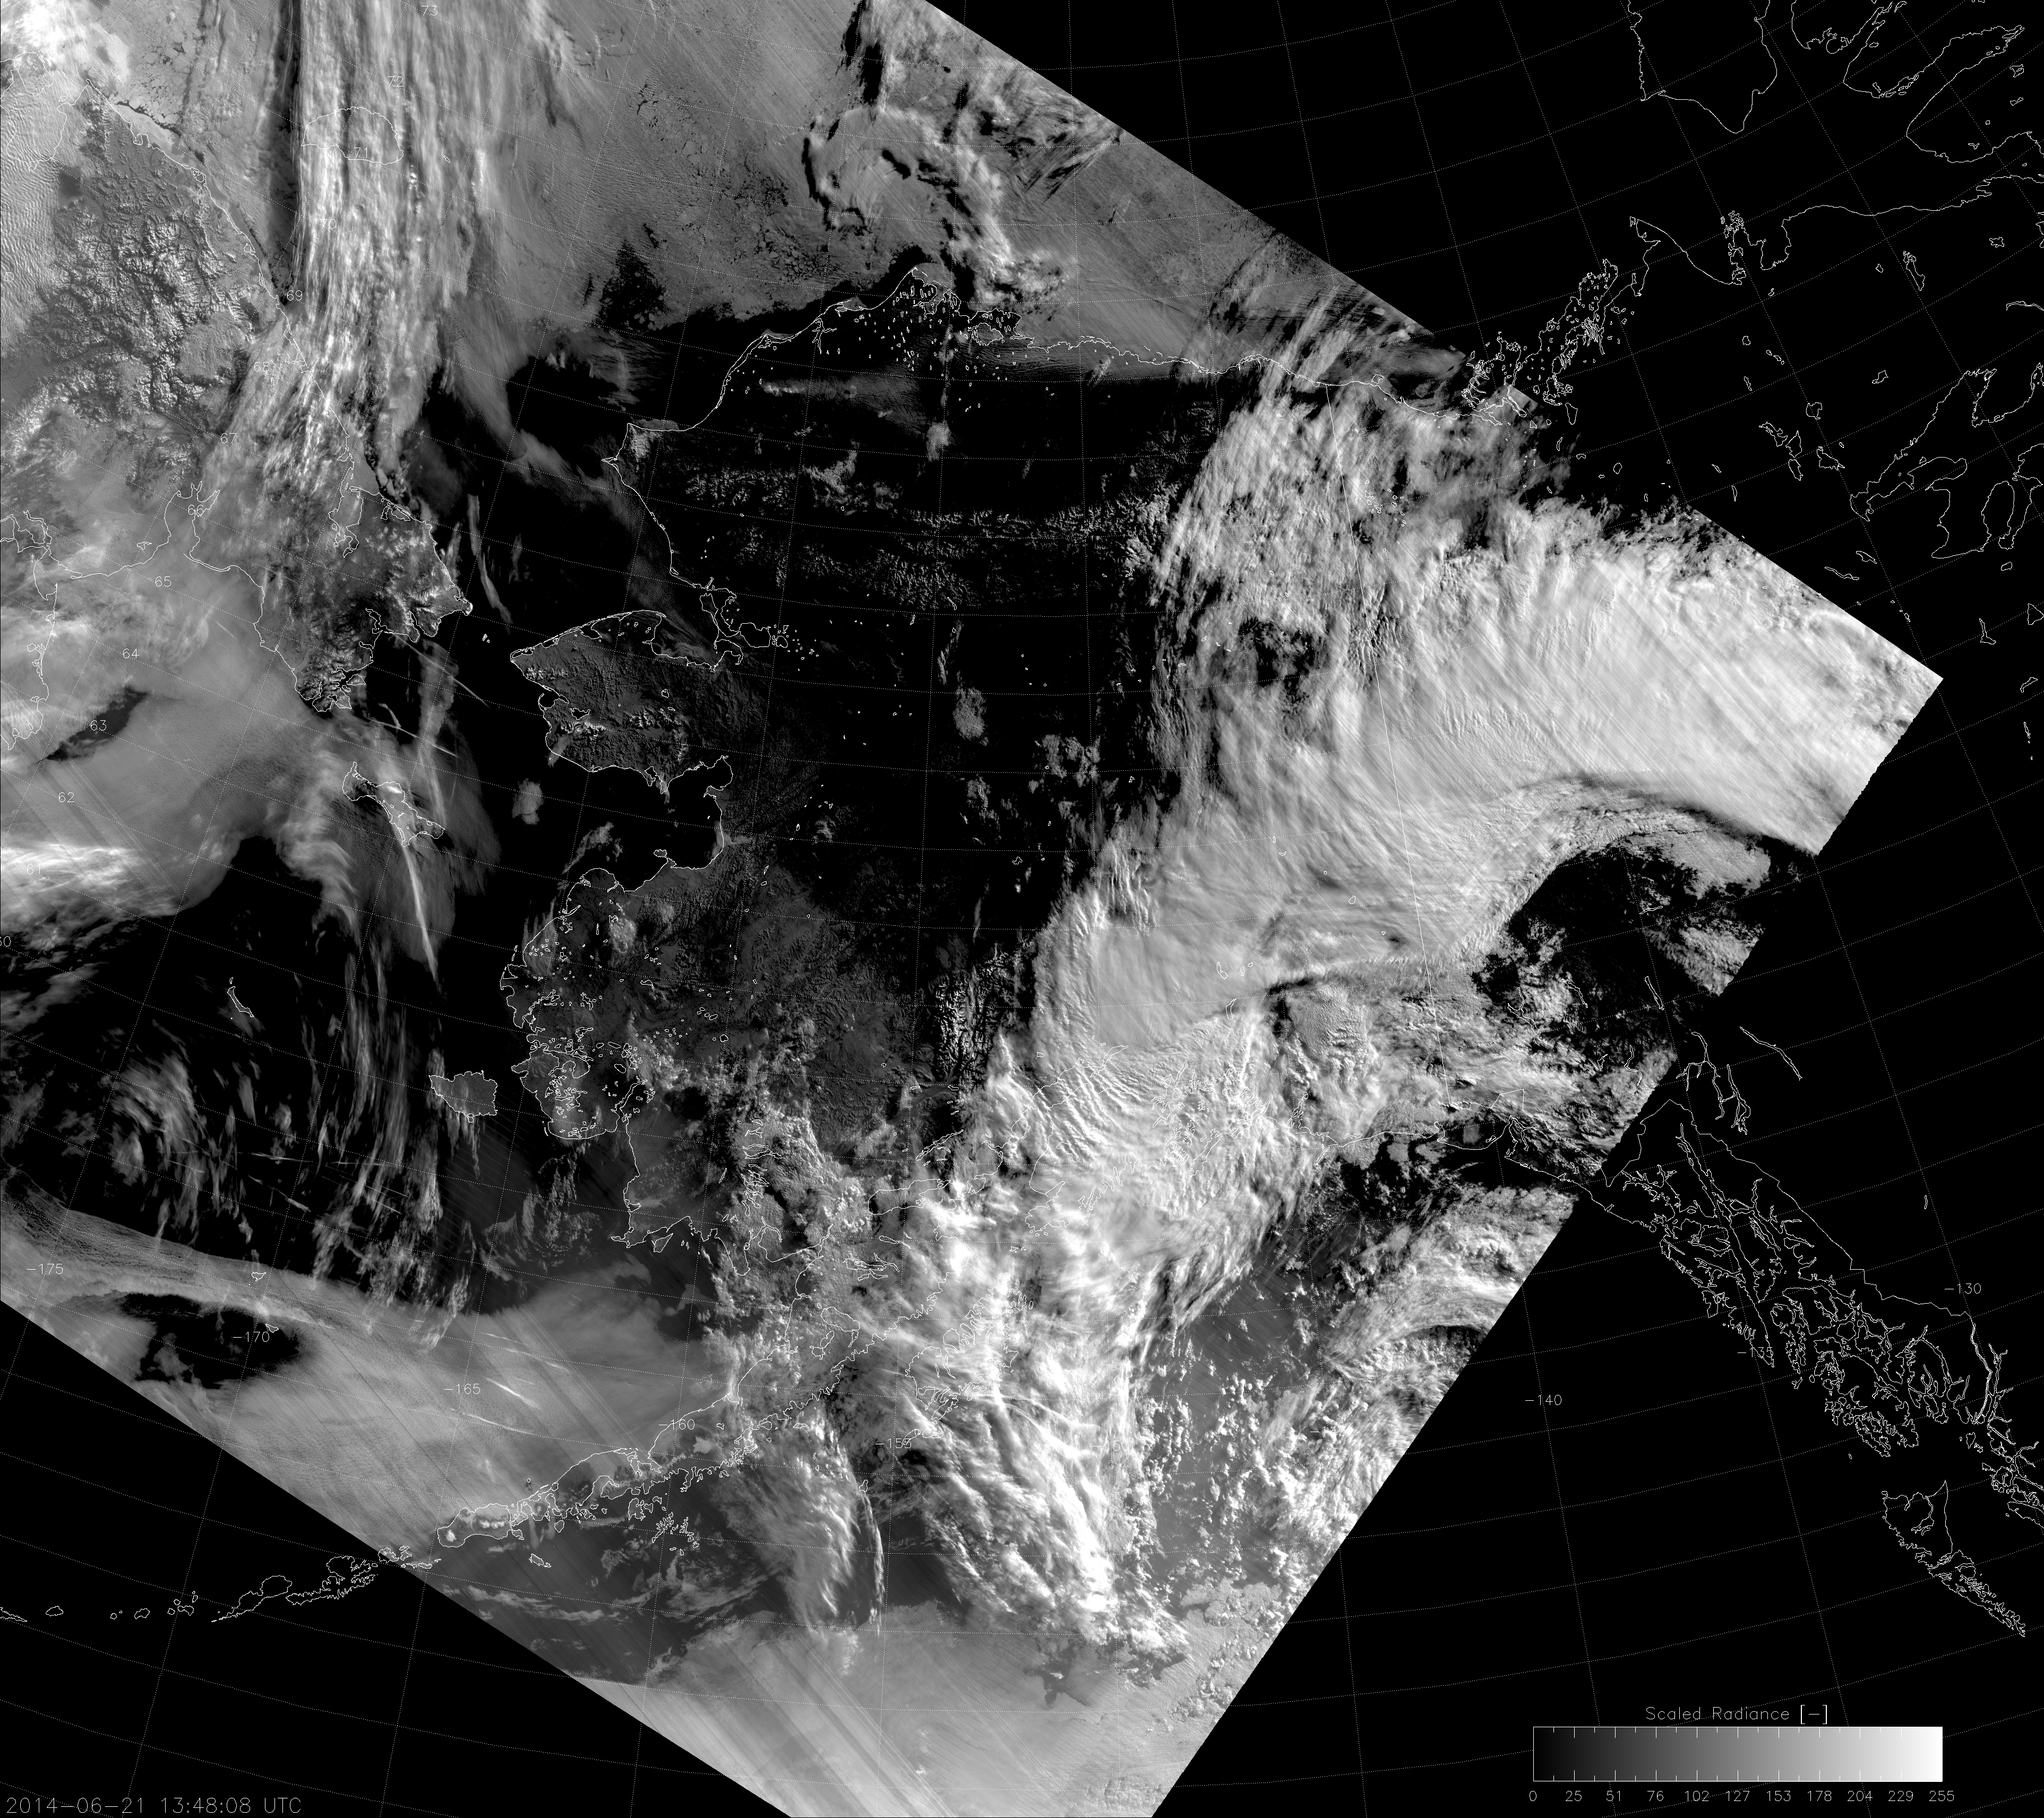
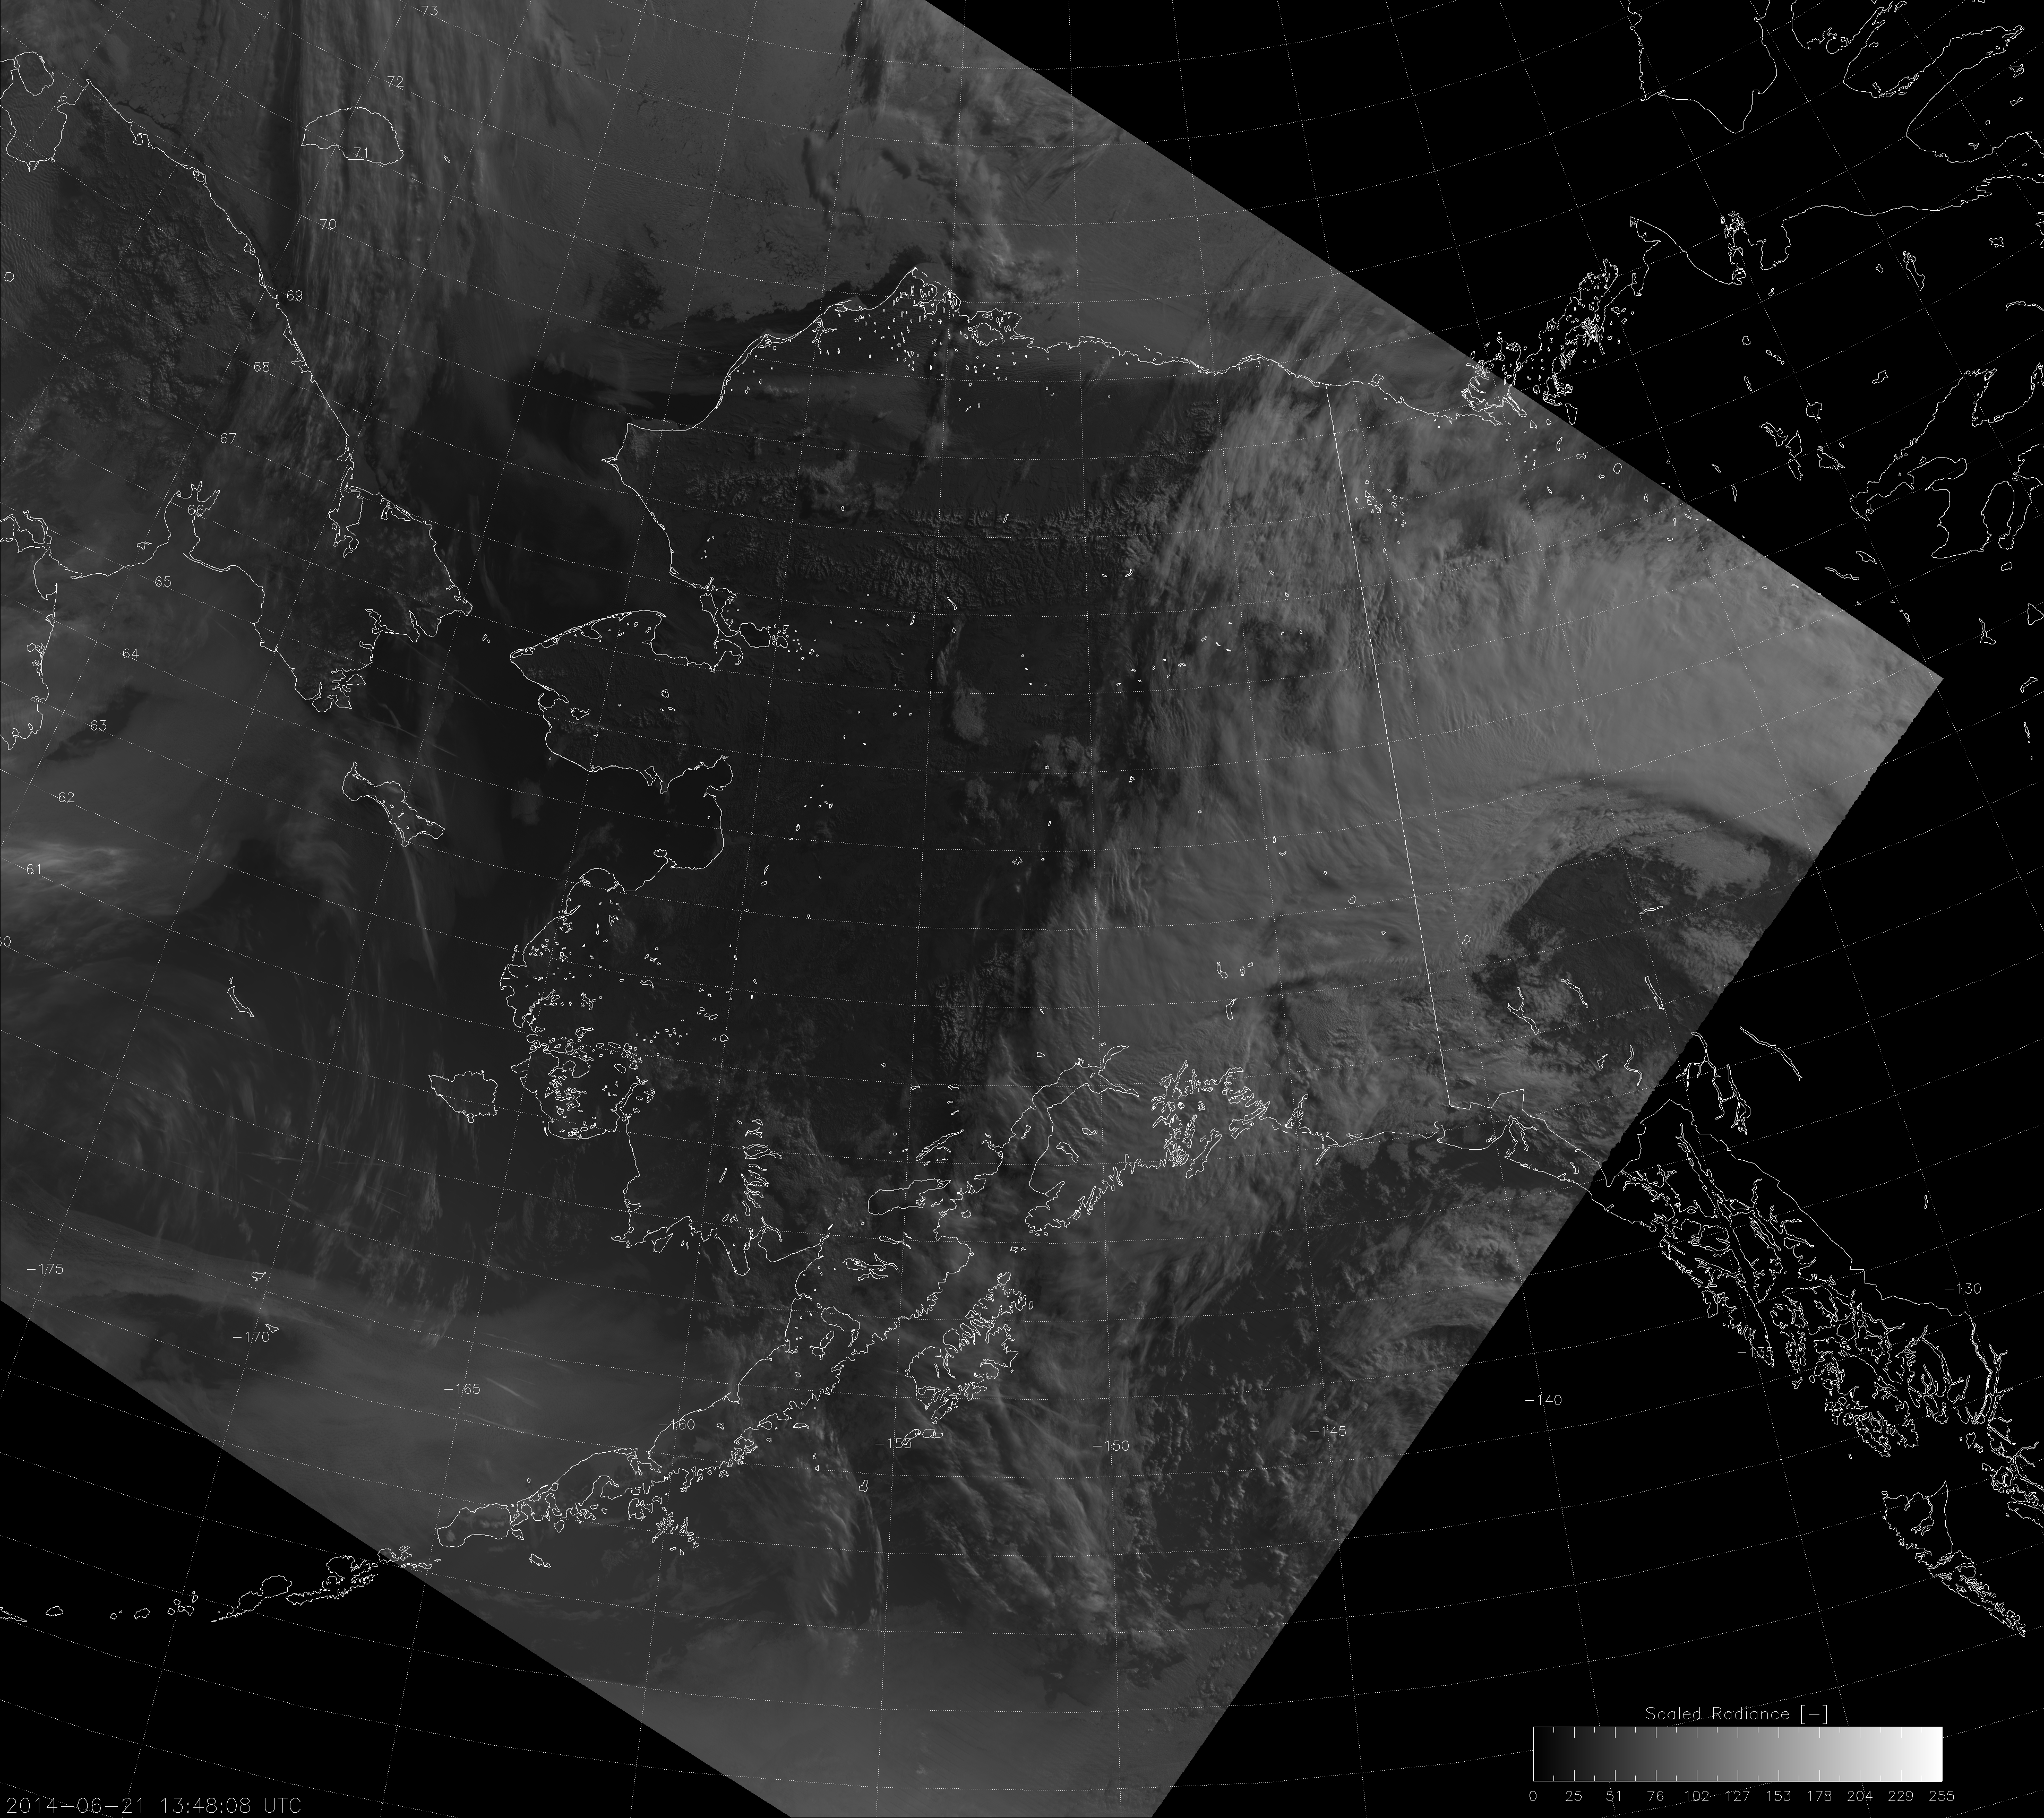
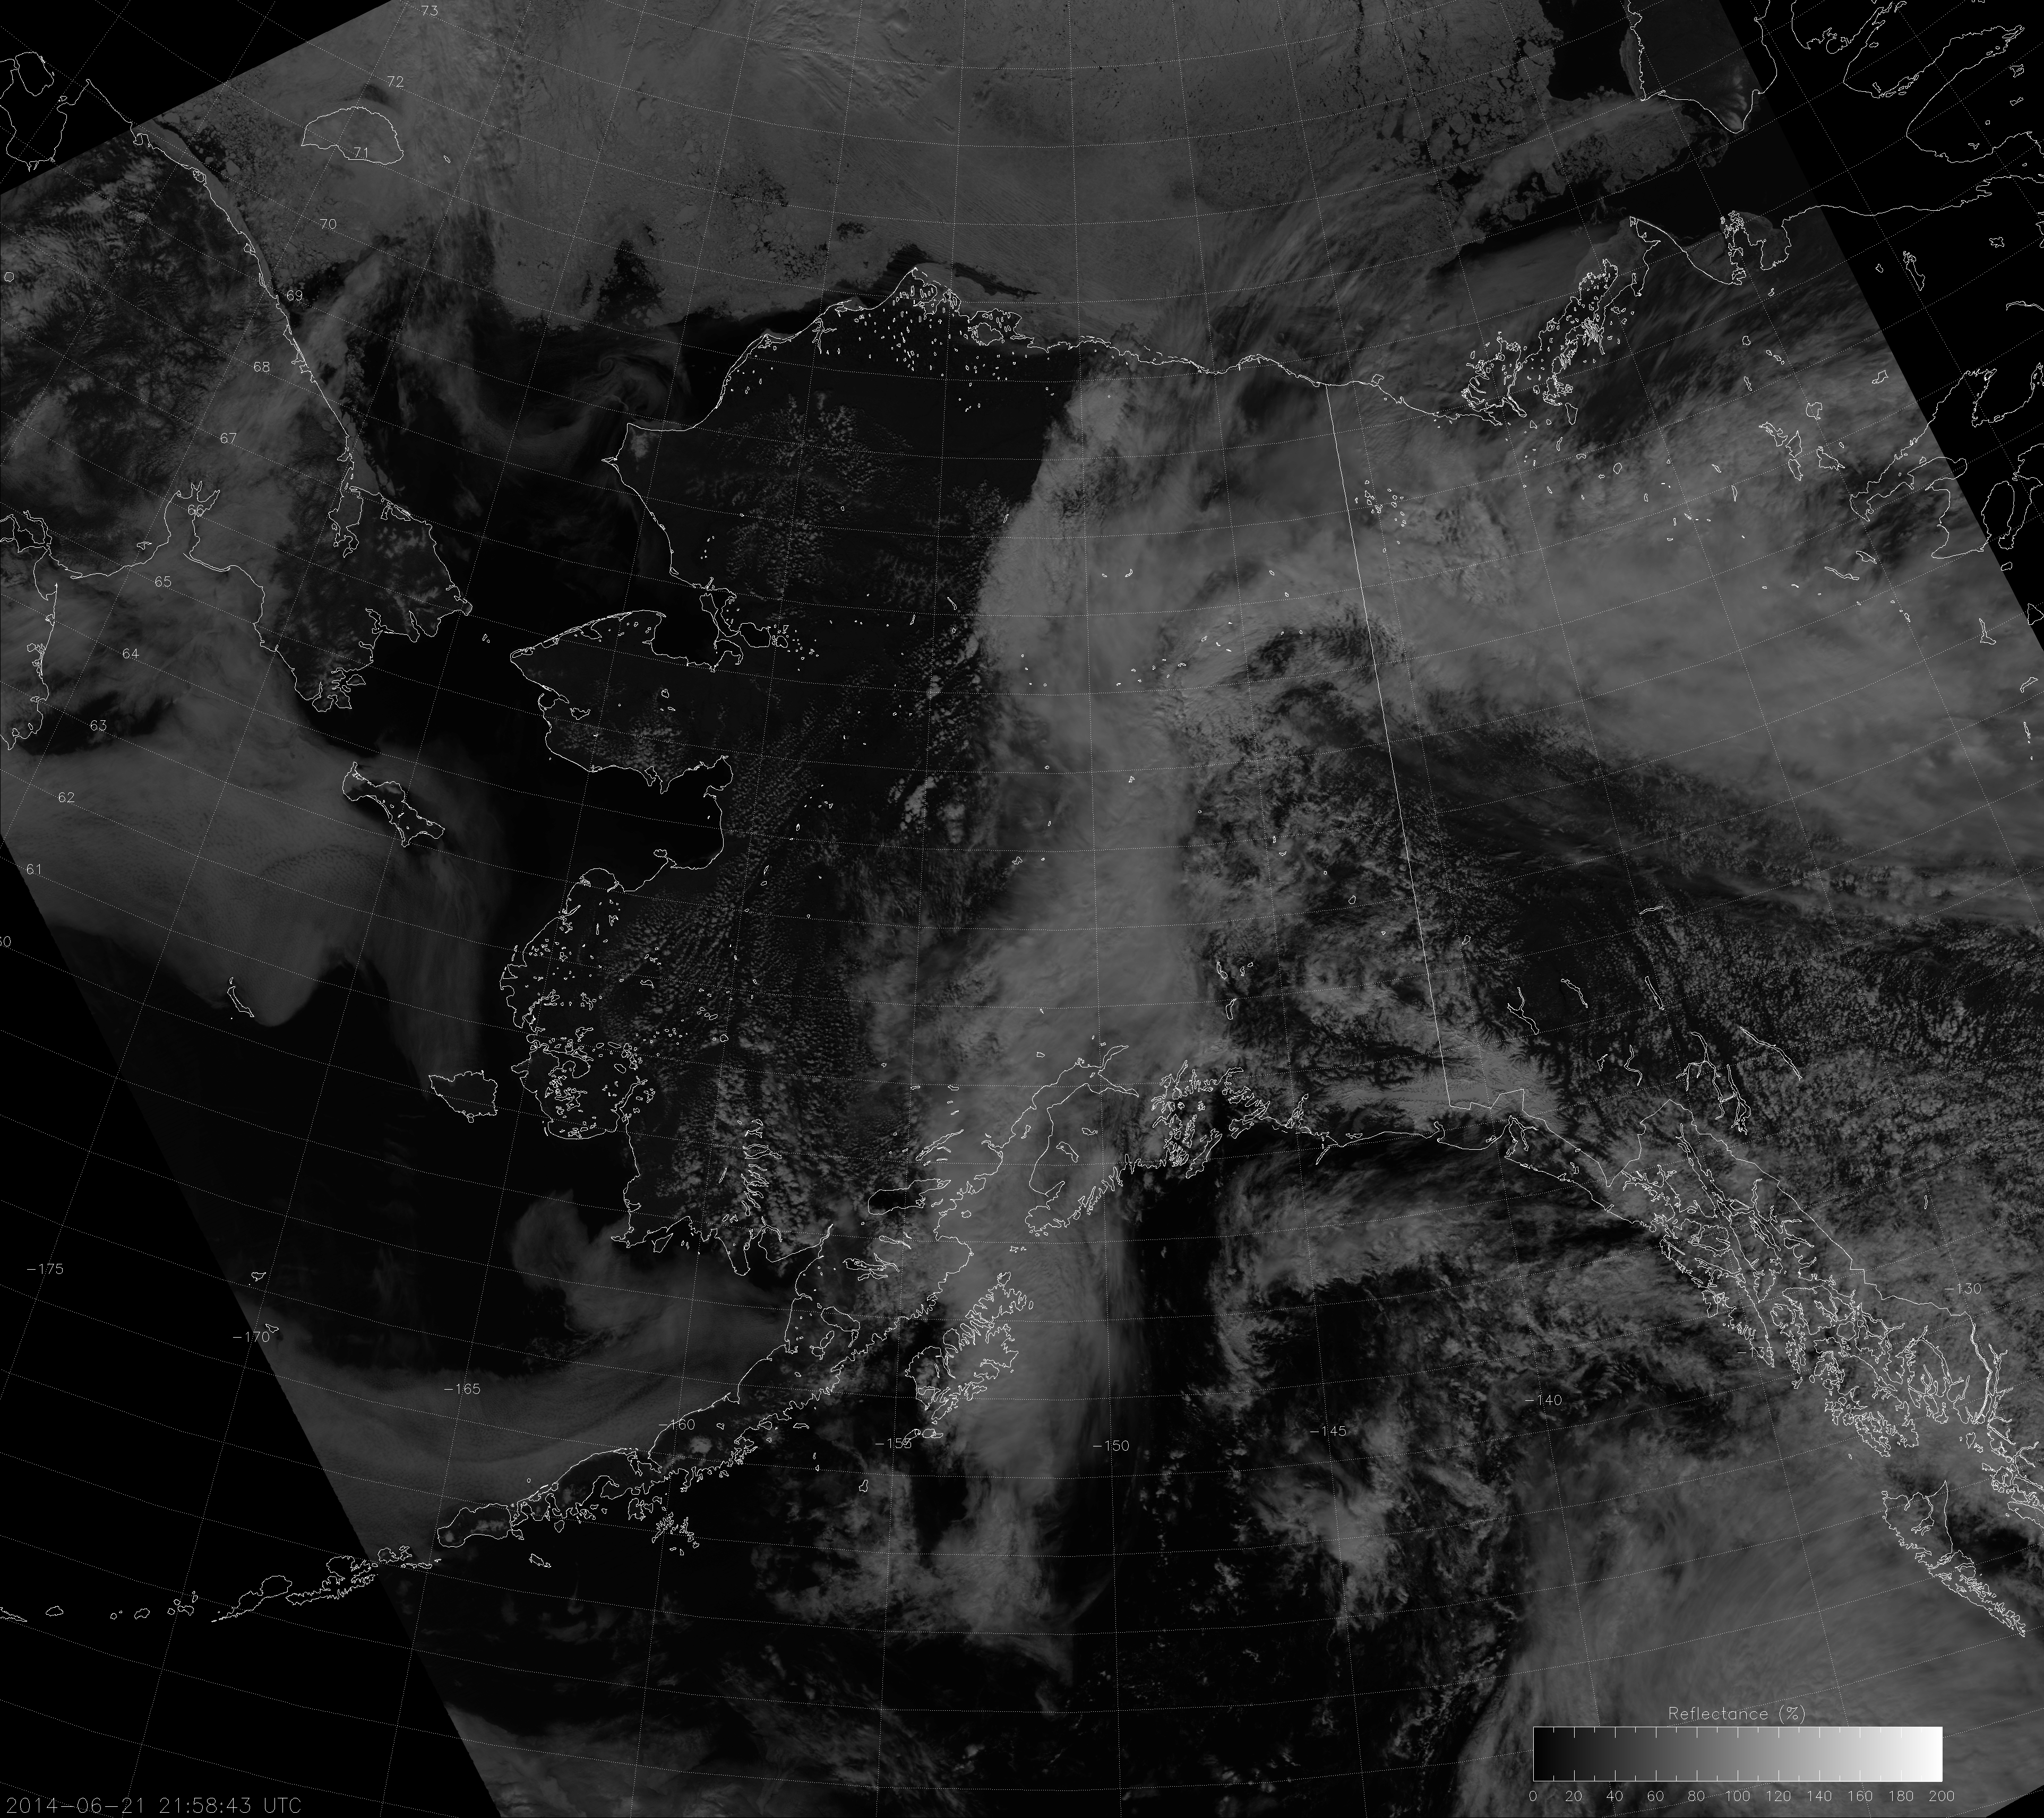
When I was developing software to produce Day/Night Band imagery from across the globe, I thought I had something when I scaled the imagery based on the median radiance values in the image. (If you want to know how it worked, it was along these lines: scale the image linearly between max and min values where max = [median*8 < maximum data value] and min = max/256) You didn’t need to know if it was day or night. Unlike before, this scaling didn’t highlight the day side or the night side when the terminator was in the scene. It highlighted the twilight zone (Ahhh! Run away!), like this:
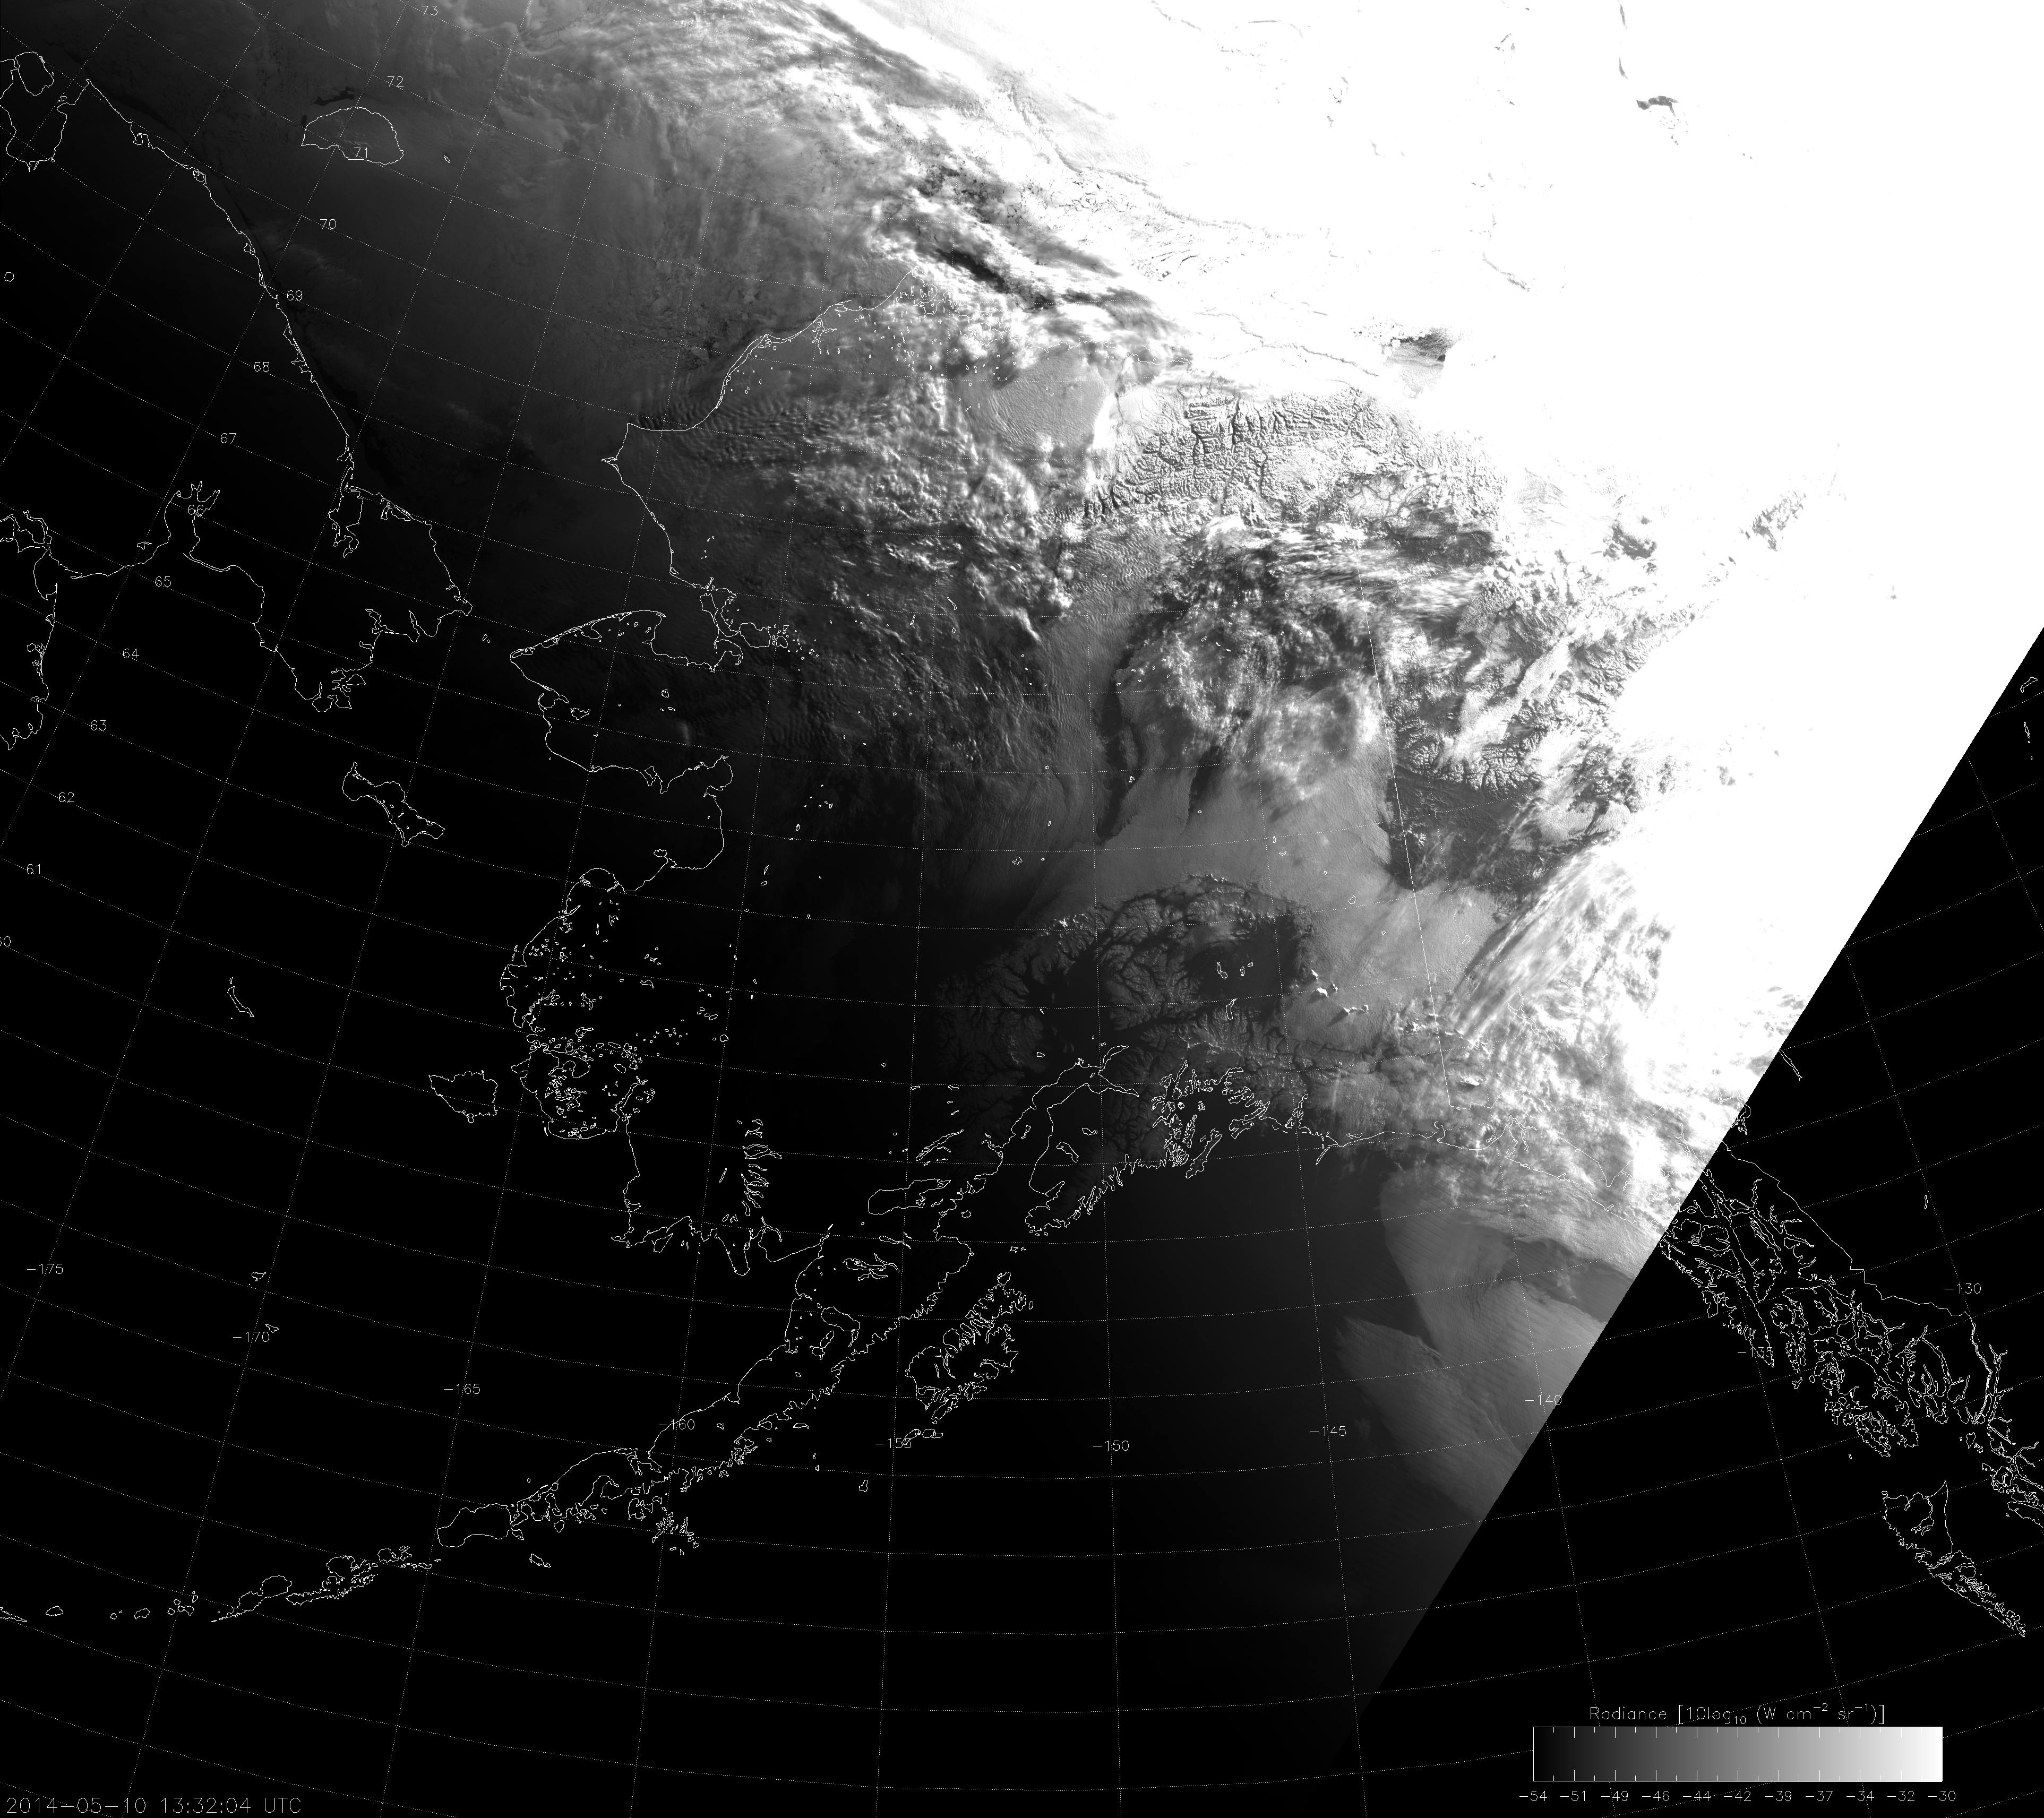
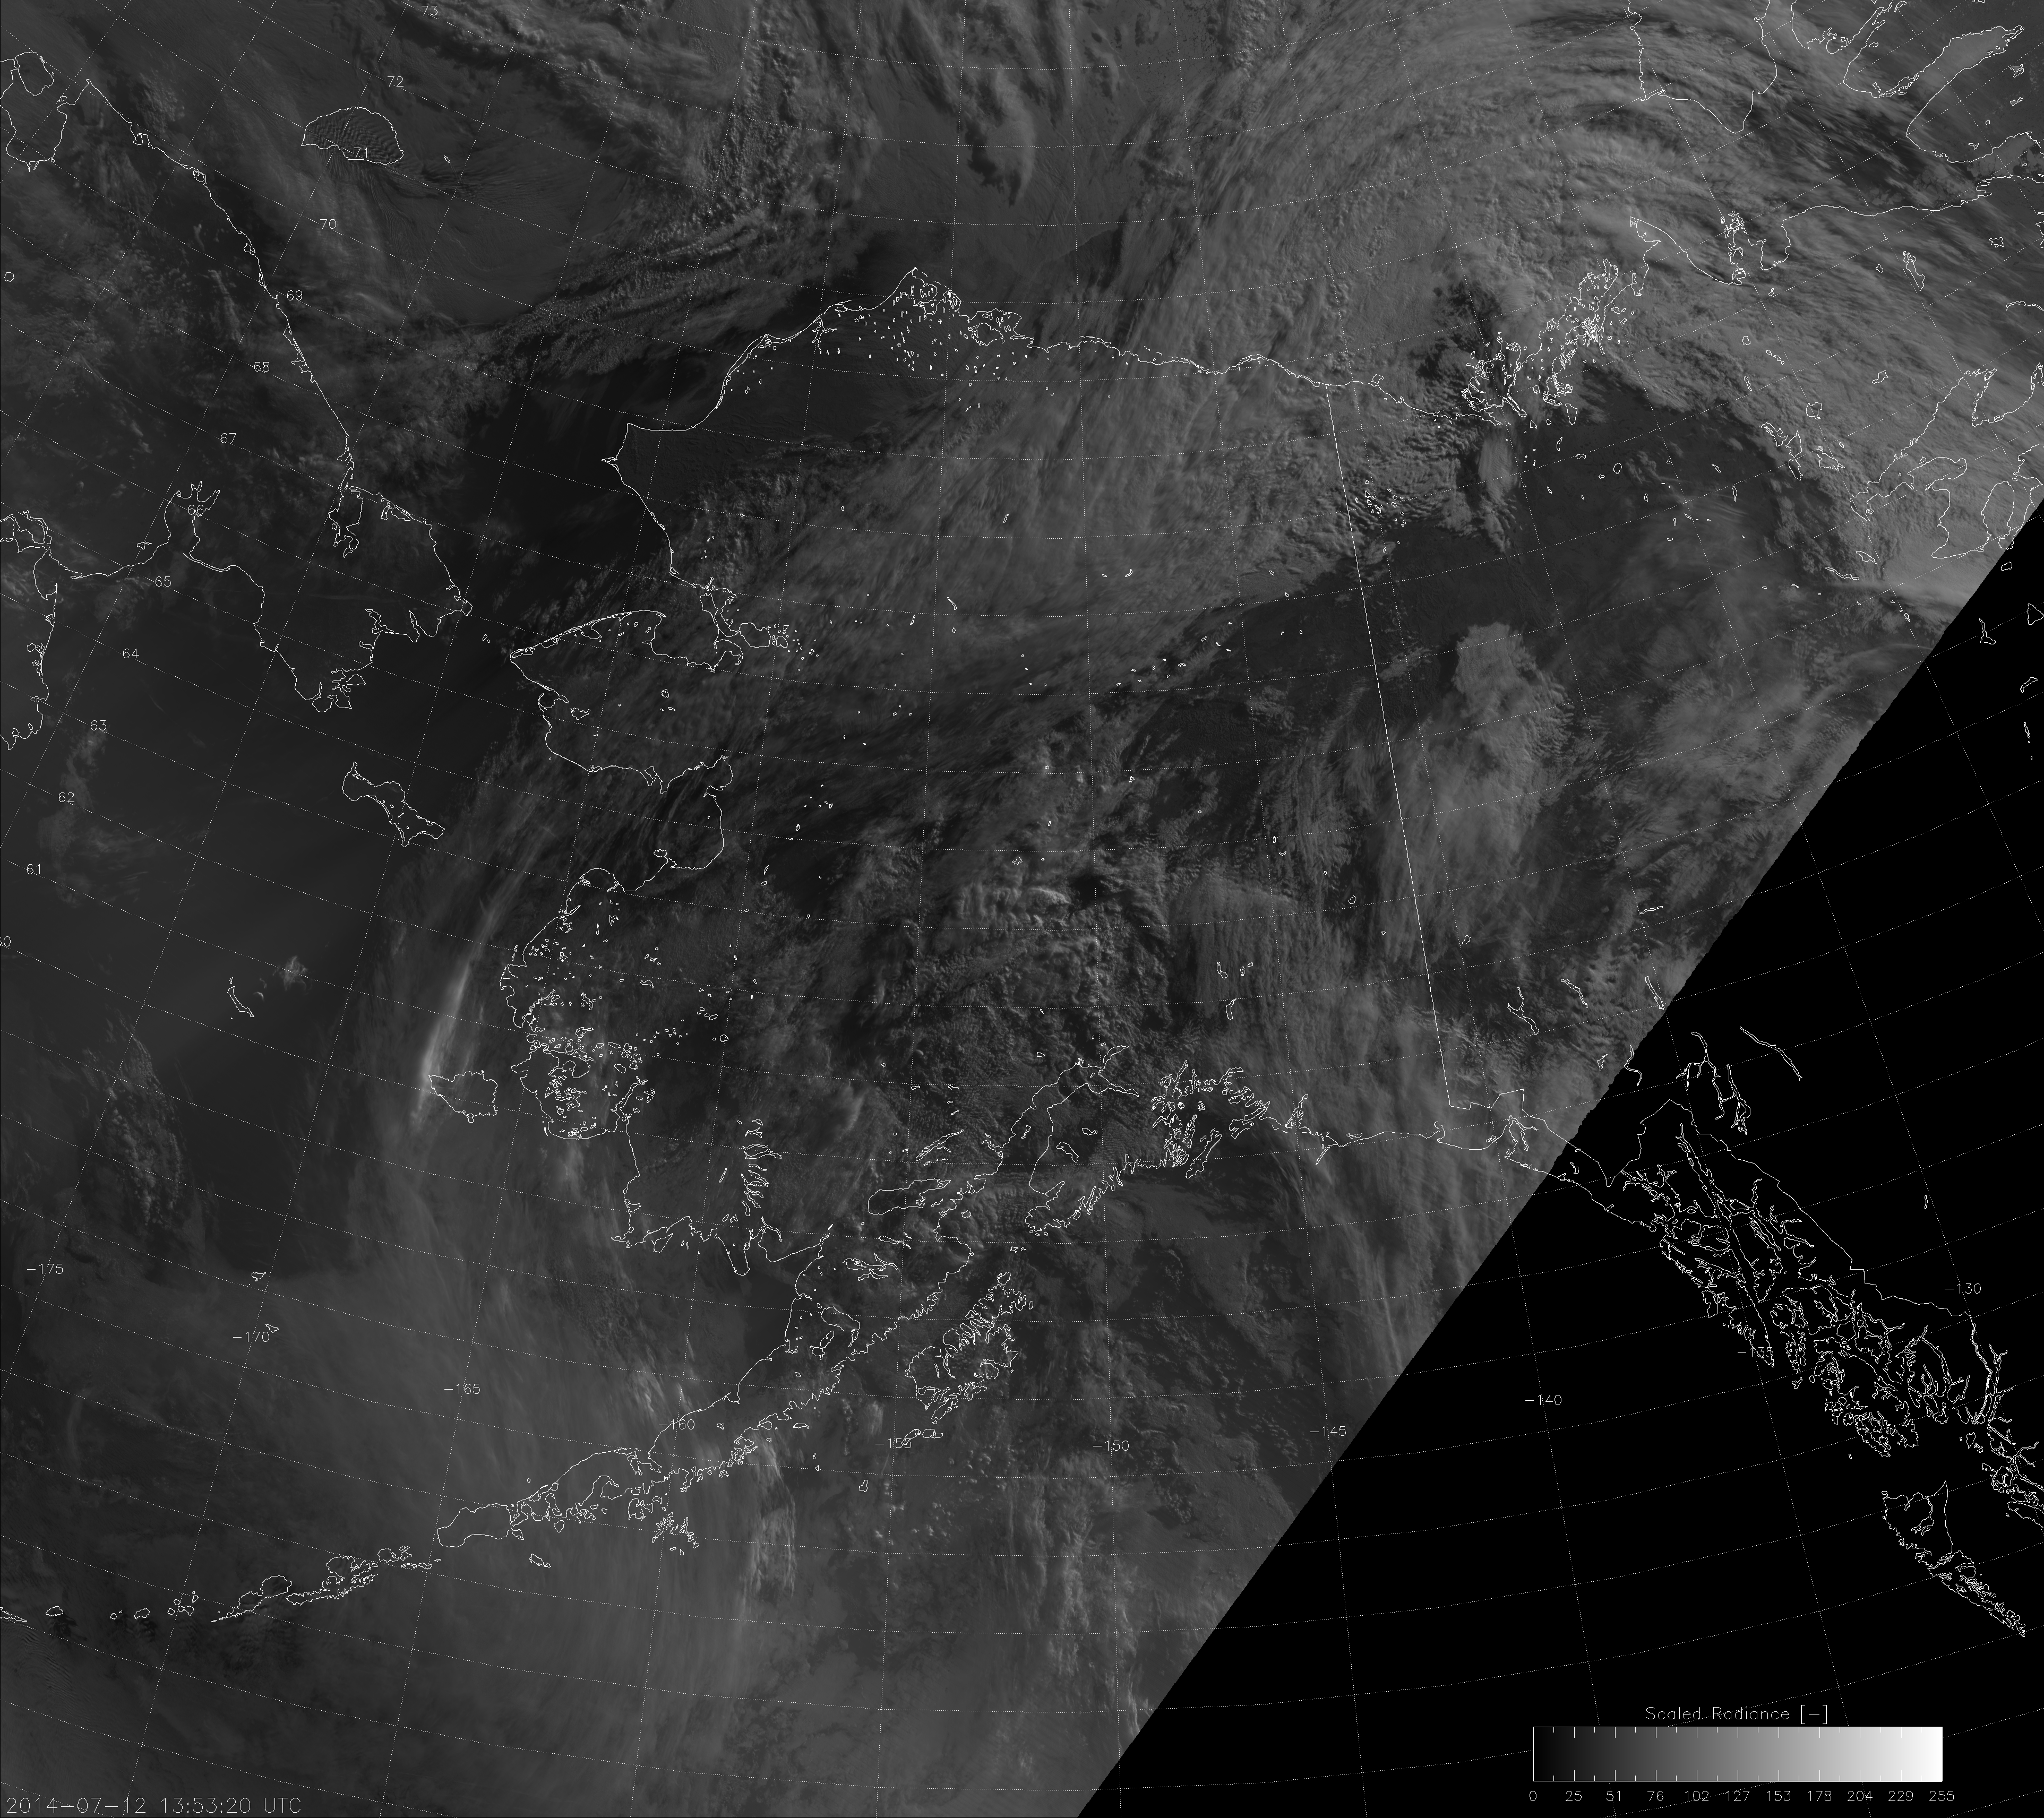
Not perfect. But, in my defense, this scaling does work for most of the globe. The tropical group at CIRA uses it for their DNB images on “TC Realtime“. Also, it doesn’t work too bad near the solstice, when most of Alaska is on the “day” side of the terminator, even in the primary “nighttime” overpass:
It has the added benefit that you can associate each level of brightness with a specific radiance value.
Now, I was going to leave my DNB scaling as is because, “Hey, we can just use the Near Constant Contrast (NCC) in these situations. Why break my back trying to re-invent the wheel?” That is, after all, the primary point of the NCC – to make it easy to display DNB across the terminator. Then CIRA temporarily lost access to NCC data. My hand was forced. I had to think of a solution.
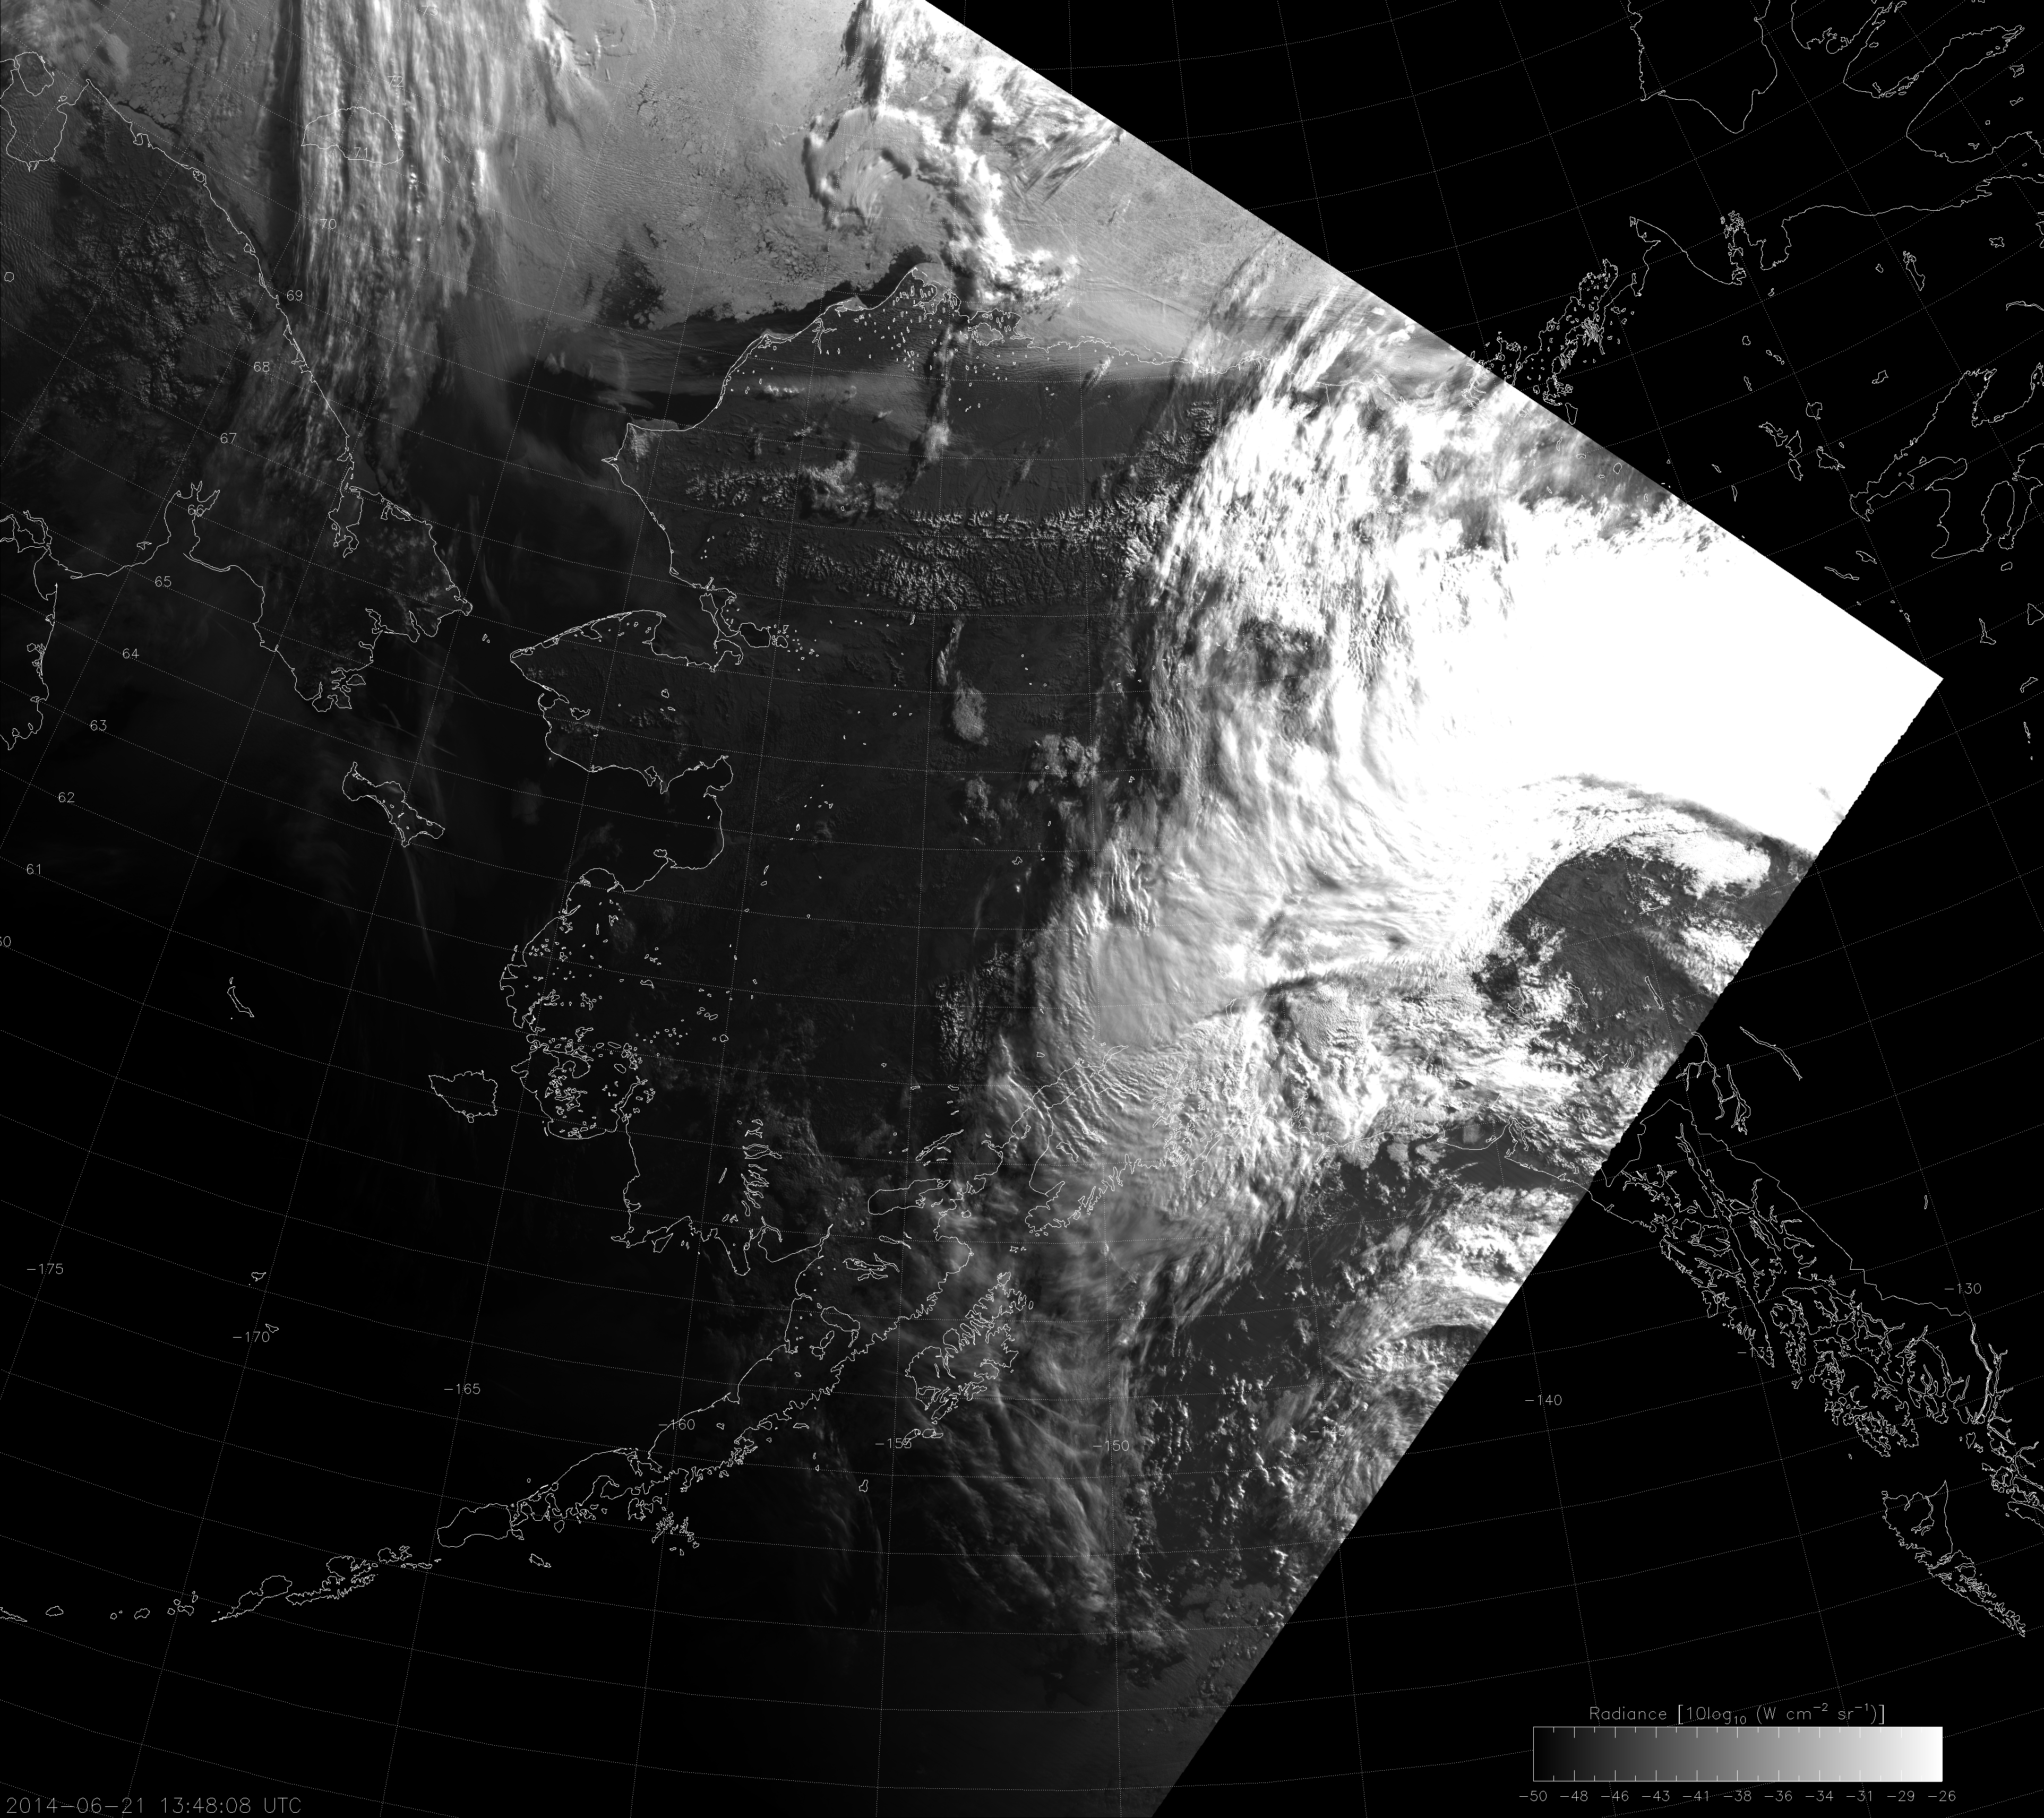
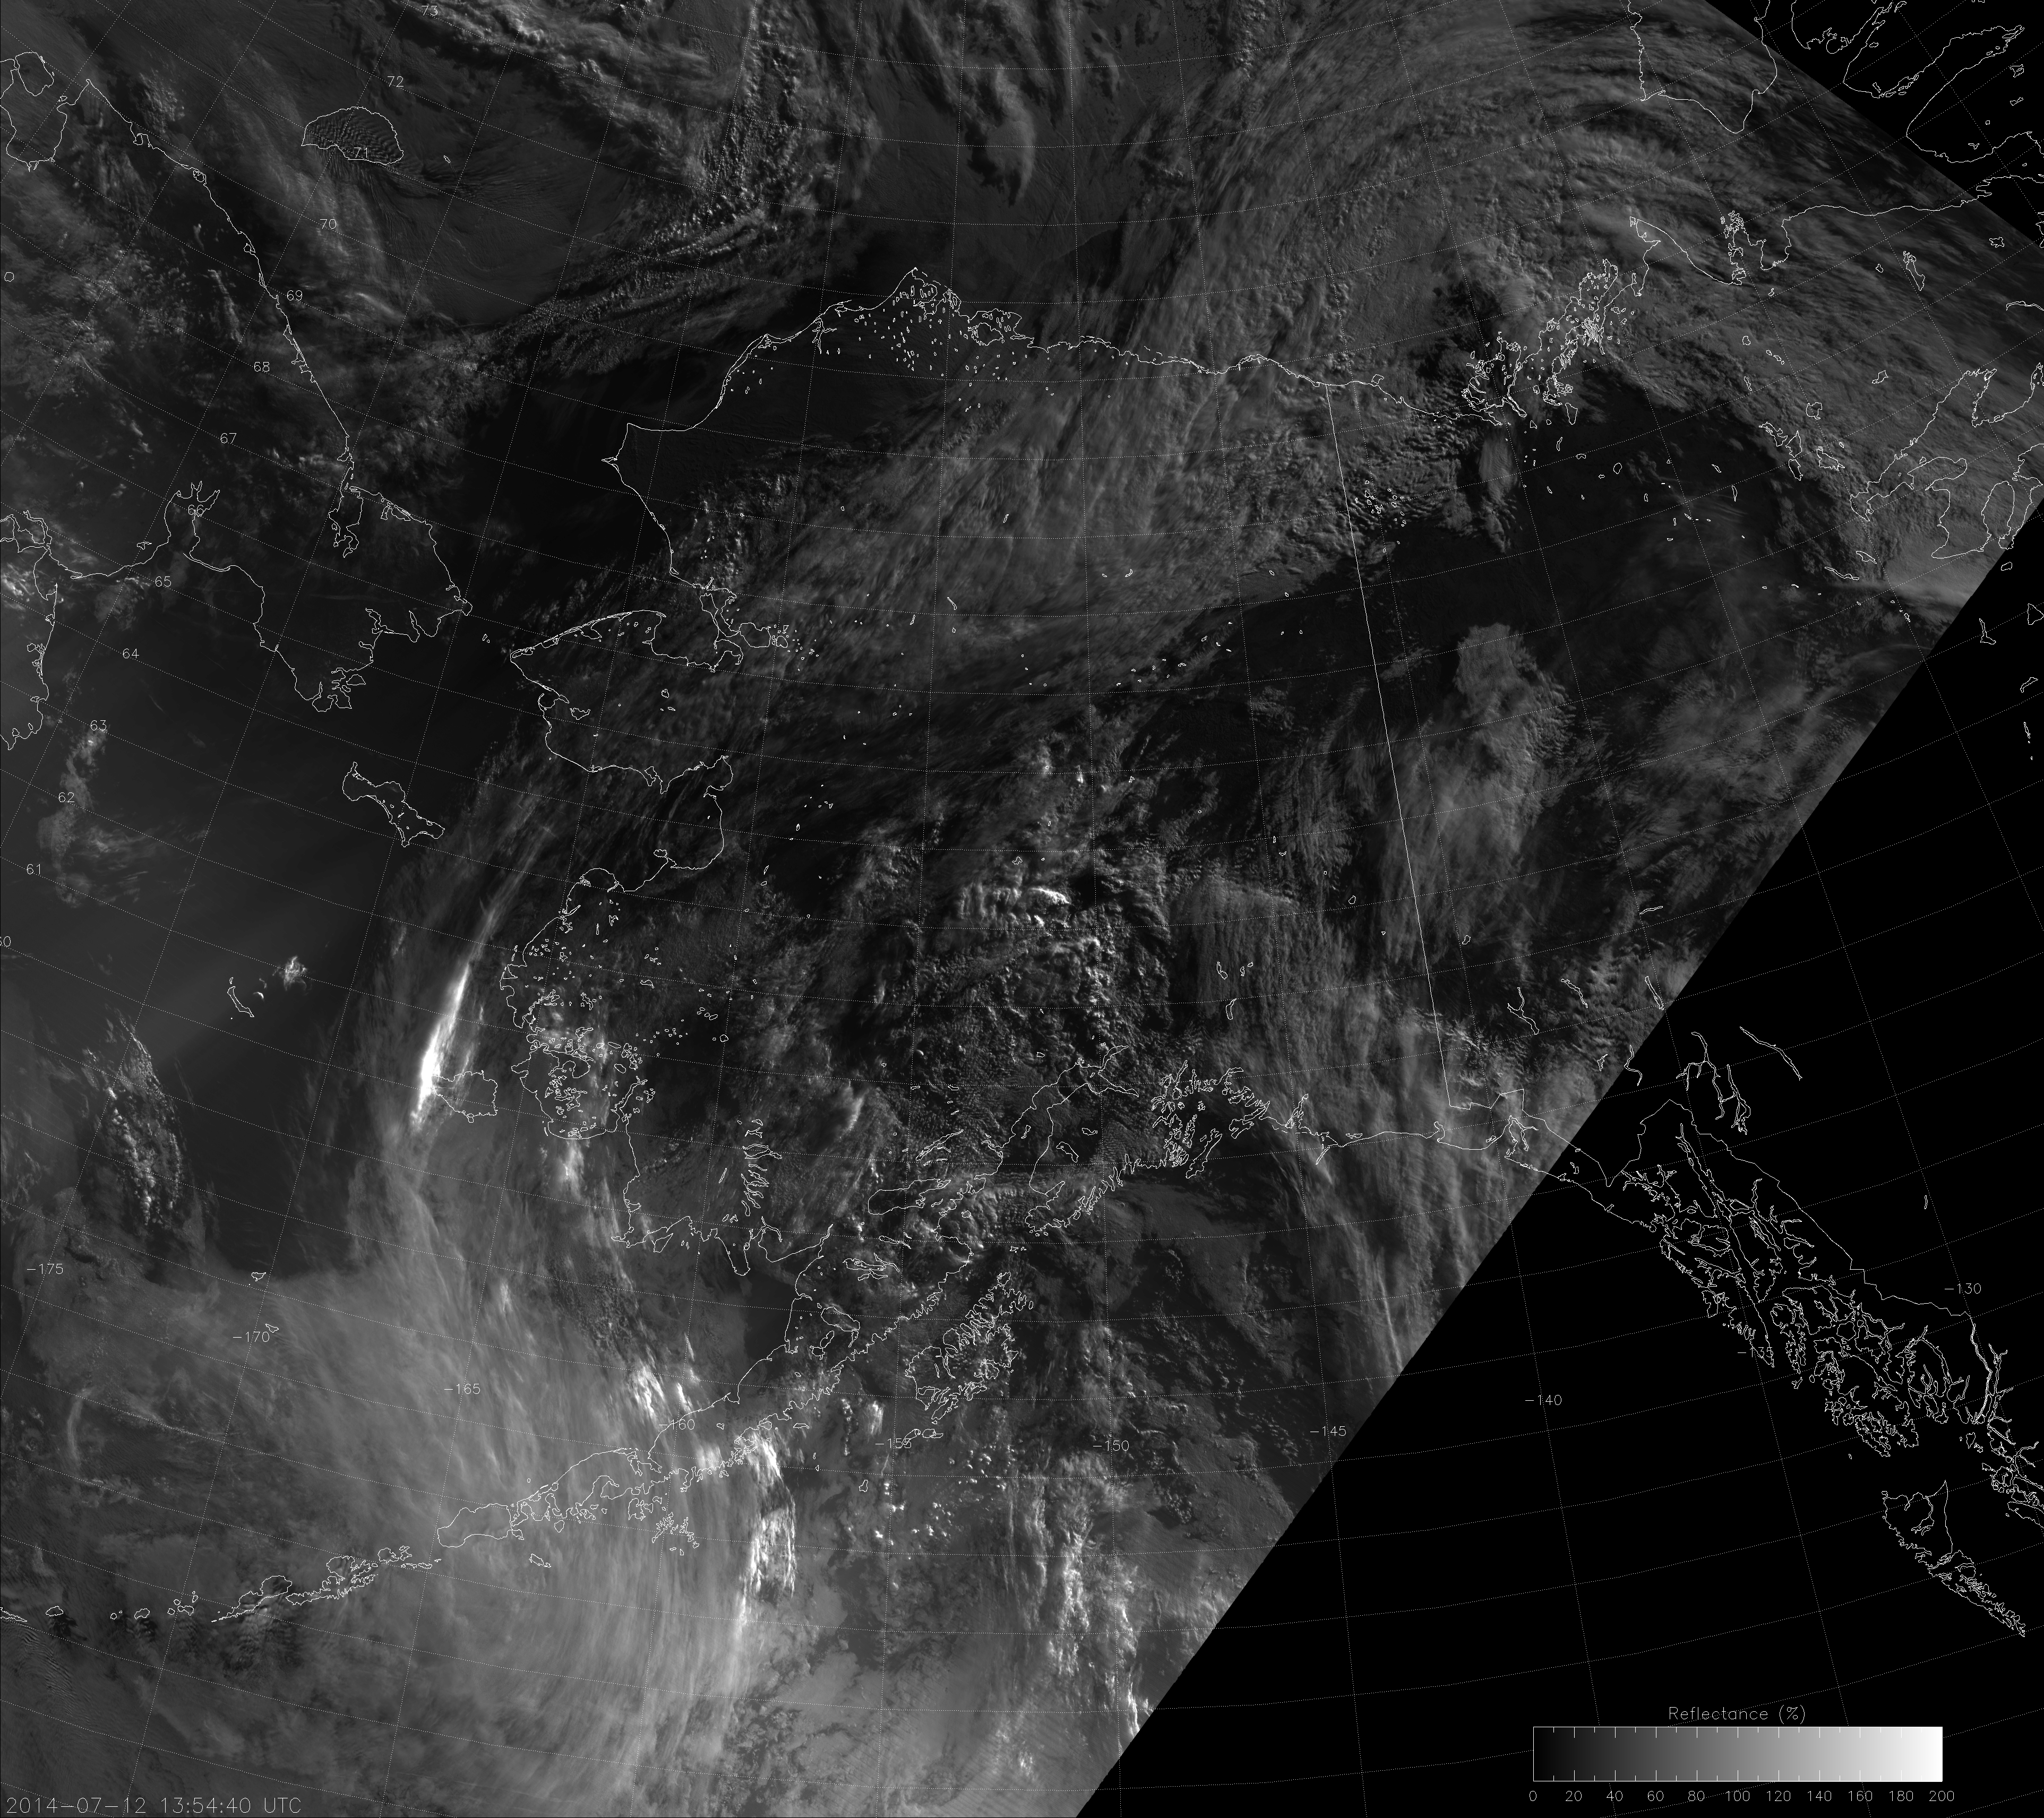
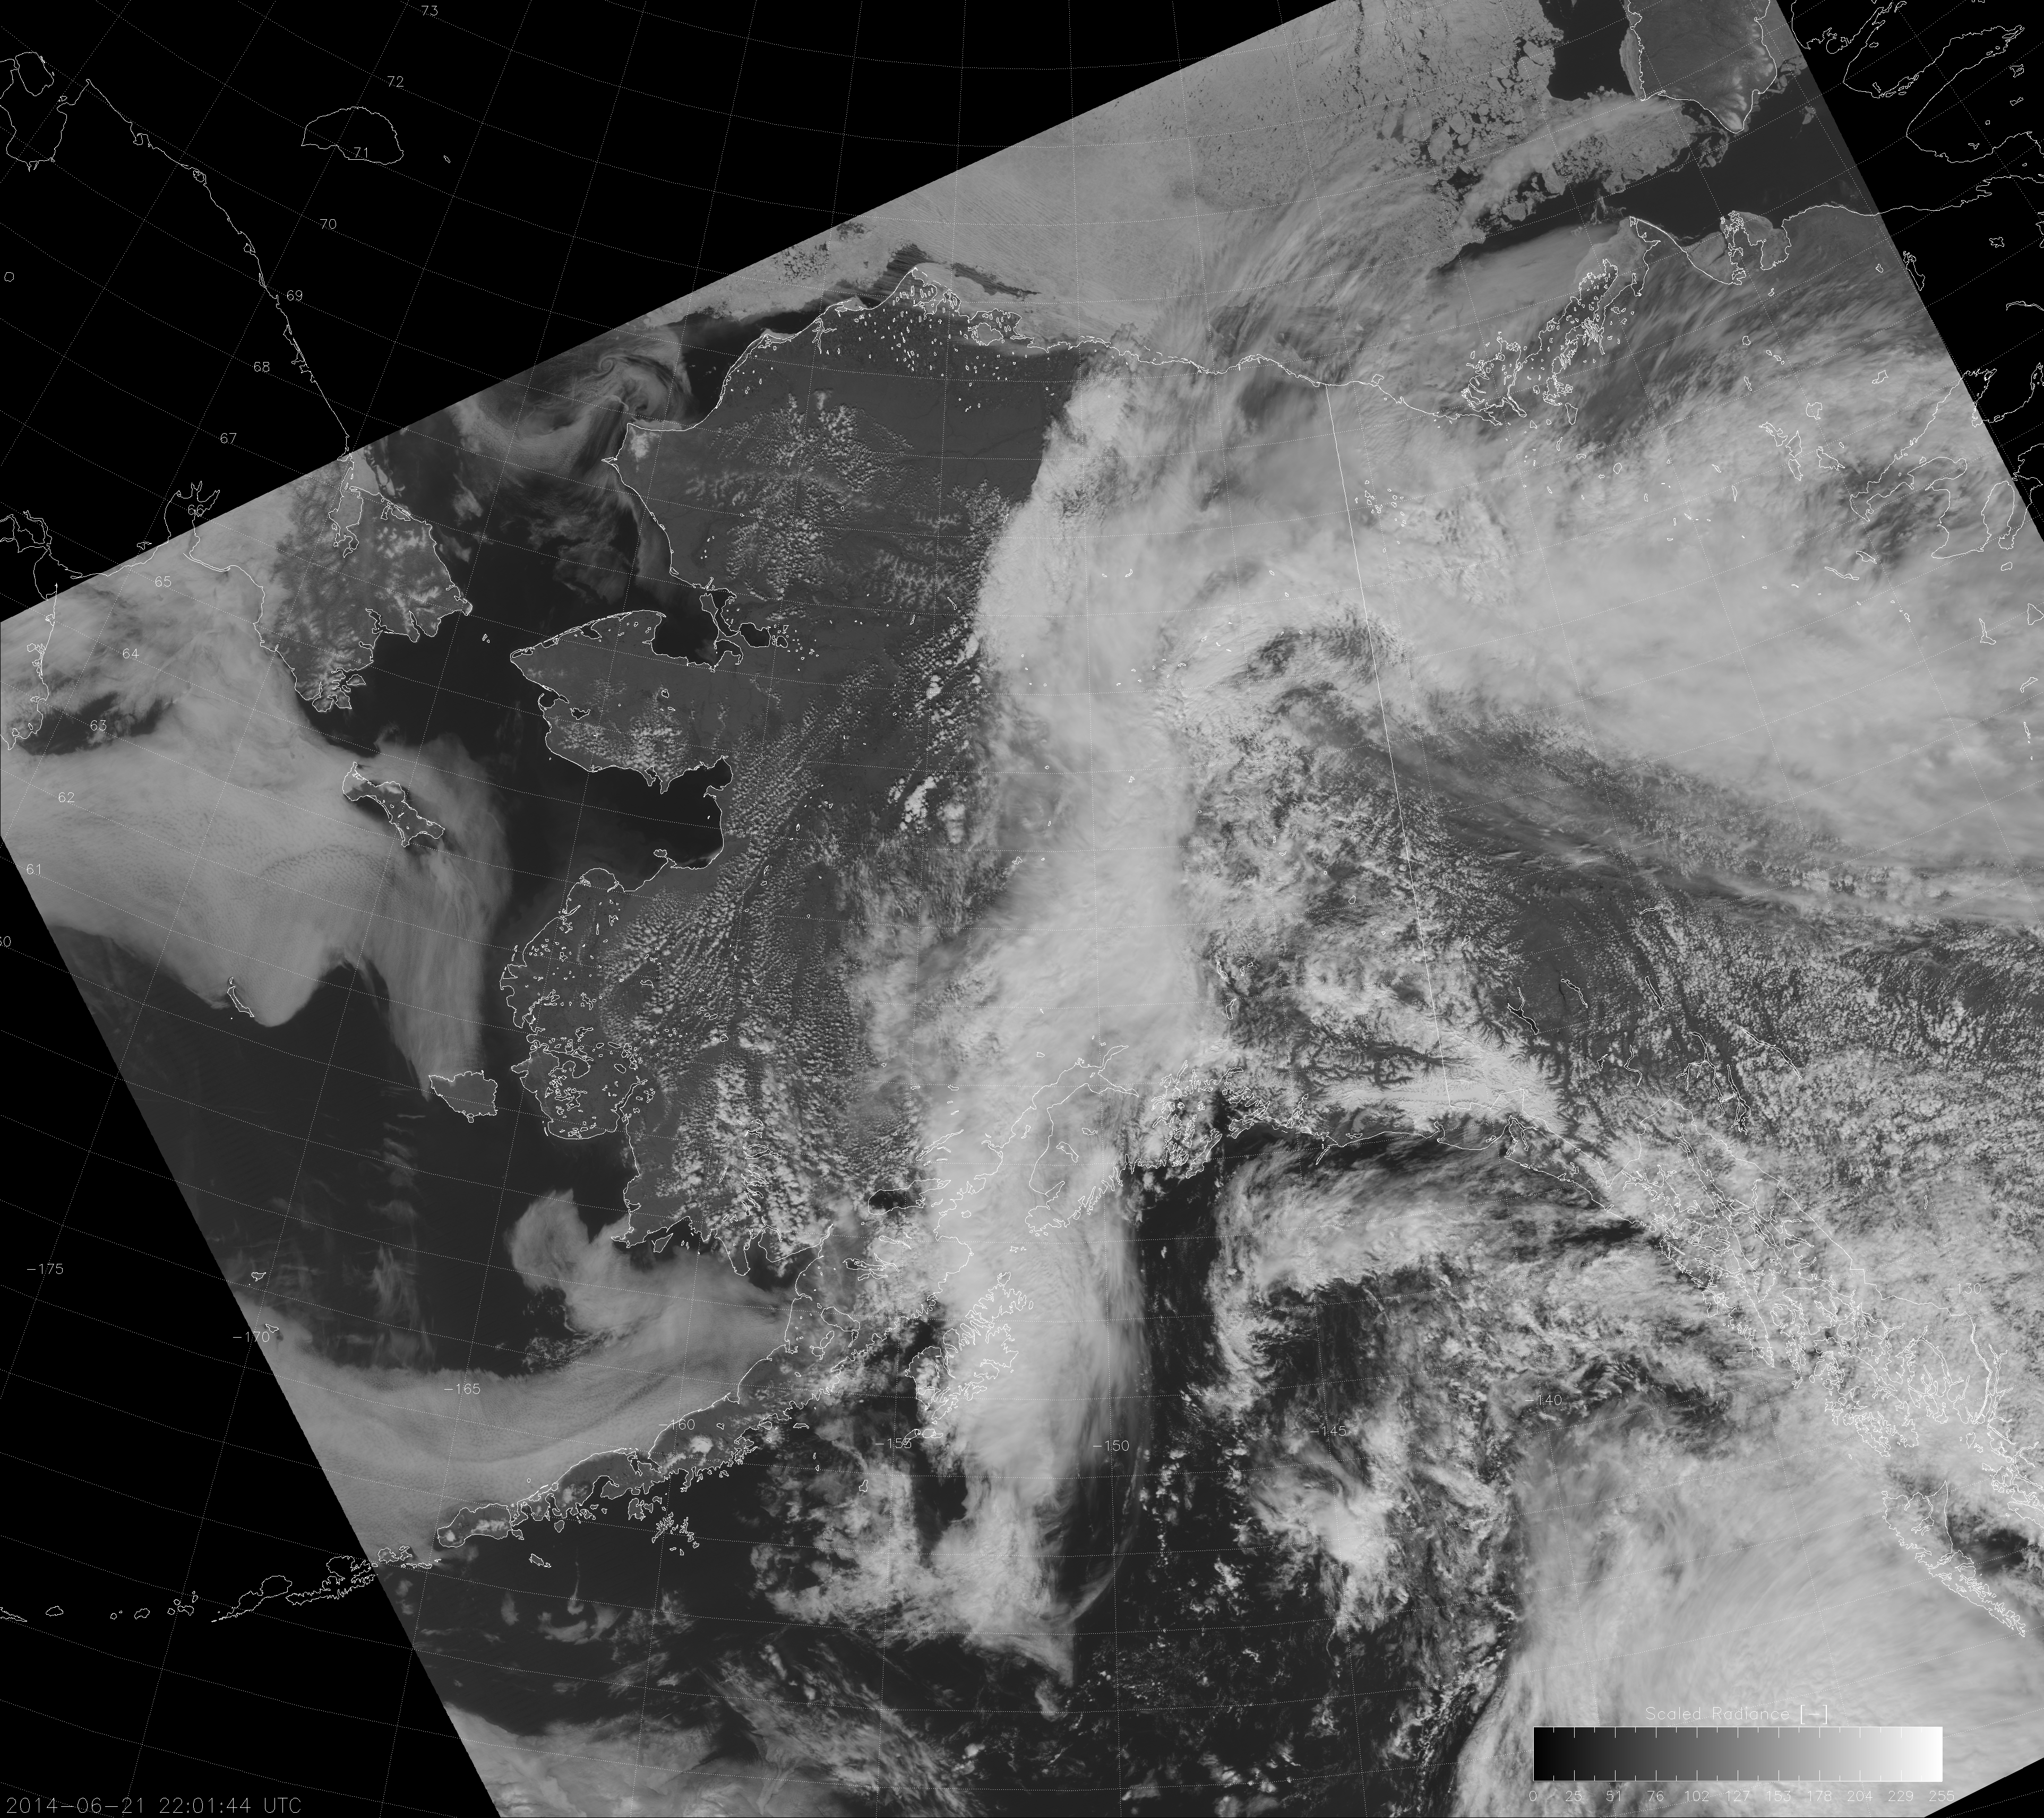
How about this idea: instead of finding the median value of the whole domain, break up the domain into small zones according to solar zenith angle, and then apply the same “median-based” linear scaling? Here’s what you get if you break up the image into solar zenith angle bins of 0.01 degrees:
Not bad. You get a lot of contrast throughout the image (particularly on the “night” side), but it still has stripes in it. This is due to the fact that the presence or absence of clouds (or city lights or whatever) is constantly changing the distribution of radiances within each solar zenith angle bin. The stripes get larger if you use larger bins. Smaller bins means a smaller sample size and, therefore, “less stable” median values. What we need is more of an absolute scale rather than a relative scale.
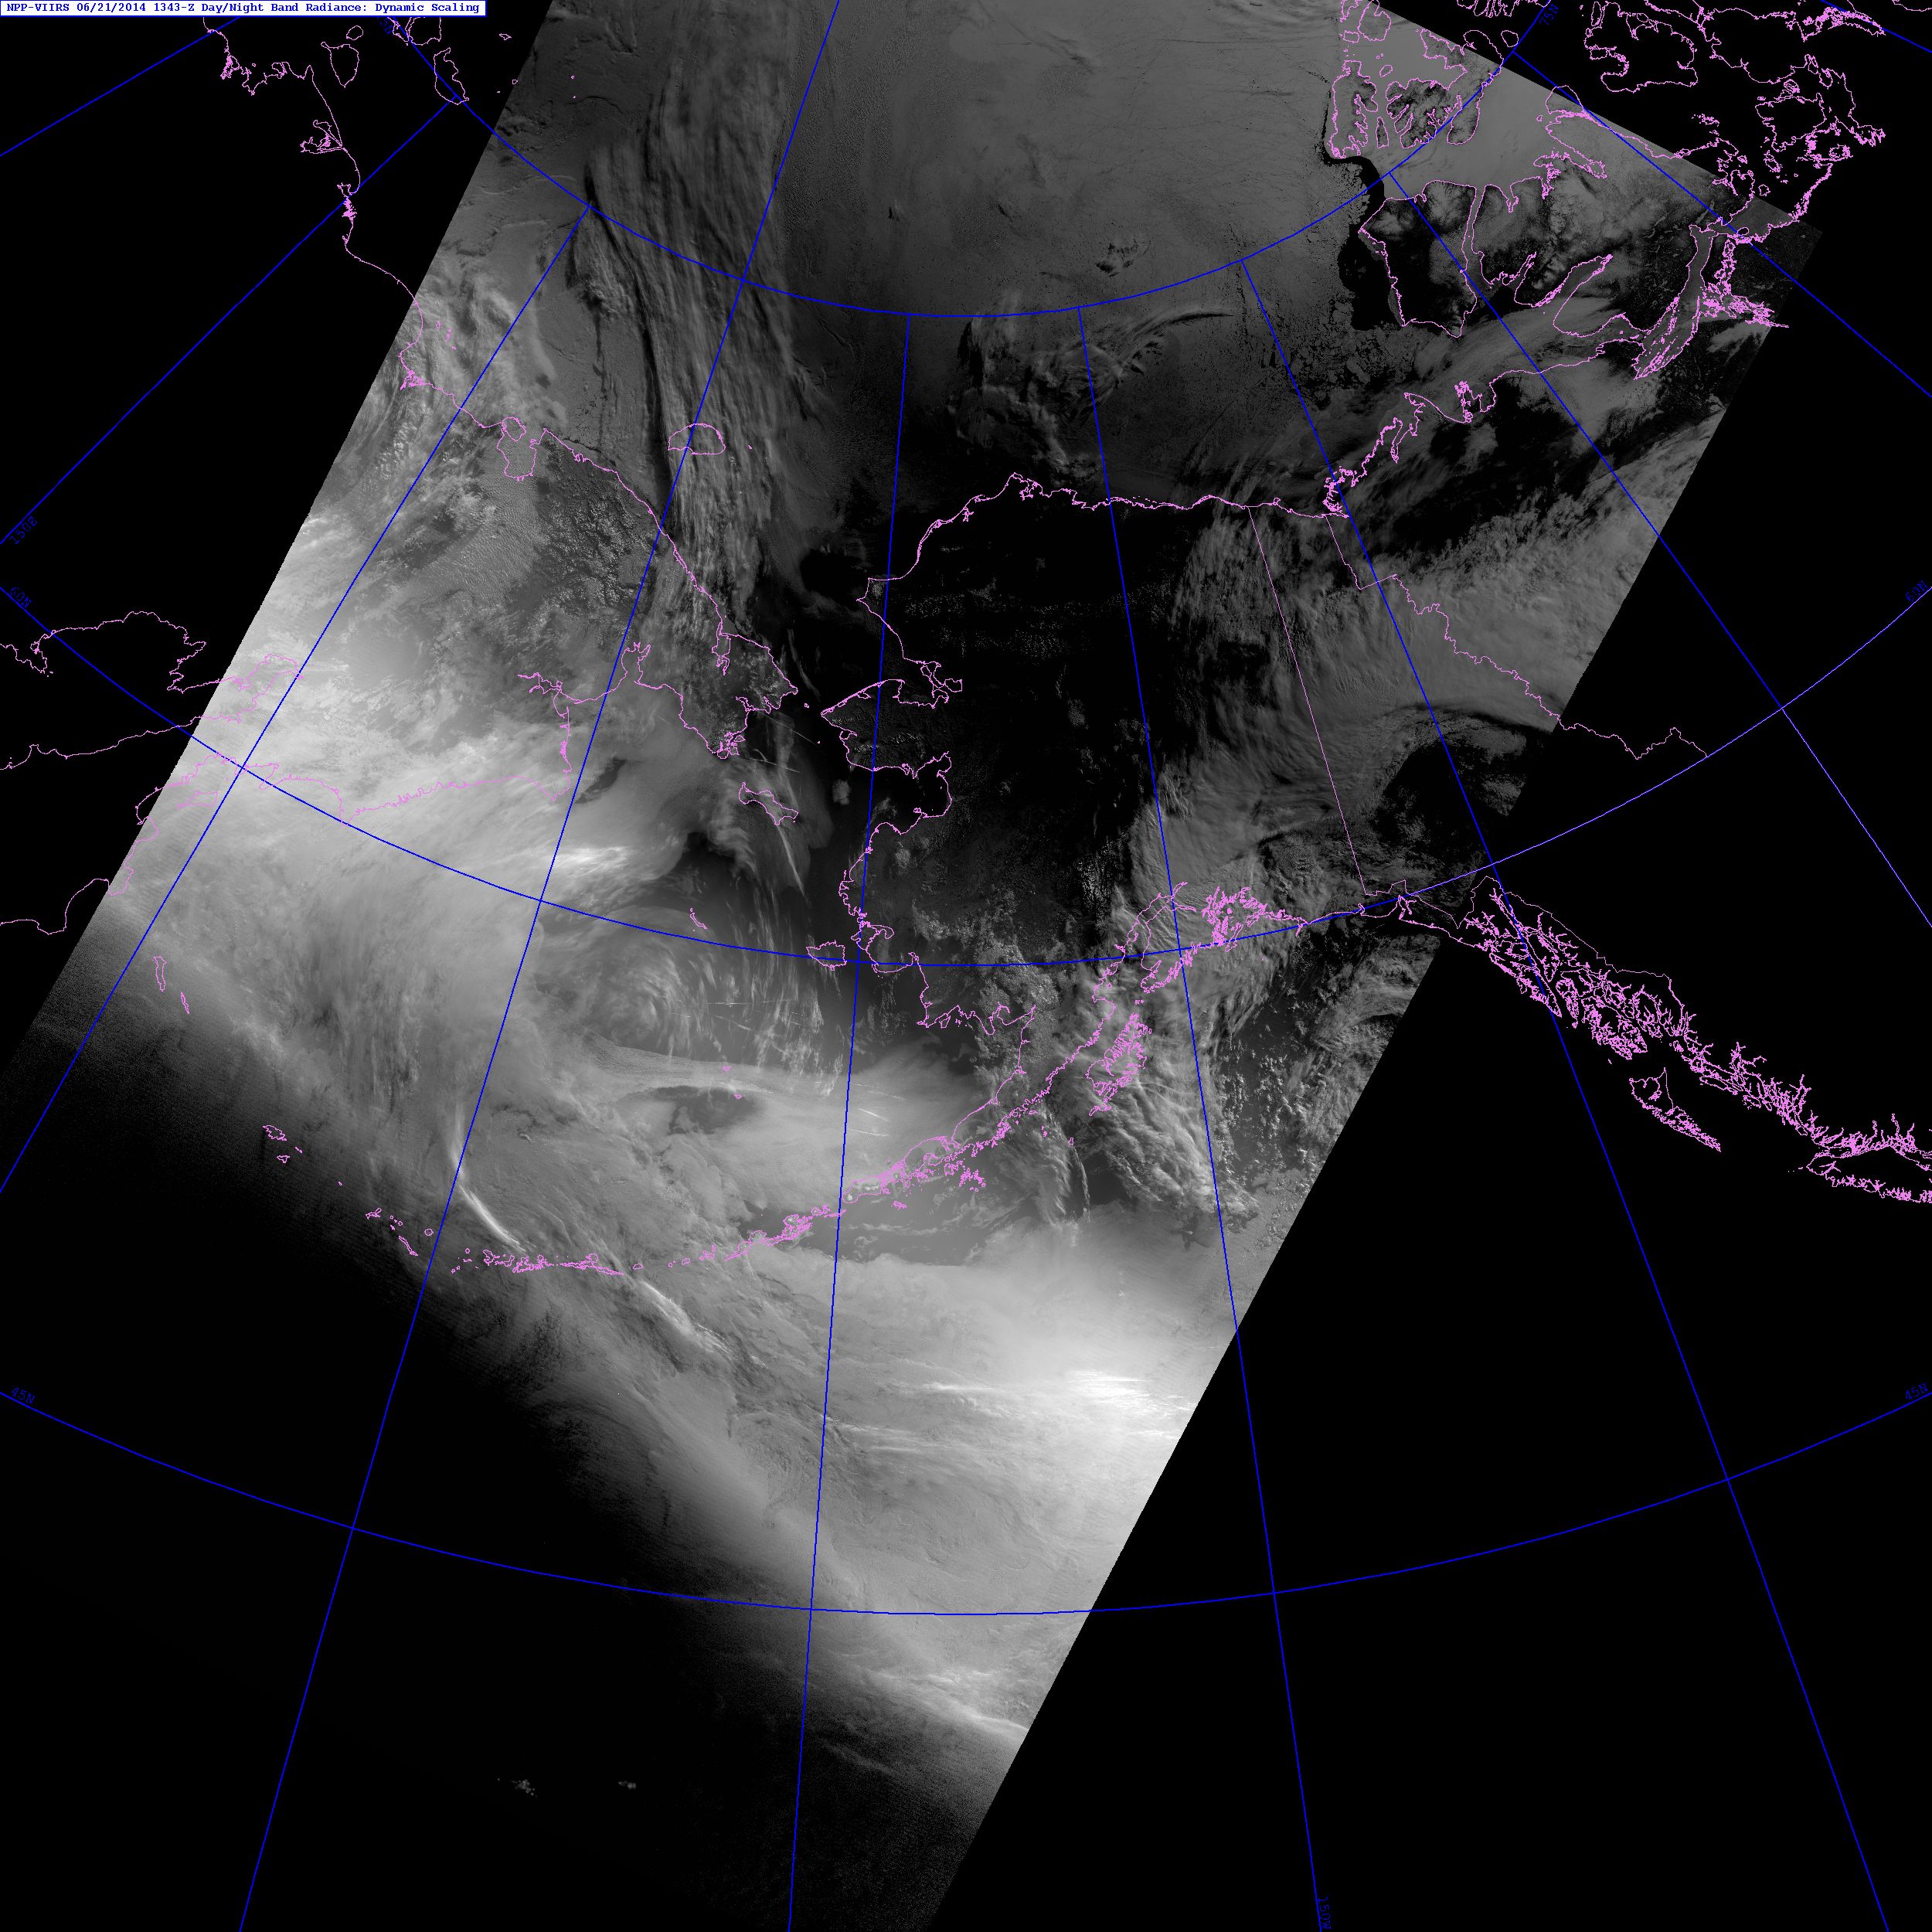
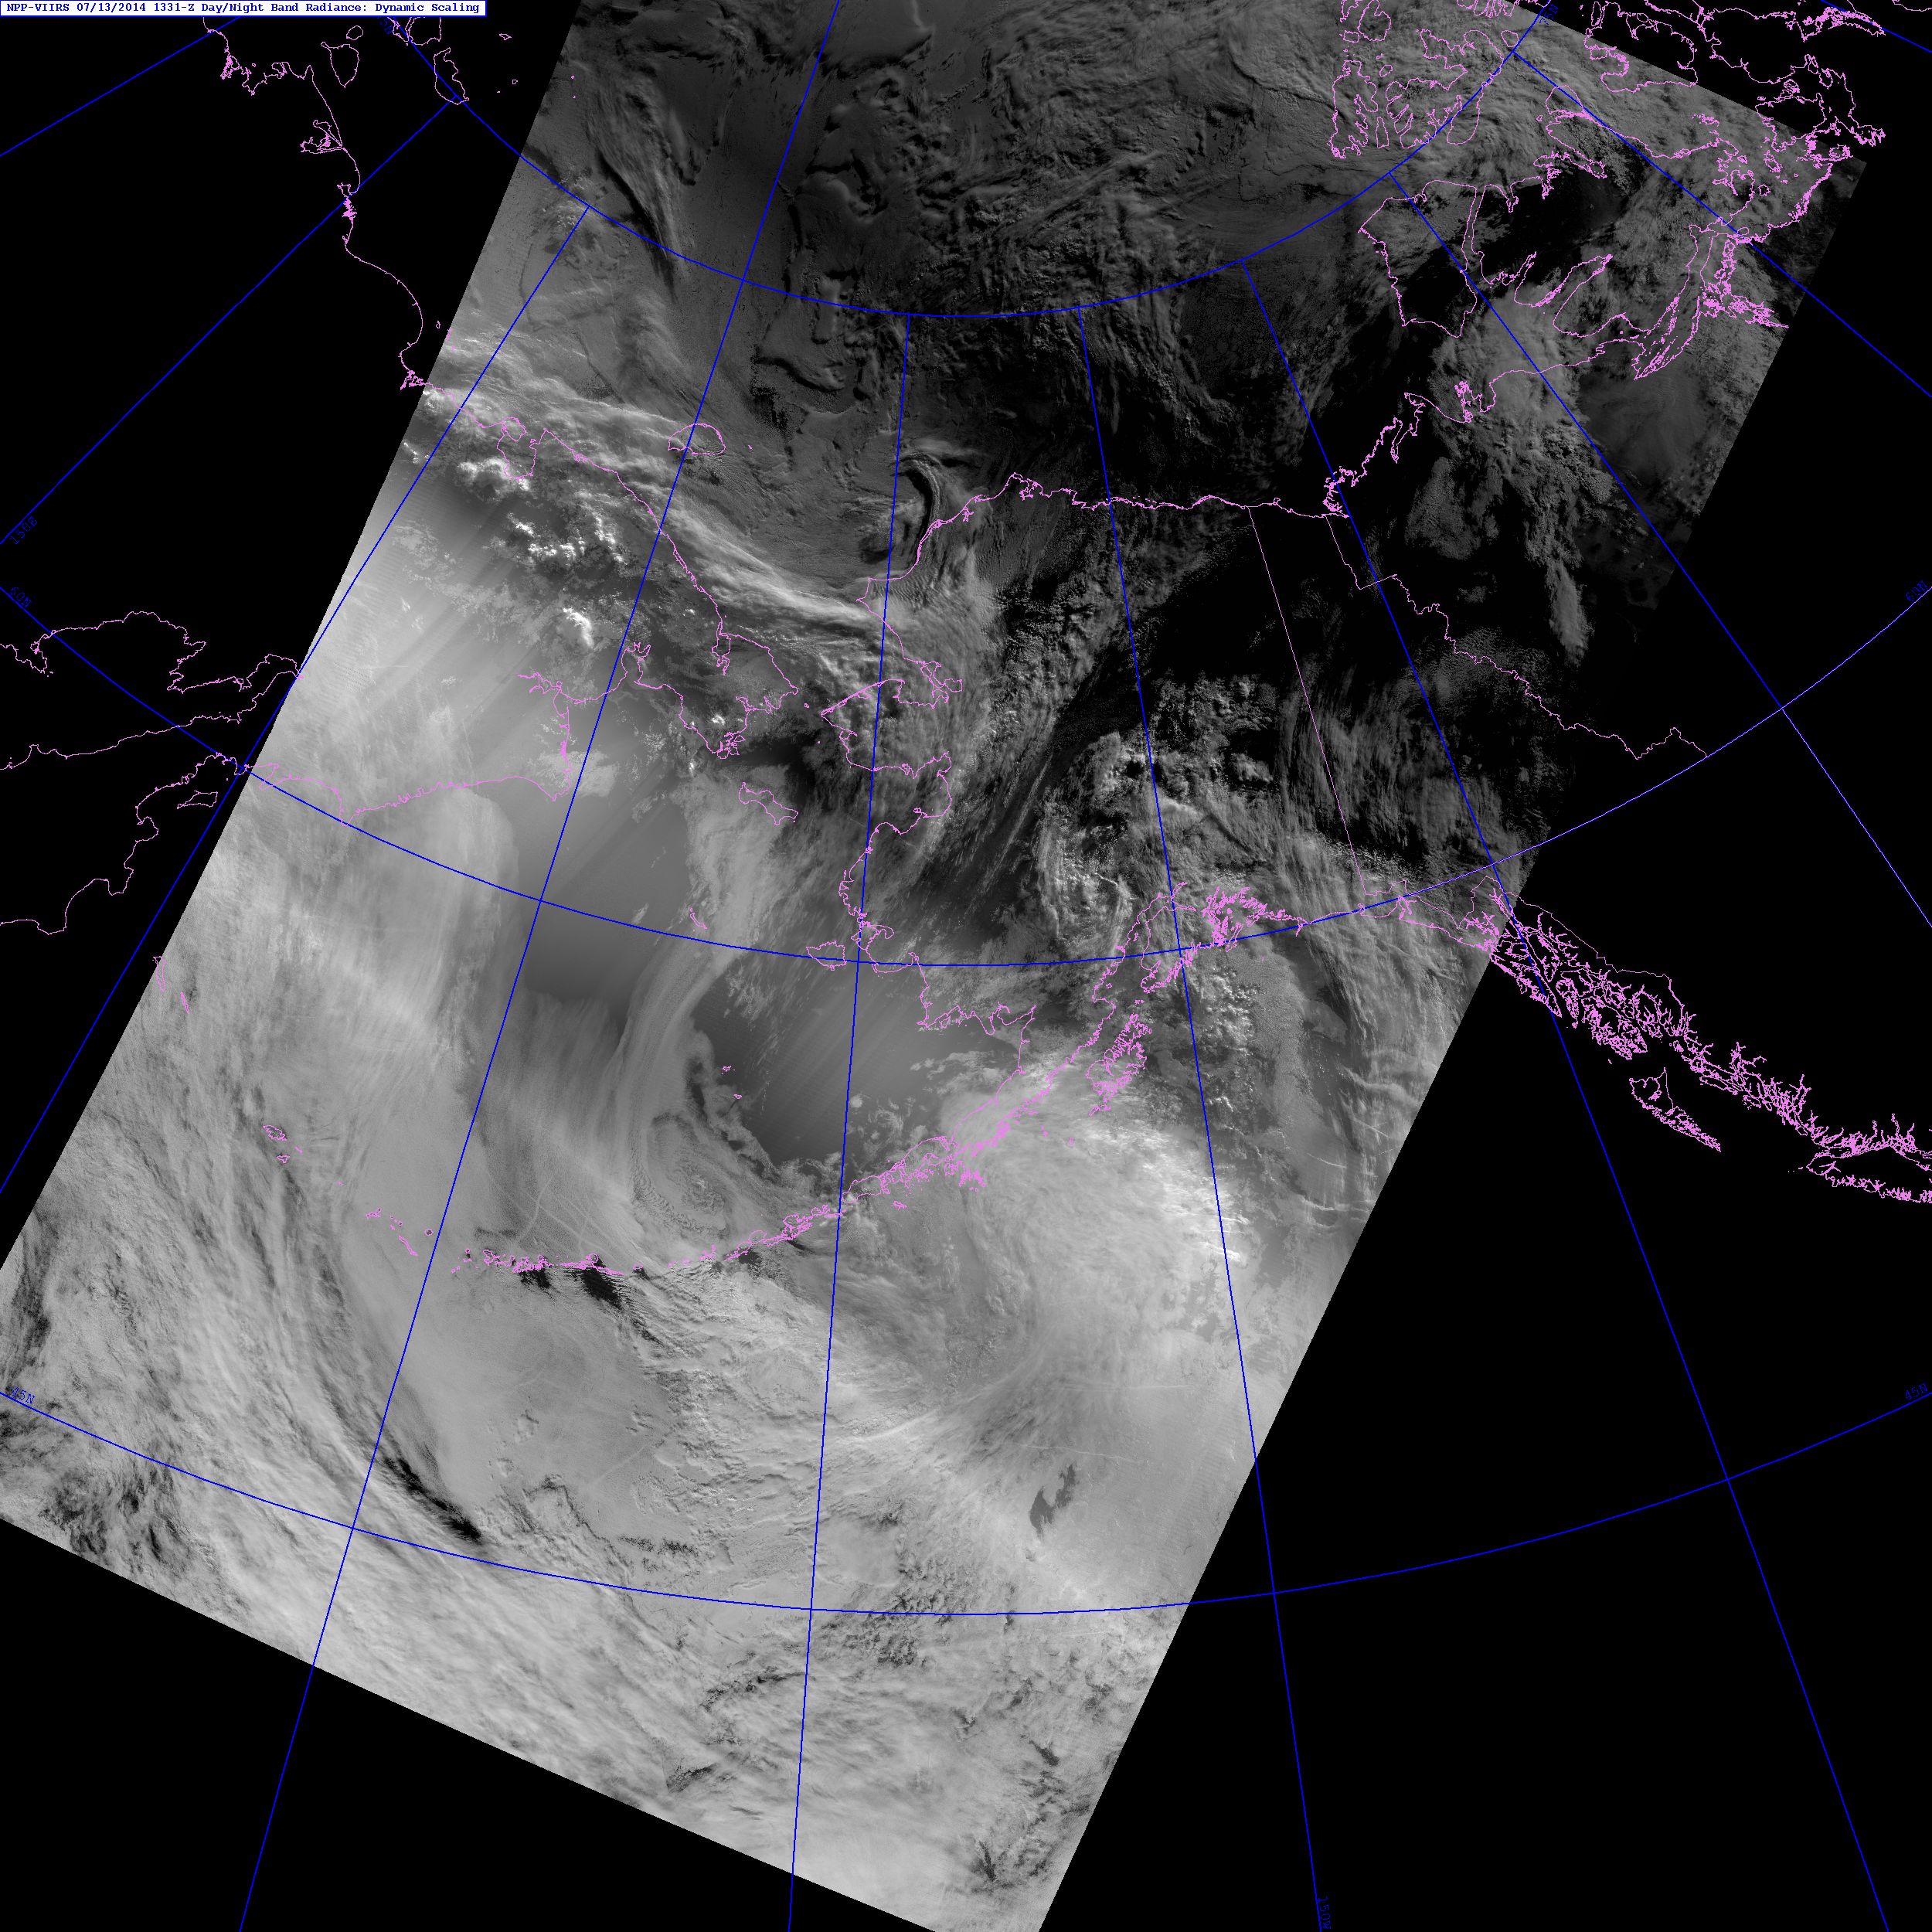
At this point, it occurred to me that Steve Miller at CIRA (my boss, but that doesn’t mean I’m brown-nosing) already came up with a solution. He developed a “dynamic scaling” method where max and min are based solely on the solar and lunar zenith angles.
As you can see, the dynamic scaling produces good contrast on both sides of the terminator, which is what users are typically looking for. It’s important to be able to identify clouds and surface features (like icebergs, for example) throughout the entire image – not just on one side or the other or just in the middle.
In my bungled attempt to apply his dynamic scaling within my software, I had another epiphany. If you plot the radiance values (on a log-scale) as a function of solar zenith angle across the terminator, you get something that looks like this:
Doesn’t that look a lot like the error function turned sideways? This became the basis for a new form of “dynamic scaling”: find the error function that fits the maximum and minimum expected values of the data as a function of solar and lunar zenith angles. In fact, those are the curves plotted on the graph. Steve Miller’s dynamic scaling is simply a piecewise linear approximation to my error function curves. (Or, more correctly, you could say my error function curves are a continuous approximation of his piecewise functions.)
A similar error-function-like distribution of radiance values occurs across the moon/no-moon terminator, except the range is only 2-3 orders of magnitude instead of 6-7. We simply multiply the lunar zenith angle-fitted error function and the solar zenith angle-fitted error function on the “night” side to account for the variation in radiance from full moon to new moon. When you do that (and apply a square-root correction), you get this image from a night with a full moon:
And this image from a few nights after last quarter moon:
These compare pretty well with the Near Constant Contrast imagery from the same times:
Here’s what the piecewise linear dynamic scaling gives you:
And, if you’re curious, the “erf-dynamic scaling” works just as well during the day as it does at the terminator. Here is an example of the DNB with this scaling, followed by the associated NCC image:
Of course, the exact form of the error functions could be tweaked here or there to provide a better fit to the natural variability of the observed radiances. But, after one lunar cycle of testing, the results look promising. It is possible to scale the Day/Night Band across the terminator to provide useful information for “day” and “night” (and even across the scary twilight zone)!
UPDATE (27 January 2015): The “erf-dynamic scaling” algorithm has been implemented in CSPP. So users of that software product should be on the look-out for the latest version. (It was added in October or November 2014. I don’t know the actual date.) Thanks to the folks at CIMSS who develop CSPP for quickly adding this! We look forward to collaborating more with the CSPP developers on future products. Also, you can read about a correction to the “erf-dynamic scaling” algorithm here.
Thanks for posting this helpful update. The erf-dynamic scaling looks to be a serious step forward and should make the DNB imagery much more user-friendly. Here at GINA we turn the VIIRS data into products via the CSPP code. Do you know if there are any plans to incorporate erf-dynamic scaling into CSPP?
“Erf-dynamic scaling” is something I just came up with, independent of the CSPP group. We at CIRA are currently working on transitioning some of our imagery products and code onto servers at GINA – and this would include the “erf-dynamic scaling” for the DNB. Hopefully, it will be up and running soon.