If you found this webpage, you are either A) a spam-bot searching for new websites to inundate with spam messages, B) interested in learning about VIIRS and it’s revolutionary Day/Night Band or C) very upset at Google right now for steering you to the wrong place. This website is for those of you in group B, but hopefully a few of you in group C will stick around and become interested to learn about the kinds of things you can do with weather satellites – particularly with a sensor as powerful as the VIIRS Day/Night Band.
First, a little background on VIIRS. Actually, just read this “Beginner’s Guide” (PDF file) that I wrote if you need background. (Hey, I wrote it. I might as well promote it.) It’s designed for people who are interested in using the data but, even if you don’t deal with VIIRS data directly, that PDF has a lot of good information in it you may find useful. Our topic today is basically an expansion on pages 23 and 24 of that document.
Typically, imaging sensors on weather satellites operate in the visible and infrared portion of the electromagnetic spectrum. This is the case with VIIRS, which has 22 channels (also called “bands”) ranging in wavelength from 0.412 µm to 12.01 µm. Perhaps the most revolutionary channel on VIIRS is the Day/Night Band (or DNB). The DNB is a broadband channel sensitive to radiation in the wavelength range from about 0.5 – 0.9 µm, which covers much of the visible and into the near-infrared (near-IR) wavelengths.
What makes the Day/Night Band unique is its ability to detect the low levels of visible light that occur at night. Most visible-wavelength sensors don’t work at night because the signal is well below the noise of the instrument. (Only the DMSP OLS was able to capture visible imagery at night prior to the launch of VIIRS and the DNB has the OLS beat in spatial resolution, radiometric resolution and quantitative applications.)
The DNB observes band-integrated radiance values at ~750 m spatial resolution over a ~3000 km-wide swath that covers the entire Earth twice a day. Since it is on a polar-orbiting satellite, Suomi NPP, it observes high latitude areas (like the Arctic) every orbit (every 101 minutes). The data produced by the DNB is very useful for Arctic applications (as we will show in future topics), but it can be difficult to work with.
The radiance values observed at night are roughly 7-8 orders of magnitude less than during the day, and they vary by several orders of magnitude between a new moon and a full moon. (Here’s a quick and dirty resource for information on the moon’s phase.) This large contrast between day and night creates a lot of problems when trying to display images near the day/night terminator since a lot of computer displays only allow 256 colors. For high-latitude places like Alaska, the terminator is present all night long in the summer months.
Here is a scene containing five VIIRS DNB granules over Alaska near 12:50 UTC on 13 August 2013. This image was created by linearly scaling the radiance values (which range from 1.4×10⁻³ to 7.3×10⁻¹⁰ W cm-2 sr-1) as a number from 0 to 255:
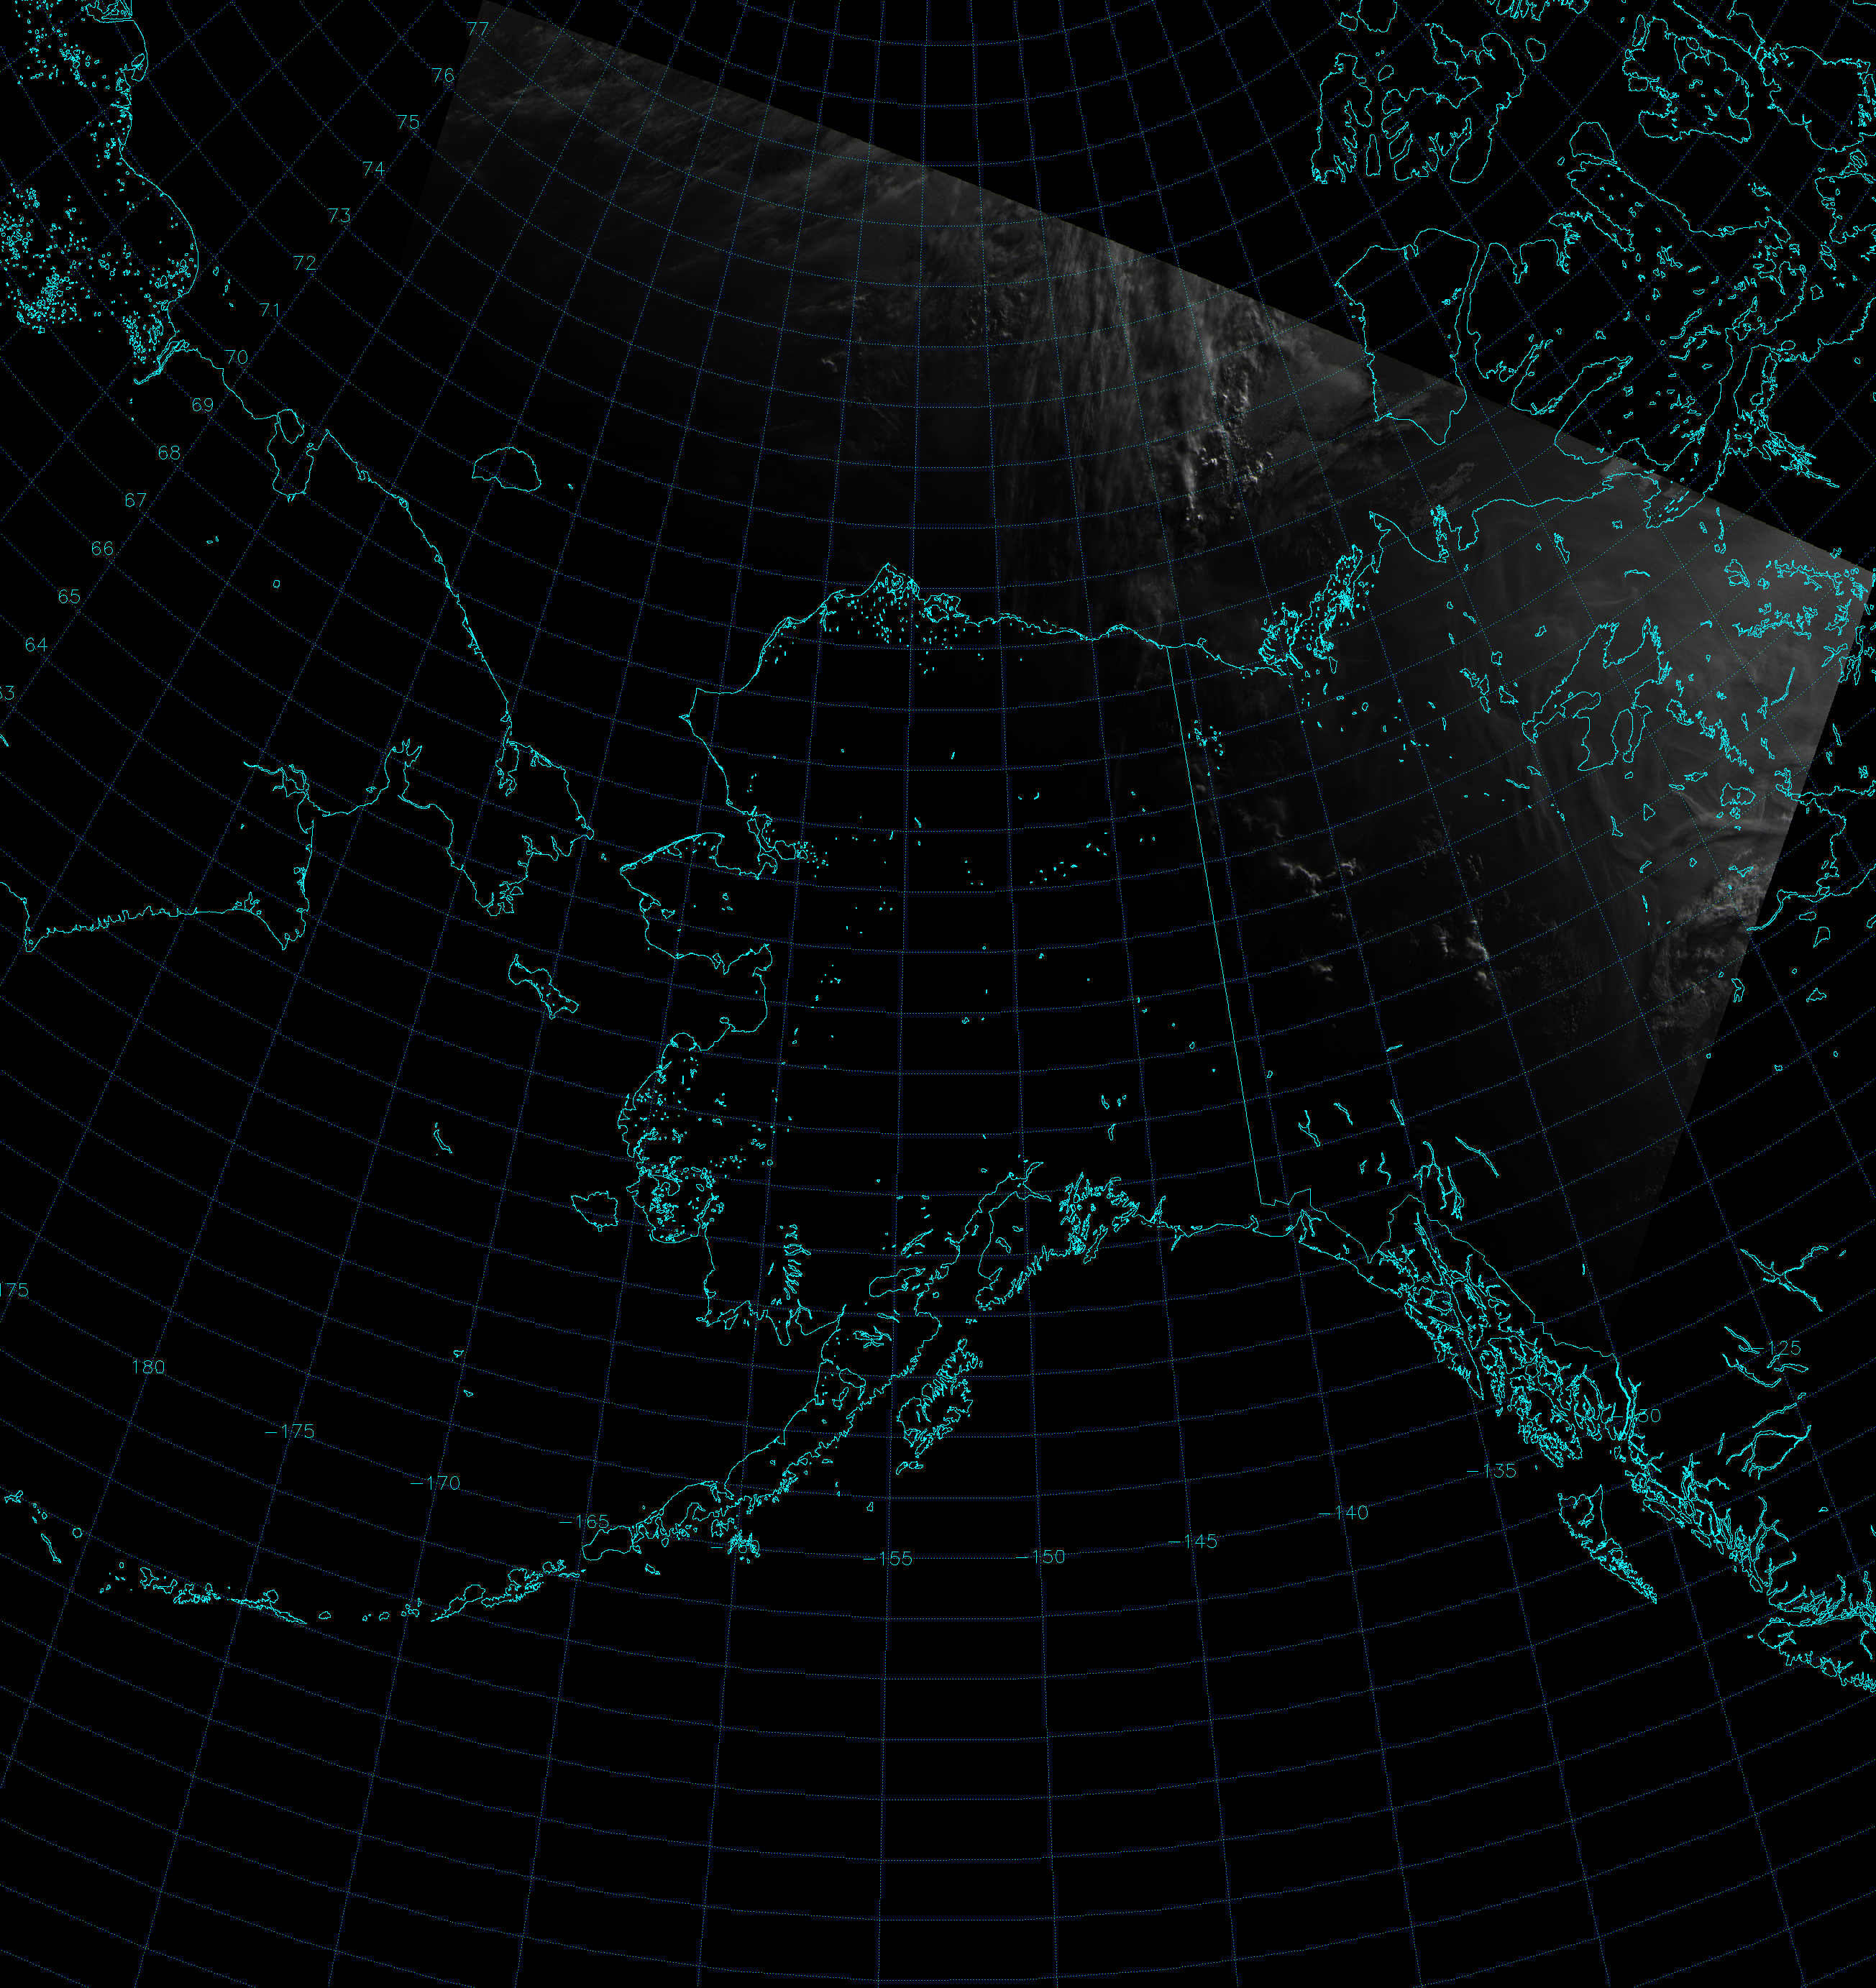
The top edge of the image is on the day side of the Earth, while the bottom is on the night side. The linear scaling only shows detail on the day side, even though the DNB can detect what’s on the night side.
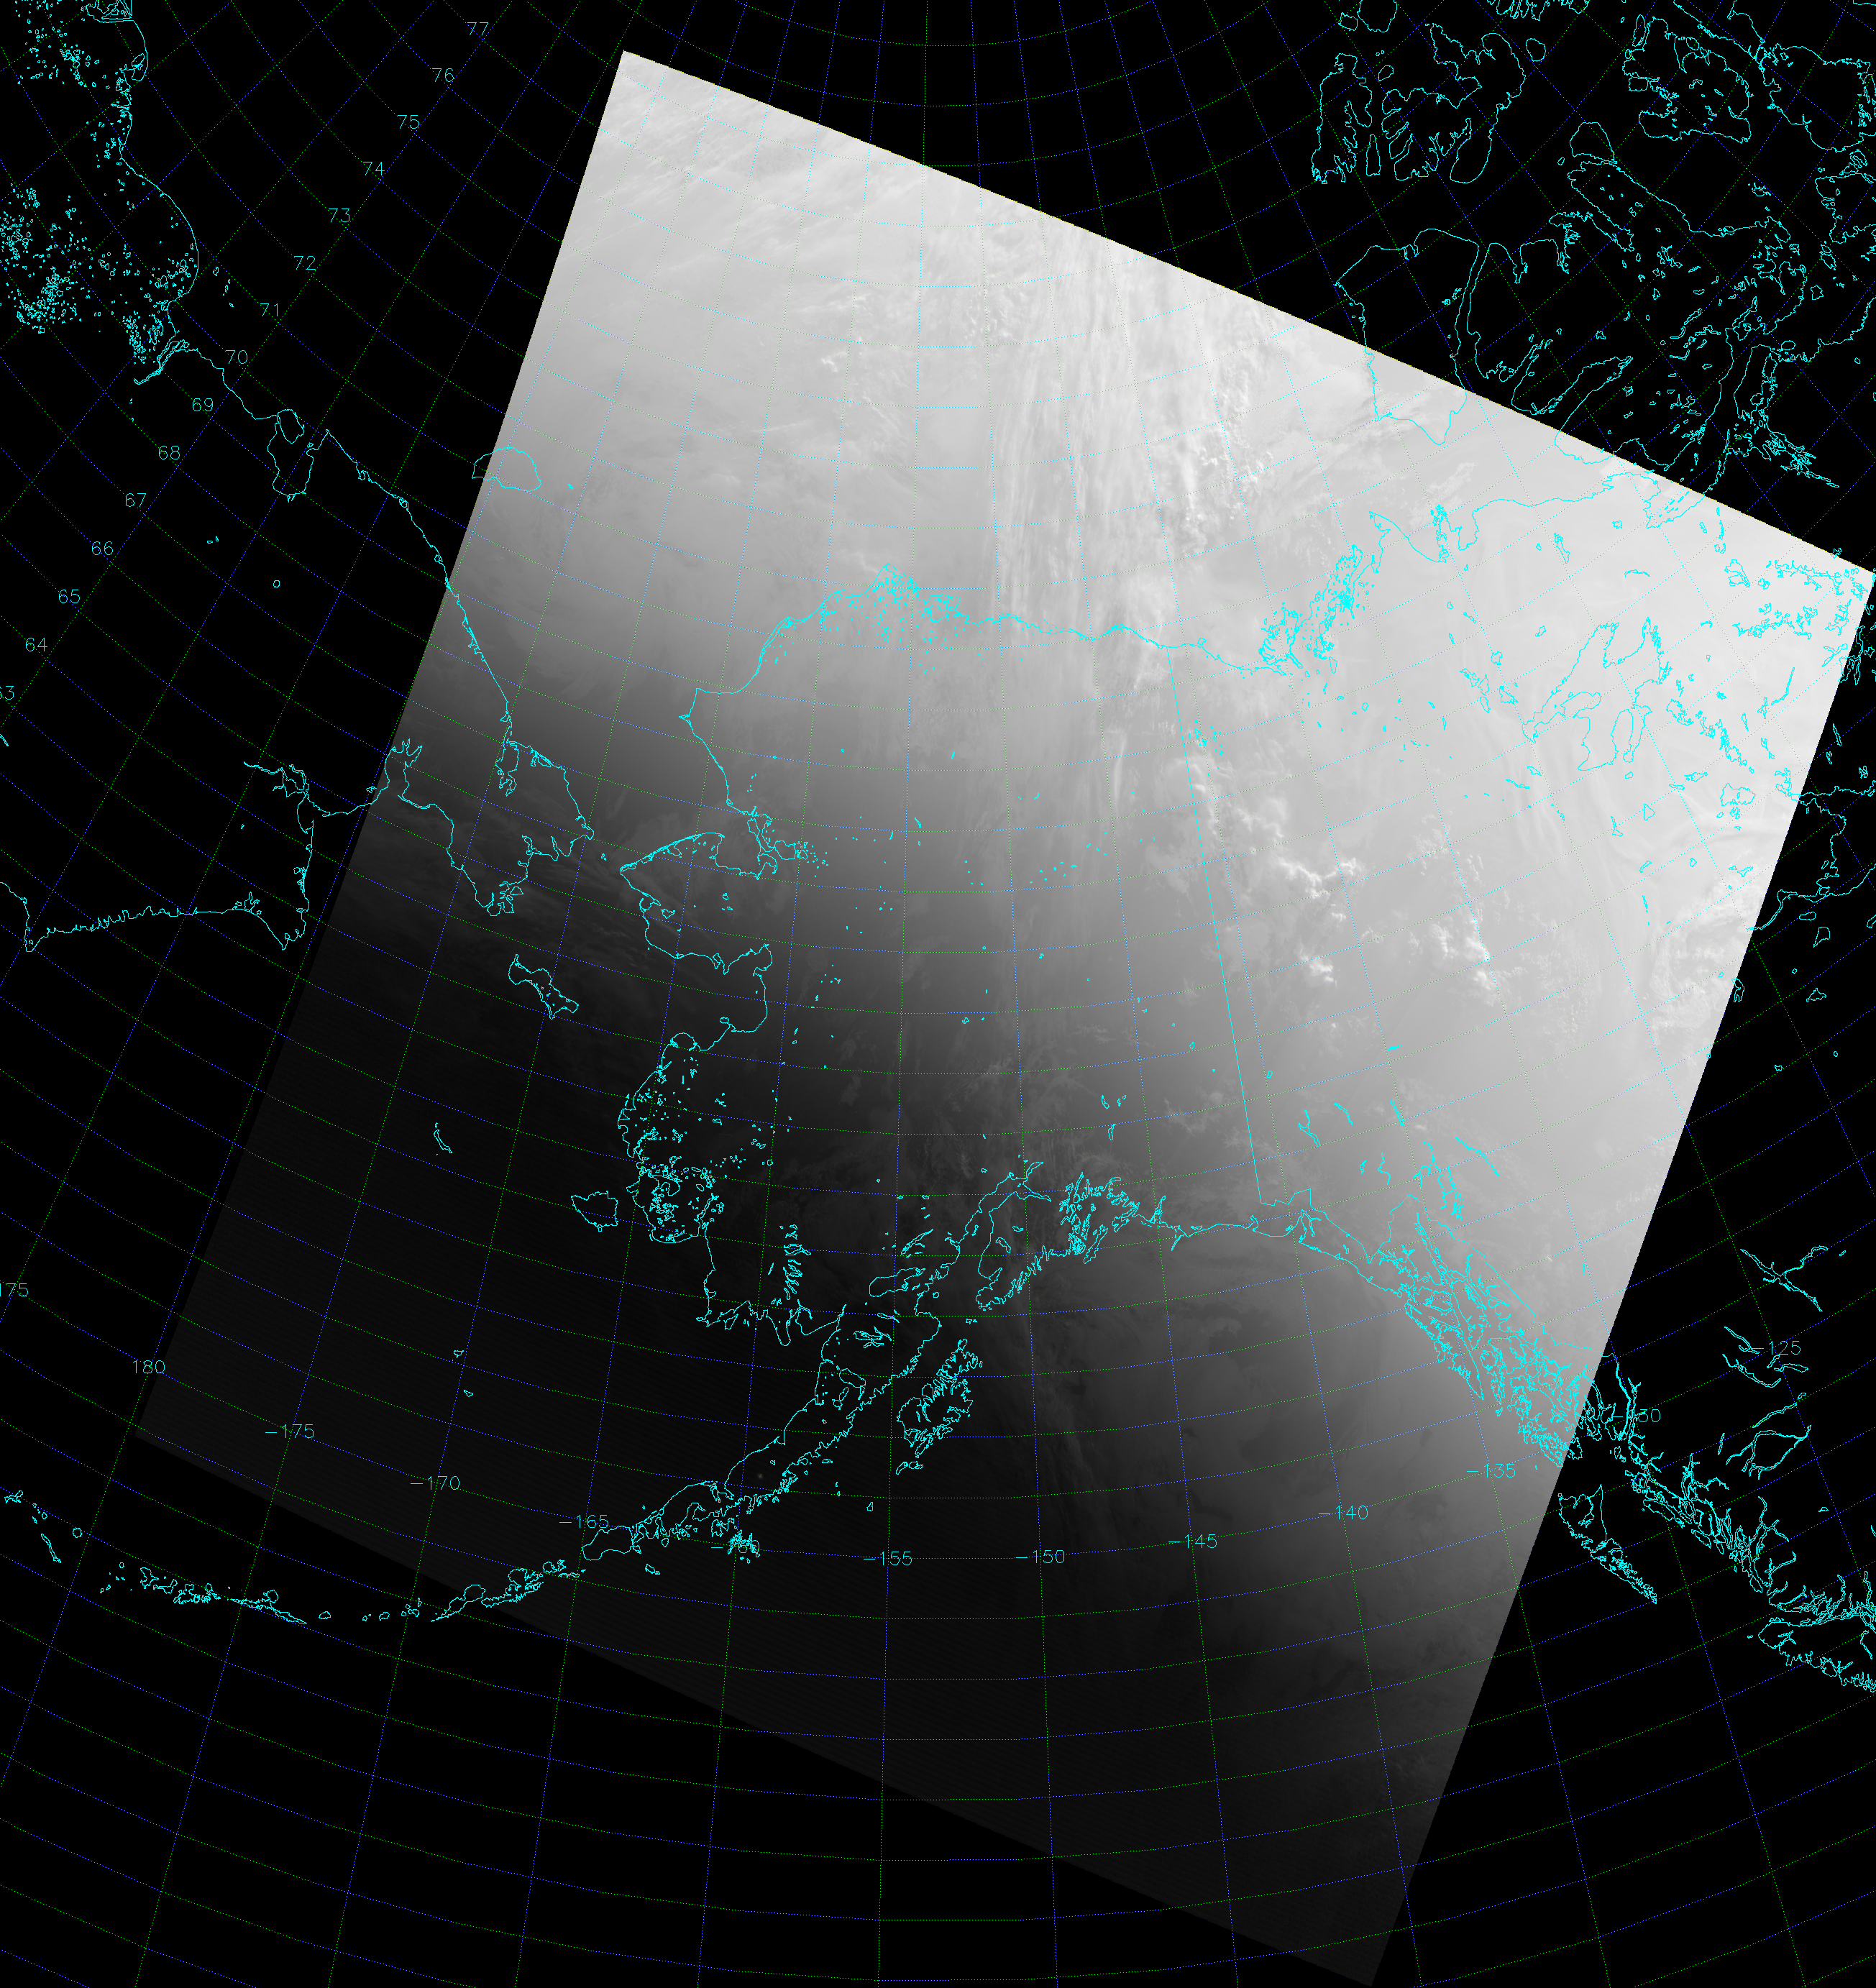
Taking the base-10 logarithm of the radiance values (now dealing with a scale from -2.3 to -9.1) brings out the detail in the twilight areas, but causes saturation on the day side of the image and the night side still looks dark:
By the way, if you follow my other blog, you might be surprised to find out you only need to click on these images once to get to the full resolution version. I should probably mention that these images show the full width of the VIIRS swath, but have been reduced in resolution by a factor of two.
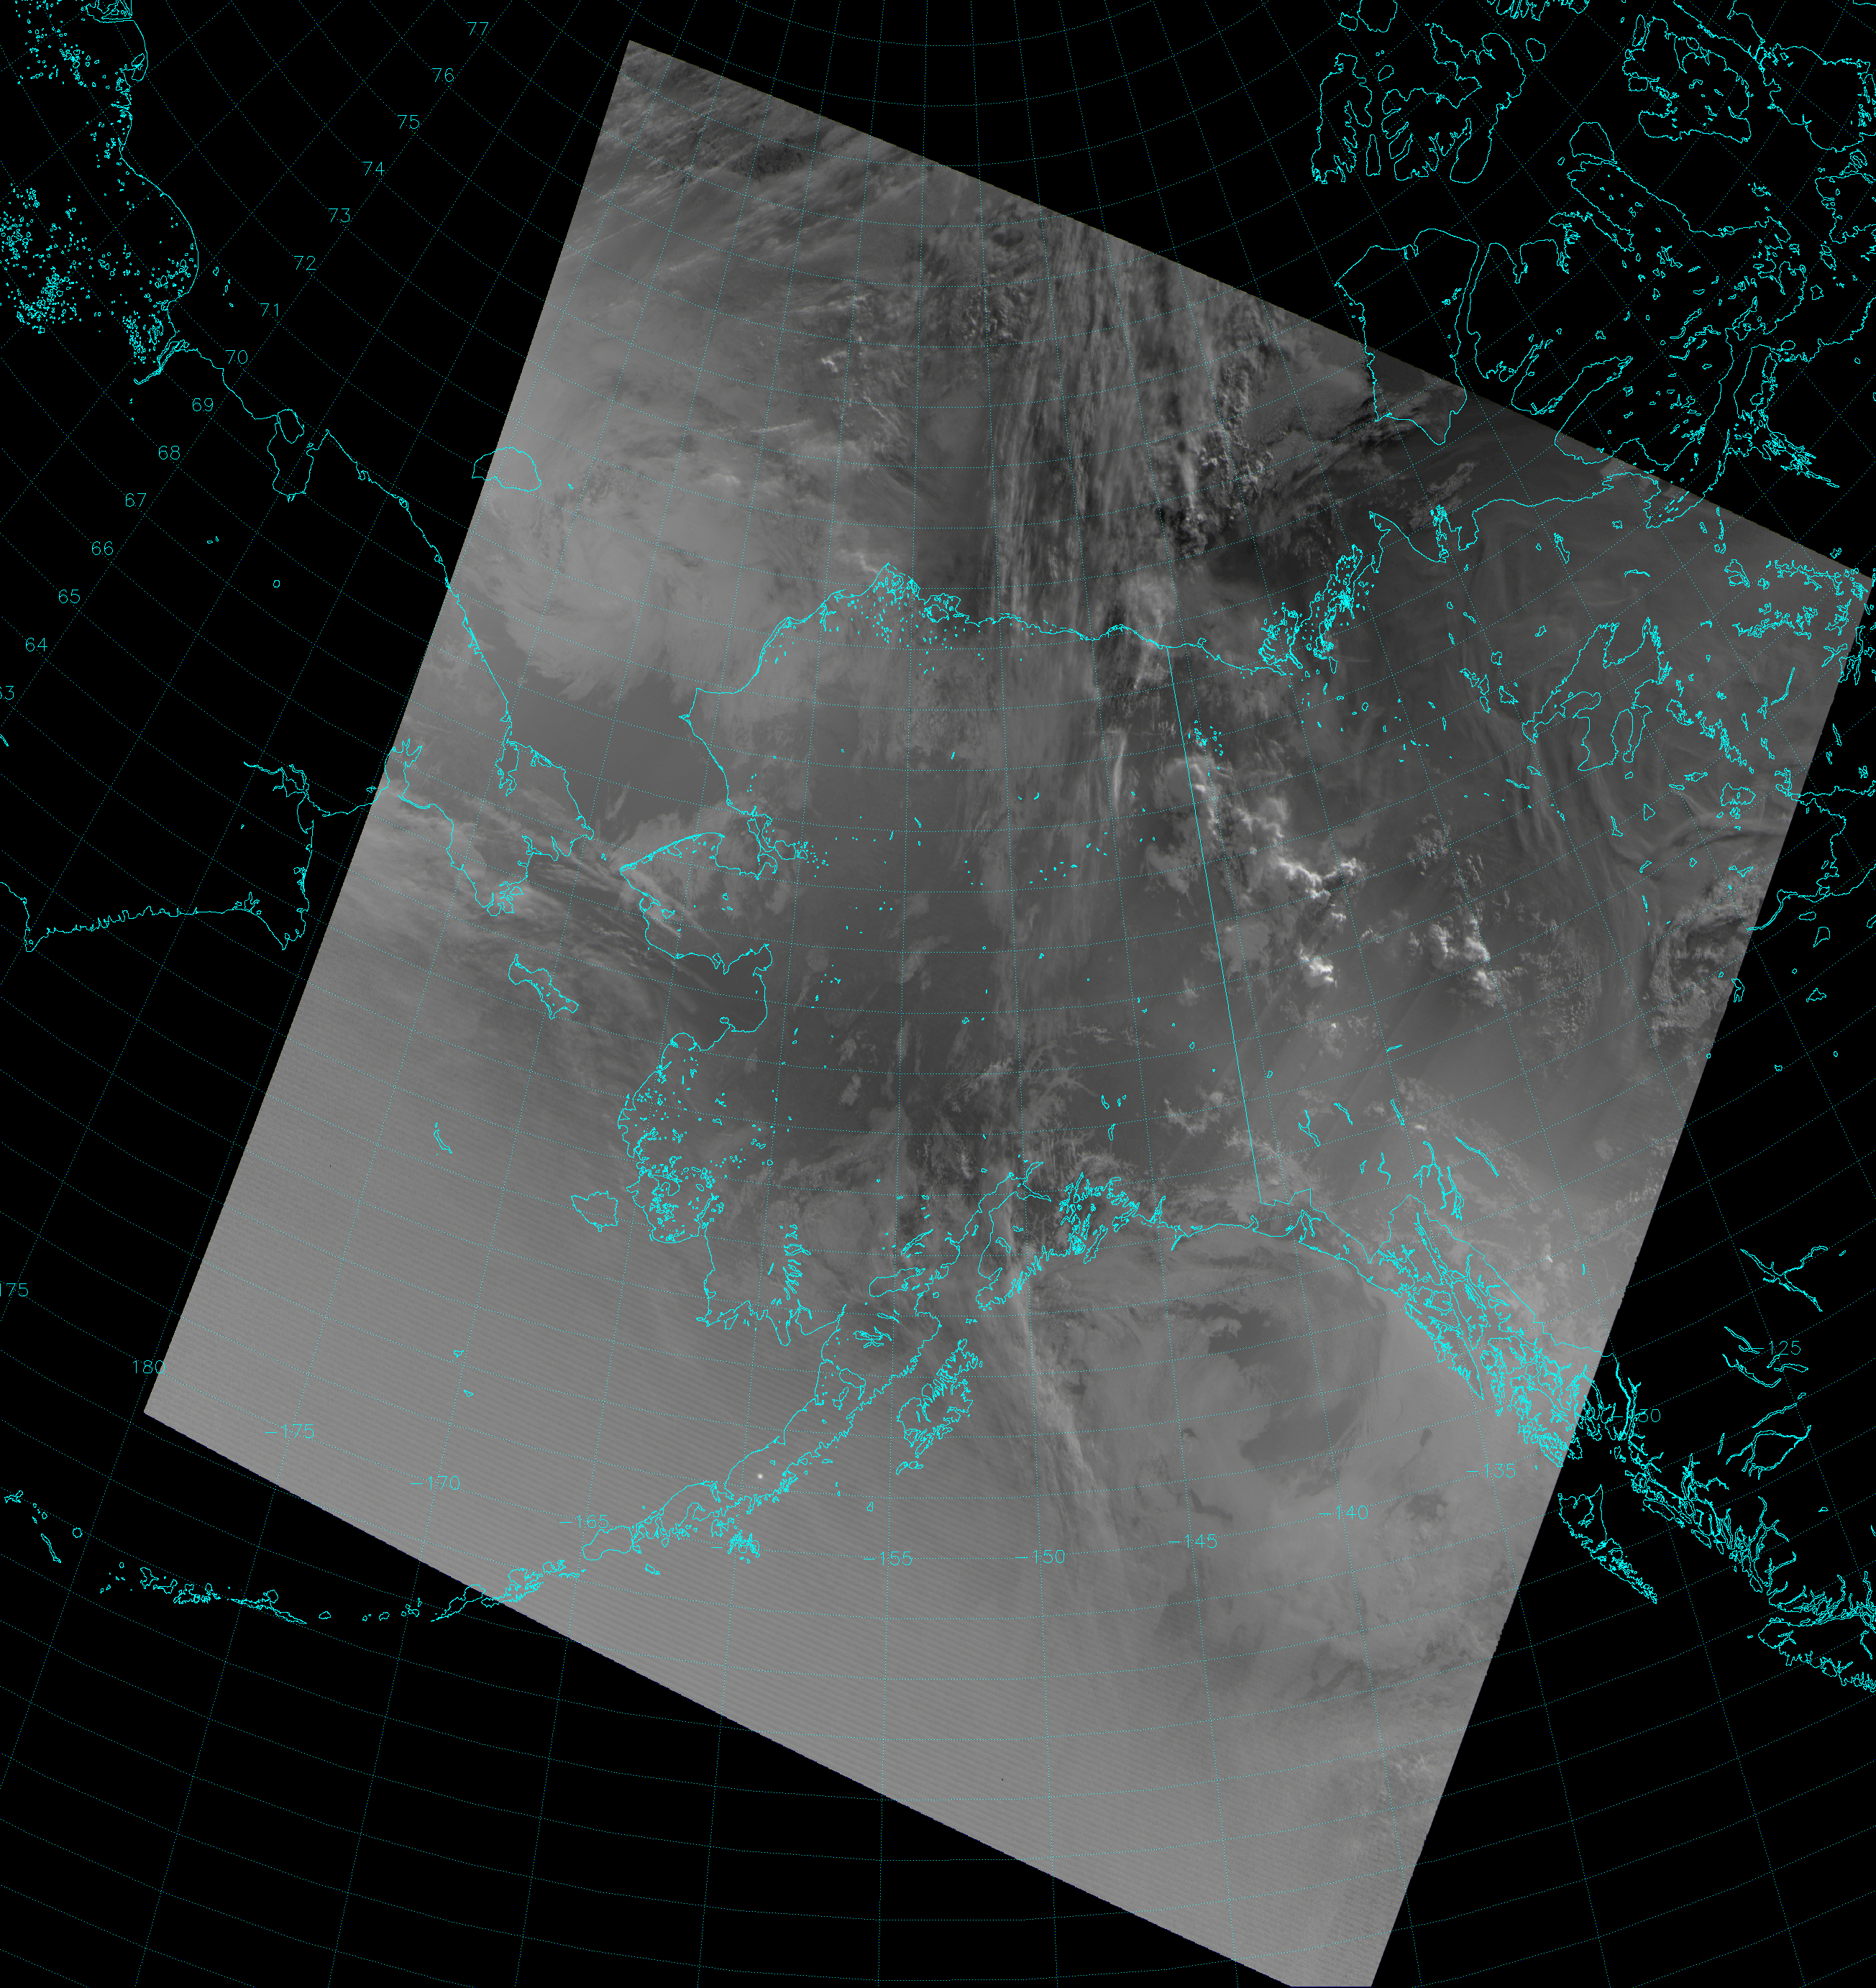
Here is a more sophisticated attempt at scaling, which uses information about the solar zenith angle to divide the region into strips, and each strip has it’s own scaling designed to be continuous from strip to strip:
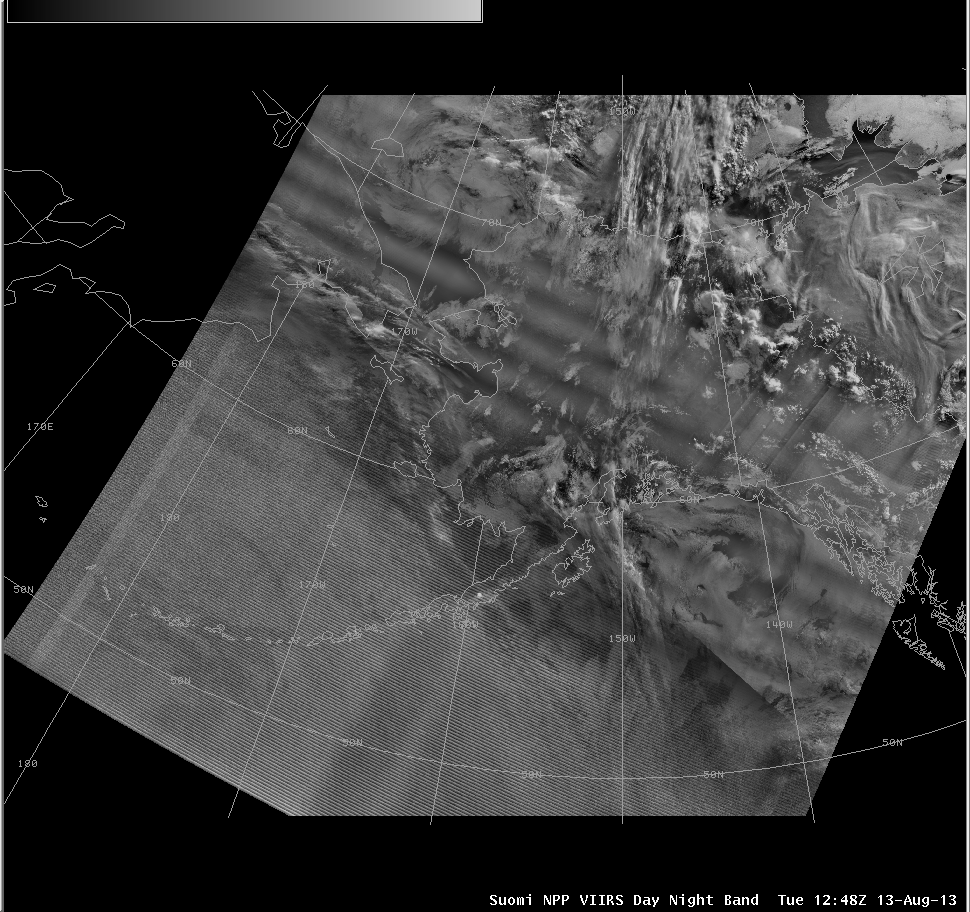
This scaling allows you to see features on the day side, night side, and everywhere in between. But, see all the wave-like, broad ripples in the middle of the image? Those aren’t actually in the data – it’s a consequence of using this scaling method. The shorter wavelength ripples near the bottom of the image are caused by “striping” and “stray light”.
Striping occurs because the 16 detectors that make up the DNB may not all have the exact same sensitivity to light. In each scan (16 rows of pixels in the full resolution data), some rows of pixels appear brighter, because that particular detector is more sensitive to light than its neighbors. This was a problem particularly at low light levels, but a stray-light fix has been implemented and was put into operation on 20 August 2013 (a week after this image was taken) that should fix (or at least reduce) this.
Stray light is light that hits the detectors that isn’t coming from the Earth – it comes directly from the sun. This happens shortly after the satellite passes into the night side and shortly before it passes back into the day side of the Earth. Don’t worry, though. This was fixed along with the striping on 20 August 2013.
Now, what about those stripes that go from northeast to southwest (primarily over the Yukon Territory)? Are those some sort of artifact of the scaling method? Nope. Those are shadows cast by deep convective clouds near sunset – just like in this photo.
So, we’ve highlighted this problem with the DNB: how do you best display a 7-orders-of-magnitude change in value using only 256 colors? VIIRS already has the solution covered. It’s called the Near Constant Contrast product (often shortened to NCC).
The Near Constant Contrast product takes the radiance values observed by the DNB and coverts them into reflectance (also called albedo). Now, think about what it means to do this conversion. For most visible wavelength imagery, reflectance is relatively straight-forward to calculate. The satellite observes the reflected radiation, and we assume the incident radiation is all coming from the sun. (This is a good assumption during the daytime.) Calculating the incident solar radiation on each point on the Earth at a given time (and day of year, etc.) is considered a solved problem. But, what do we do at night?
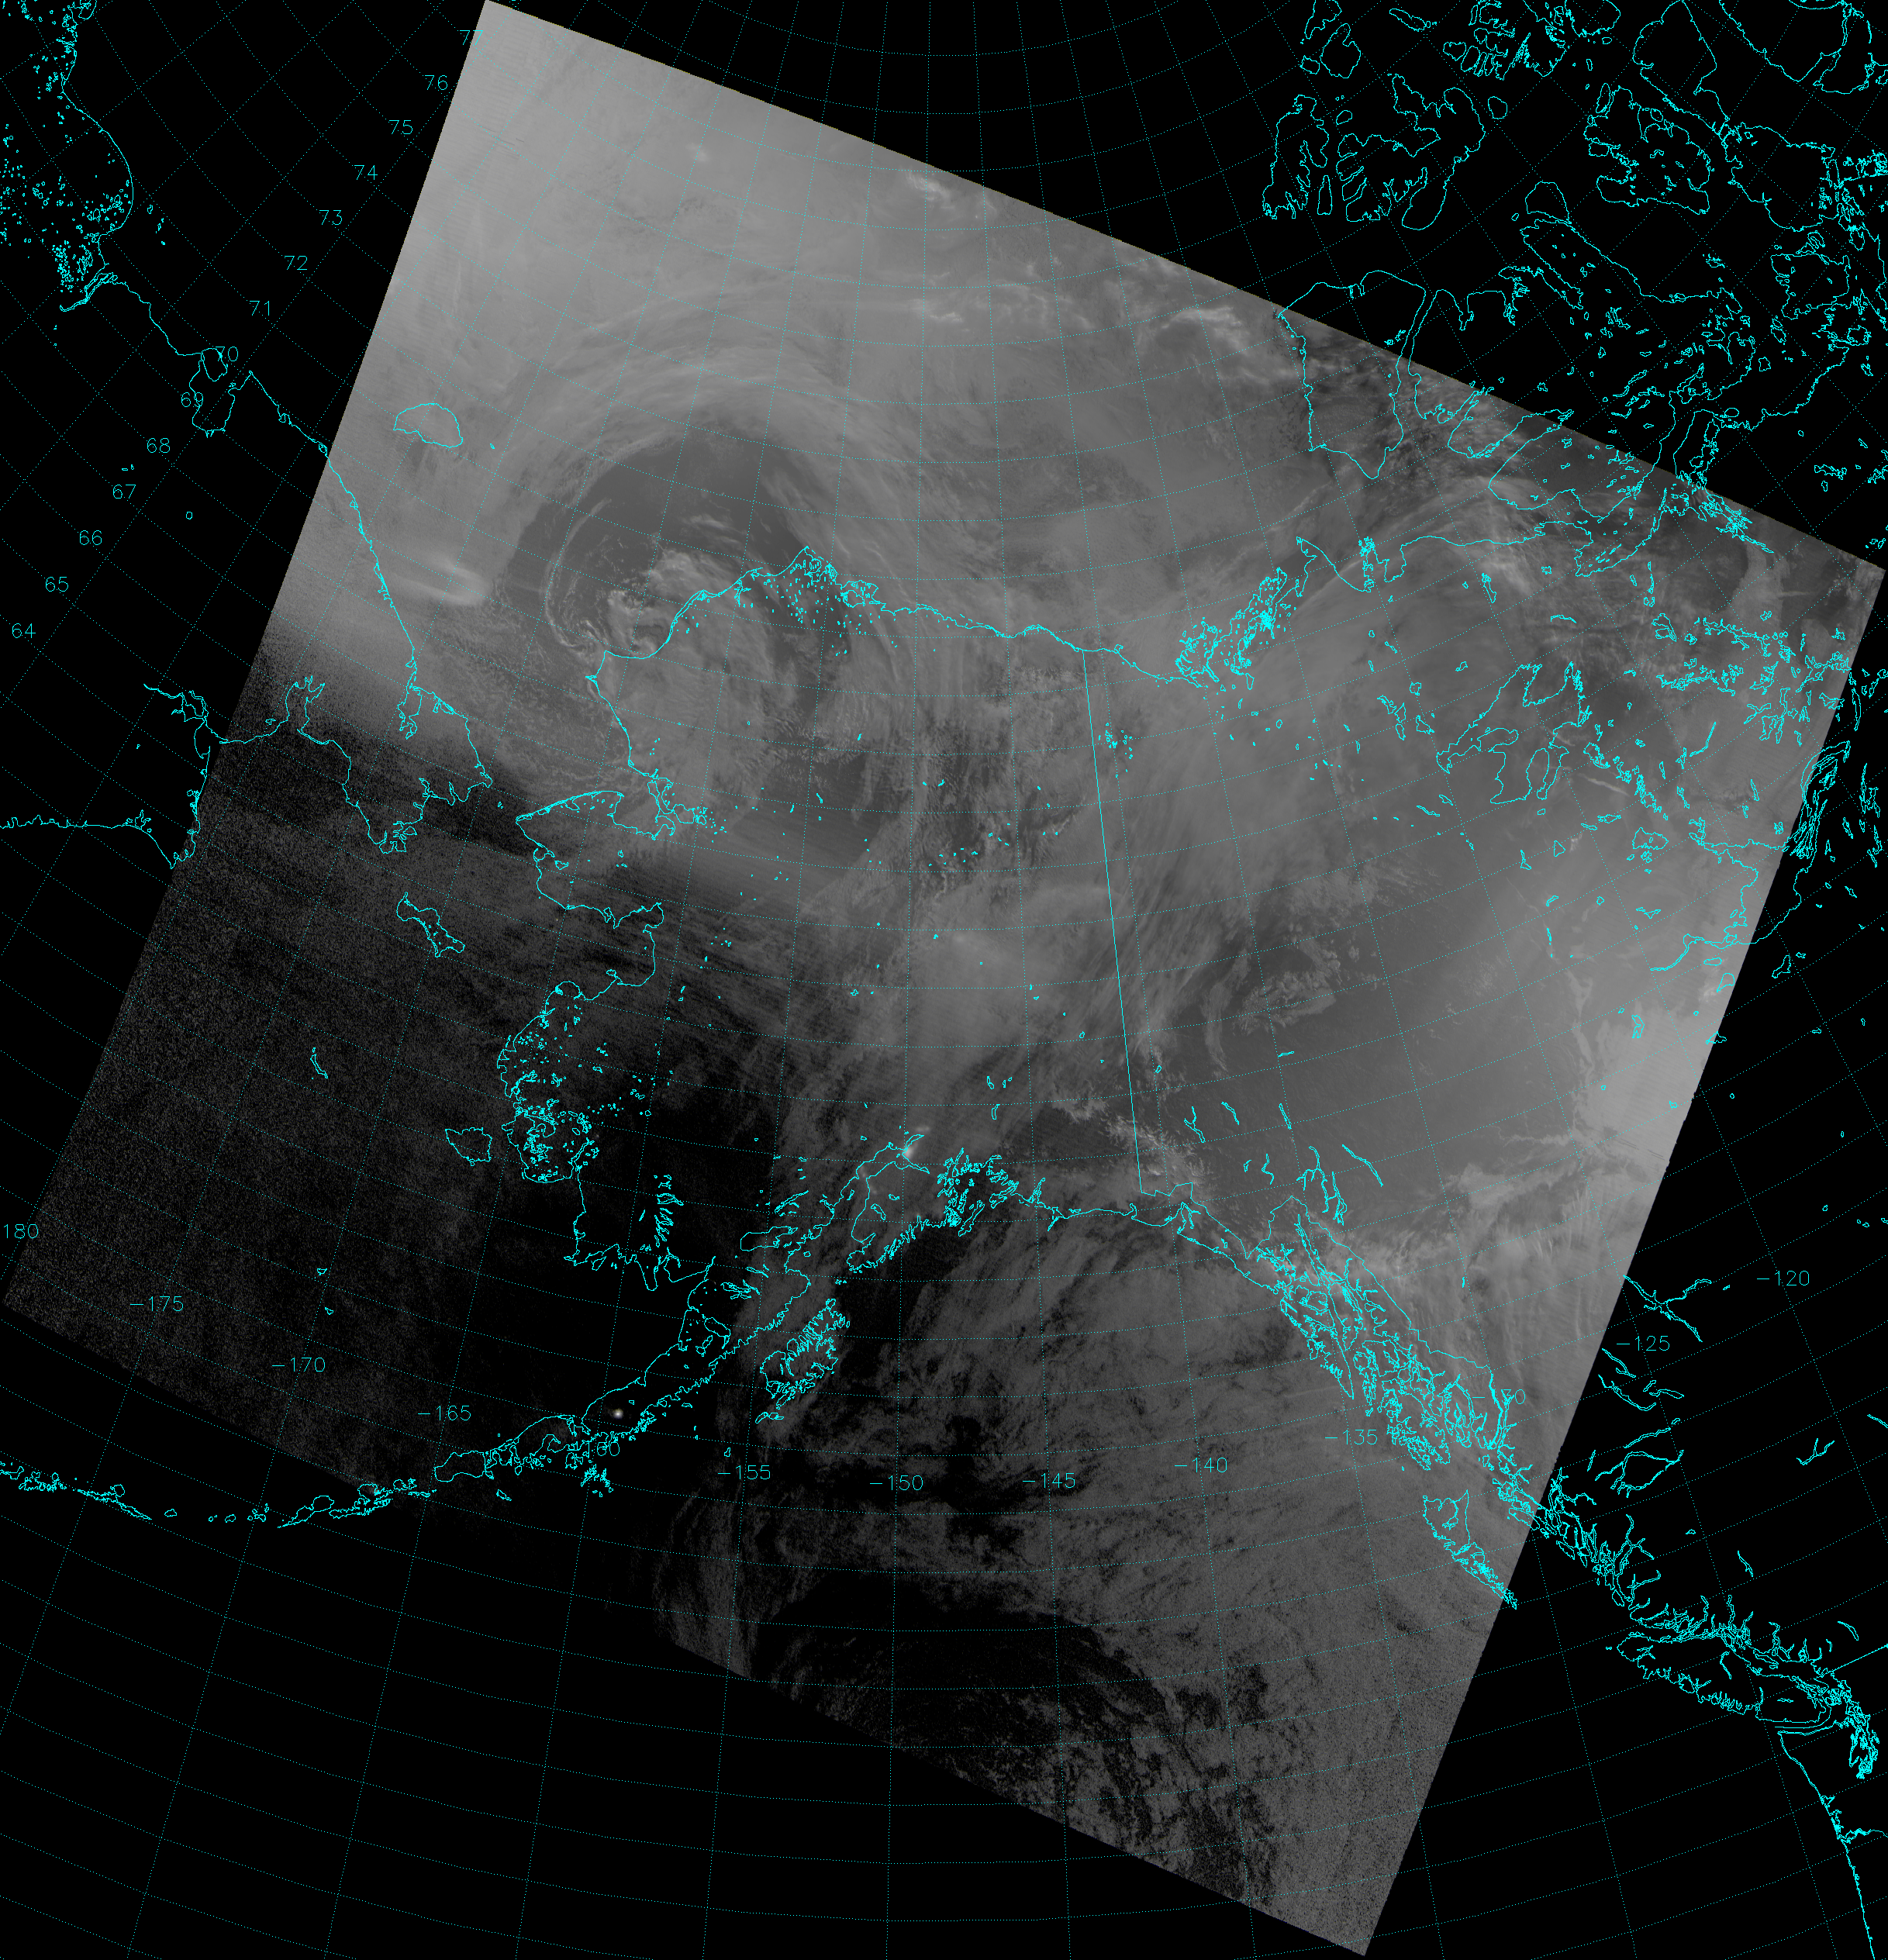
At night, you have to take the moon into account. The NCC imagery uses a model of the sun and moon to calculate the incident radiation for all points on the Earth at all times of day, all days of the year, for all phases of the moon. Accounting for this variation in the incident radation reduces the range of values we need to display for scenes that cross the terminator. The problem that arises is that the DNB senses light from more than just the sun and moon. It can detect fires, city lights and auroras (among other things), which are sources of emitted light, not reflected light. These light sources can be 2-3 orders of magnitude brighter than the reflected component (particularly during a new moon). Nevertheless, the NCC product reduces the range of values we have to display from 7-8 orders of magnitude down to 2-3 orders of magnitude, and it produces images like this:
This image was scaled using the base-10 logarithm of reflectance on a scale from -1.3 to 1.3 (roughly from 0.05 to 20 in the original reflectance units). The only loss of contrast occurs on the bottom of the image where stray light is contaminating the reflectance signal, and this has since been corrected for.
See that dot of light over the Alaska Peninsula? I’ll zoom in at full satellite resolution so you can get a better look:
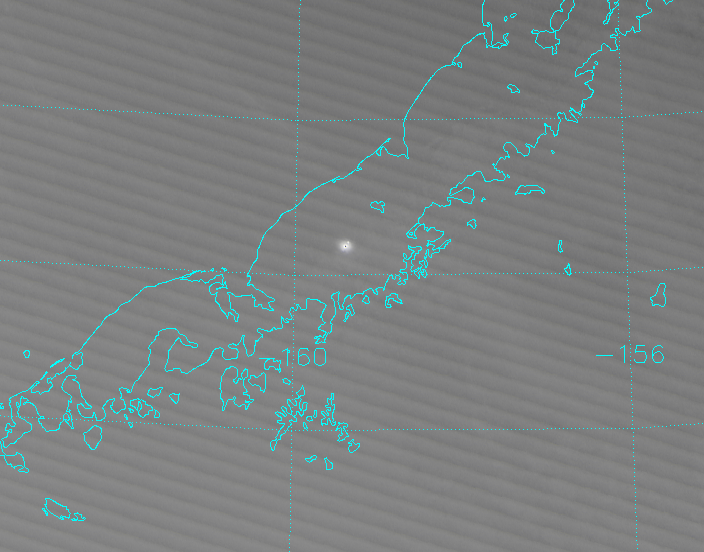
That’s light emitted by the molten-hot magma erupting from the Veniaminof volcano. The DNB (and its sister product, NCC) are sensitive enough to see glowing-hot lava all the way from outer space!
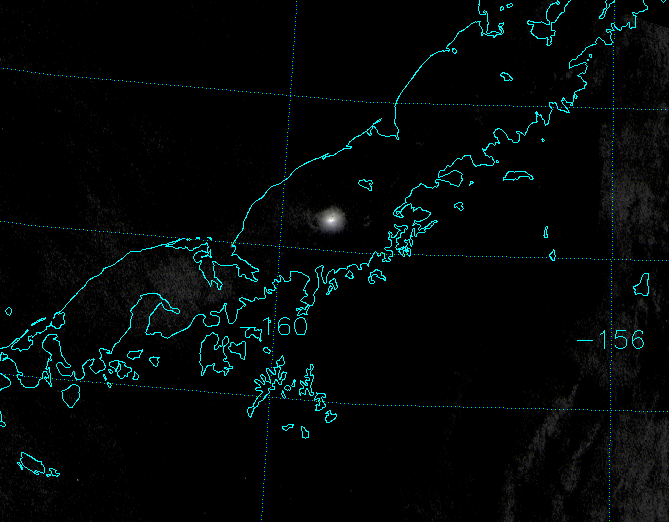
Want to know what it looks like with the stray light removed? Here’s an image from 30 August 2013 (about a week after the stray light correction became operational):
The Veniaminof volcano is still erupting at this time (two weeks later!), and is really easy to see. Here it is at full resolution:
Depending on how the scaling is performed, NCC and DNB imagery is very similar for daytime and nighttime scenes, but it is the twilight and near-terminator scenes where the NCC product really shines.
This is a test comment. Interested parties are invited and encouraged to initiate dialogue on these blog entries. We will do our best to respond to any questions. Please feel free to distribute this blog link to interested users in the Alaska Region, and they are welcome to nominate case studies that may become future blog entries.
Is the VIIRS Near Constant Contrast EDR in one of the published SPAs? I can’t seem to find NCC at the DRL web site.
The Near Constant Contrast EDR is available through the NOAA CLASS website (http://www.class.noaa.gov) or, if you have access to the GRAVITE server (http://www.star.nesdis.noaa.gov/jpss/ADL.php). I believe the National Weather Service and the Naval Research Laboratory are currently working on adding it to their operational feeds.
Is the NCC algorithm / method published somewhere? I’d like to re-create it on our own monitoring SW, if possible, avoiding the EDR.
The NCC algorithm is described in a paper by Liang et al. published in IEEE Transactions on Geoscience and Remote Sensing, VOL. 52, NO. 11, NOVEMBER 2014, pp. 6964-6971.
Very interesting post!
Do you suggest any method (or tool) to remove Lunar Radiance from DNB images?
Where can I ask for support concerning lunar radiance removal?
How is the DNB used in operational NWP? How useful it is? Has its impact on prediction accuracy been quantified?
How is the DNB used for climate studies?
Why was it not implemented in the GEO imagers?
Thanks