Full disclosure: this is not the only blog I maintain. I also write about the uses of VIIRS for all kinds of events around the globe for the JPSS Imagery and Visualization Team Blog. You can find that blog by clicking on the link “VIIRS Imagery Blog” below the banner image at the top of the page.
Sometimes, events happen that have appeal to both audiences. The calving of the B-31 iceberg from the Pine Island Glacier is one such event. I know the subtitle of this blog is “VIIRS in the Arctic” and Pine Island Glacier is part of Antarctica (opposite side of the world), but that doesn’t mean this is not applicable to people in the Arctic. Glacier calving and the break-up of ice sheets happen in both places.
If you want to read the full, original blog post I wrote, you can click here. Otherwise, on this blog post, I’ll focus on the practical applications that Arctic aficionados should be aware of.
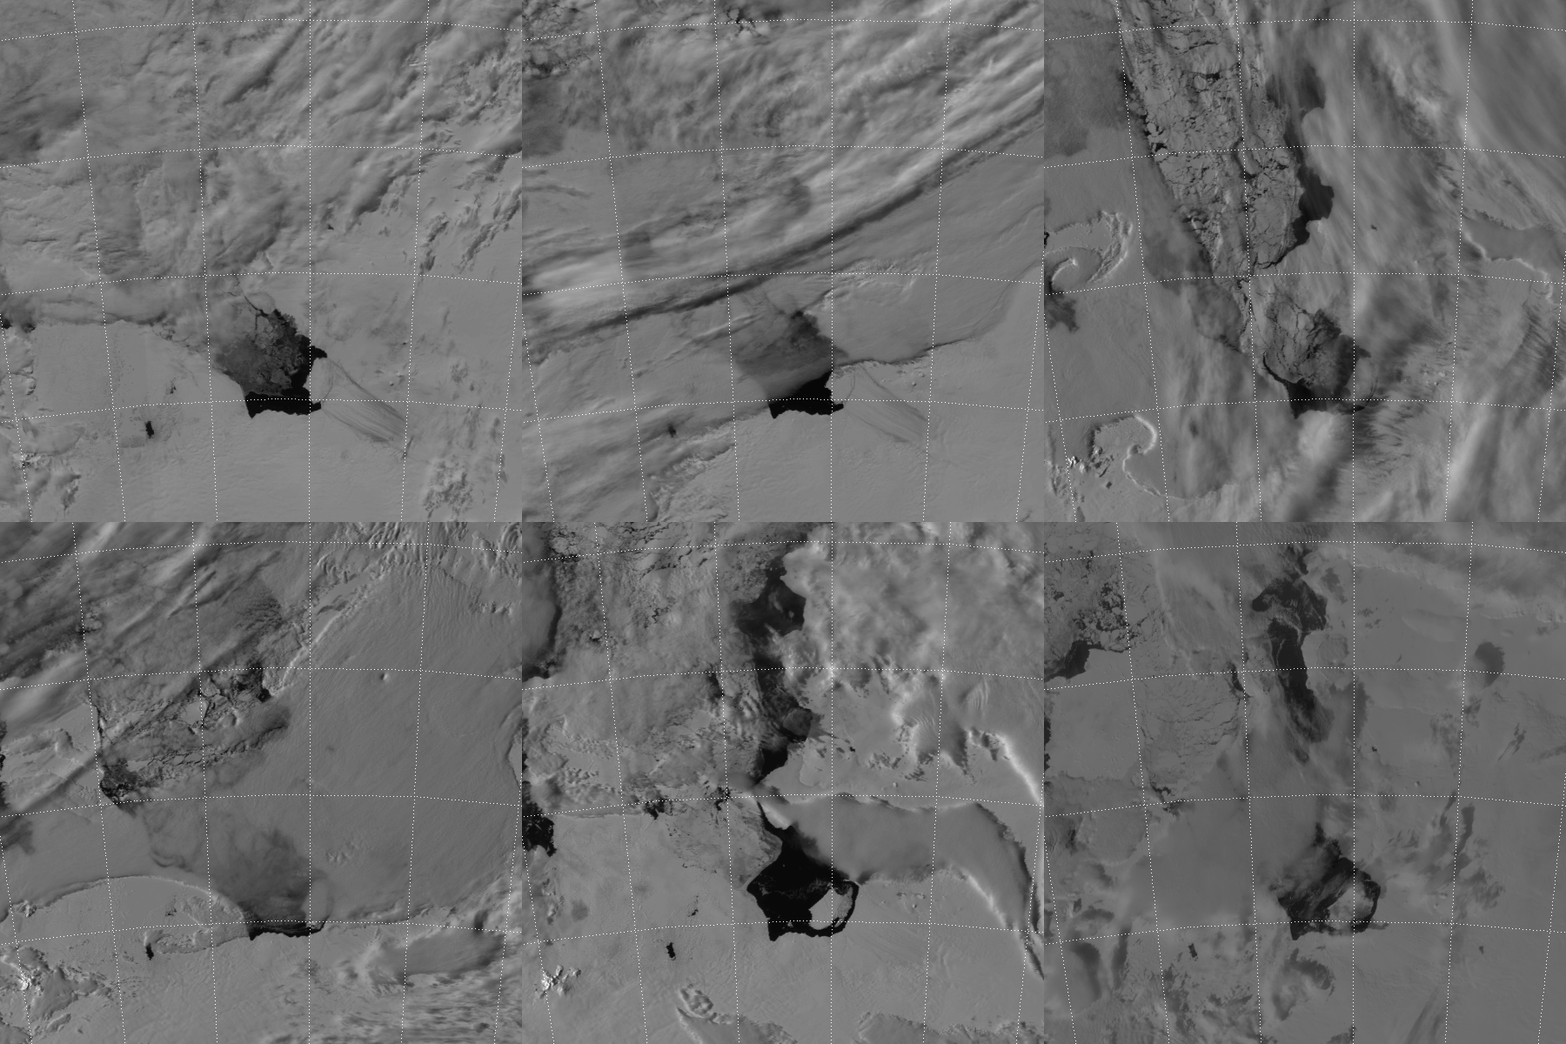
Now, this event started in October 2011, before VIIRS was even launched. A group of NASA researchers flying over Pine Island Glacier noticed a large crack beginning to form in the ice. Two years later, a chunk of ice estimated to be the size of the land area of Singapore had completed the calving process and the resulting iceberg has been named B-31. NASA released these images of B-31 from MODIS and Landsat-8.
Now VIIRS has something MODIS and Landsat do not have: the Day/Night Band (DNB), which is used to create Near Constant Contrast (NCC) imagery. Even though it is summer in Antarctica right now, Pine Island Glacier is at a latitude where the day/night terminator passes over our region of interest on an almost daily basis (i.e. except near the December solstice). As explained before, these twilight scenes are where the NCC imagery really proves its worth.
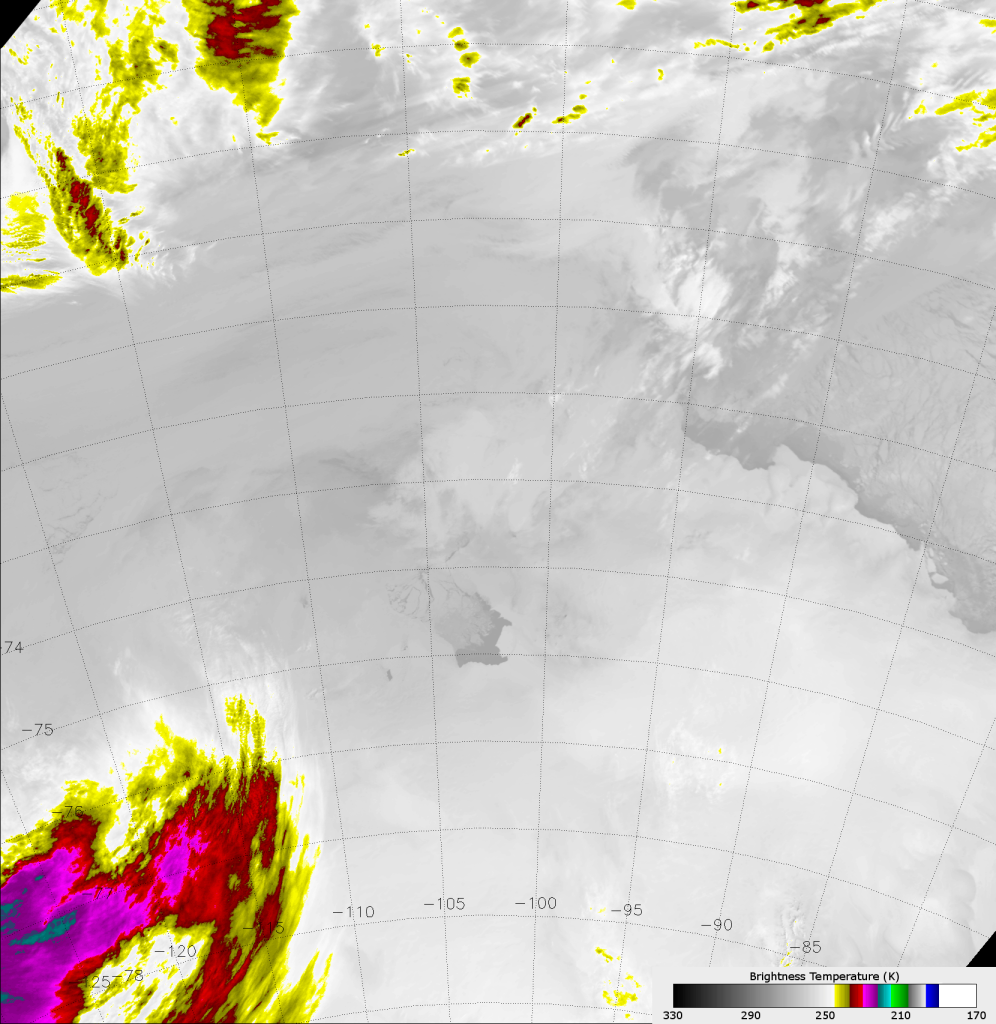
Being able to detect visible wavelength radiation at all hours of the day is very valuable. To demonstrate this, take a look at the VIIRS infrared image (M-15, 10.7 µm) below. Images in the “infrared window” (the N-band window, according to this site) used to be the only way to detect surface features and clouds at night. At these wavelengths, the amount of radiation detected by the satellite is a function of the temperature of the objects the instrument is looking at.

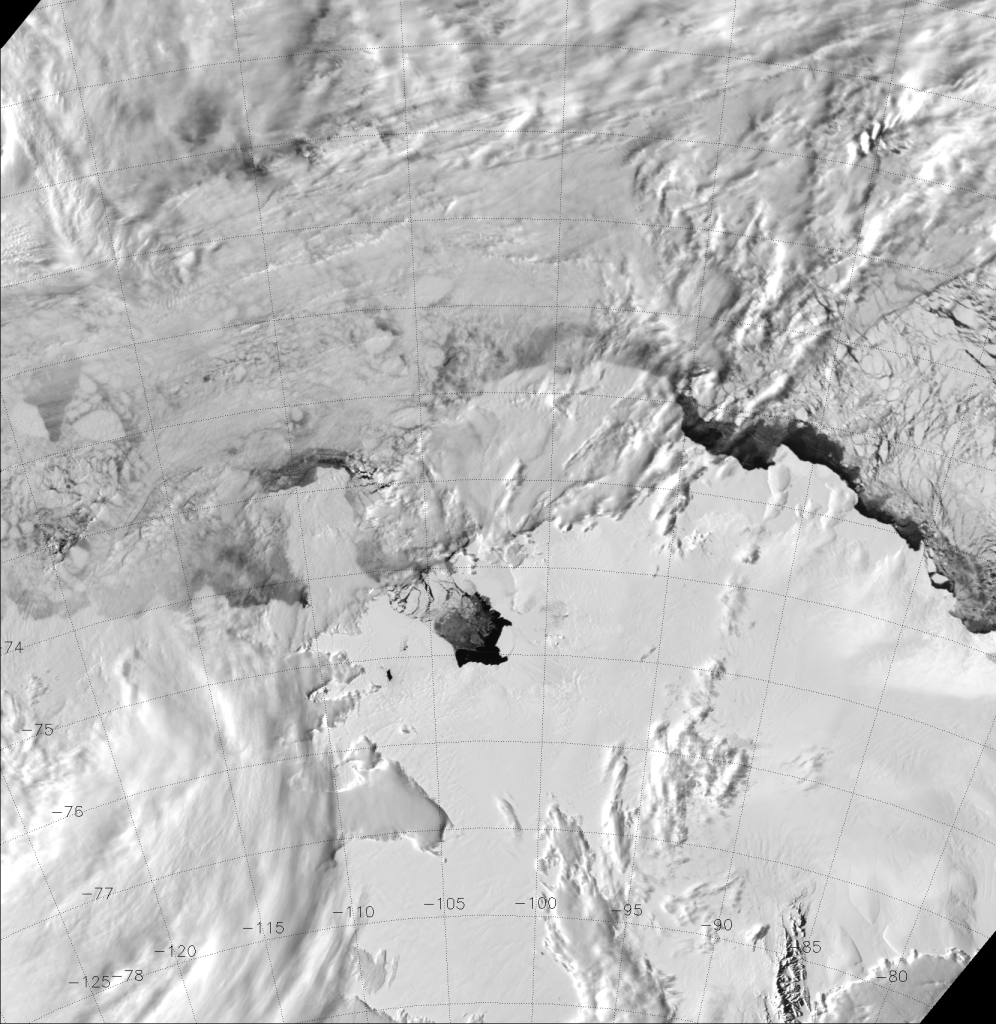
See that slightly darker gray area near the center of the image? That’s open water in Pine Island Bay, which is only slightly warmer than the ice and low clouds surrounding it. Otherwise, there isn’t much detail in this picture. What really stands out are the cold, high clouds that are highlighted by the color scale. Contrast this with a visible wavelength image from the same time (M-5, 0.67 µm):

The open water in Pine Island Bay shows up clear as day because, well, it is daytime and the ice and snow reflect a lot more sunlight back to the satellite than the open water does. Icebergs can easily be distinguished from the low clouds now. You can even see through some of the low clouds to identify individual icebergs that are not visible in the infrared image. In fact, it is difficult to identify any icebergs in the infrared image. And, even though this is a daytime scene, the same holds true at night when only moonlight is available.
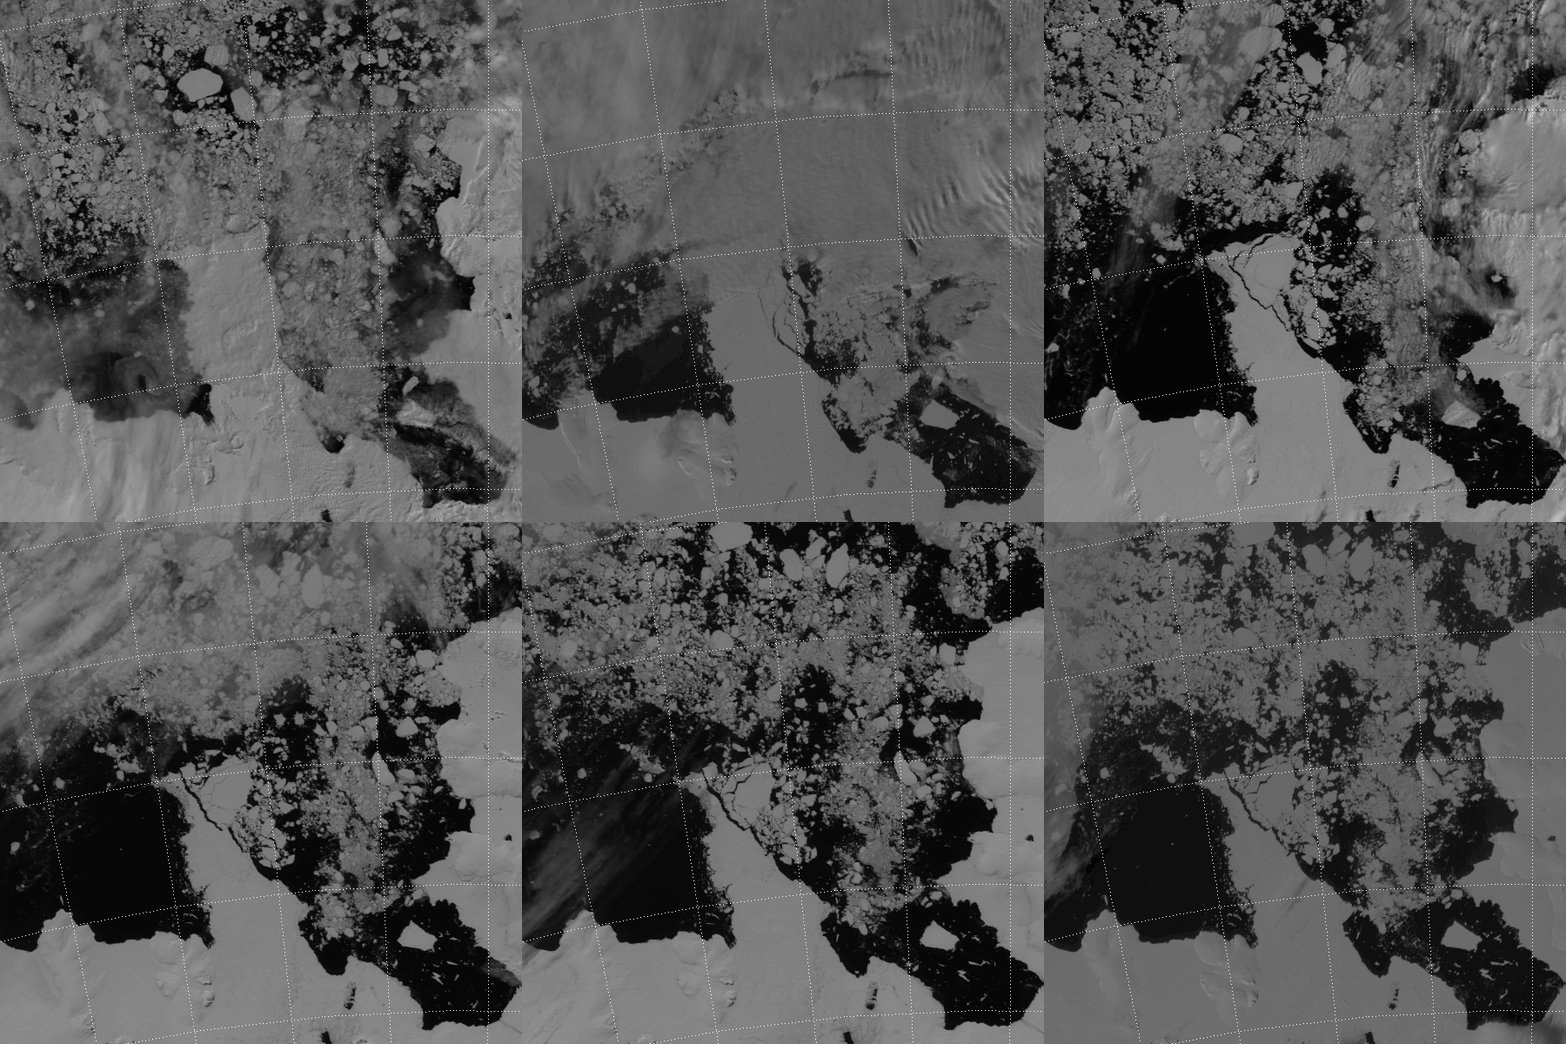
Since VIIRS is on a polar-orbiting satellite, it views the poles every orbit (~101 minutes). This provides a lot of overpasses with which to capture the calving of B-31, which hadn’t happened yet in the images above. If we zoom in on Pine Island Bay, it is quite easy to see this major calving event:

I should say that the above animation does not include images from every orbit. I’ve subjectively removed images that were too cloudy to see anything as well as images where the VIIRS swath didn’t cover enough of the scene. This left 25 images over the 11 day period. Even so, VIIRS captured the moment of B-31 breaking free quite well.
Notice how easy it is to monitor the motions of the icebergs in this loop – even in the presence of thin clouds.
VIIRS was able to track the B-31 iceberg in the weeks following the calving event, which occurred on or about 11 November 2013. To prove it, here is a video (in MP4 format) of NCC images from the start of the above animation (7 November 2013) all the way to 26 December 2013:
Animation of VIIRS NCC images from 7 November – 26 December 2013 (.mp4 file)
You may need an appropriate browser plug-in or add-on (or whatever your browser calls it) to be able to view the video.
That’s 50 days of relatively cloud-free VIIRS NCC images (7 November – 26 December 2013), compressed down to 29 seconds. Go ahead, watch the video more than once. Each viewing uncovers additional details. Notice how B-31 doesn’t move much after 10 December. Notice how ice blocks the entrance to Pine Island Bay at the beginning of the loop, then clears out by the end of the loop. Notice all the icebergs near the shore that are pushed or pulled or blown out to sea from about 20 December through the end of the loop. Notice that B-31 isn’t even the biggest chunk of ice out there. Notice the large ice sheet on the west side of Pine Island Bay that breaks up right at the end of the loop. In fact, here’s another zoomed-in animated GIF to make sure you notice it:

The area of ice that breaks off of that ice sheet is much larger than B-31! In fact, I would estimate it to be roughly the size of the state of Rhode Island. B-31 has been described as a city-sized iceberg, but this is a state-sized amount of ice breaking off of an ice sheet on Antarctica.
Being able to track these icebergs both day and night is very important. On 24 December 2013, a Russian icebreaker ship got stuck in the ice surrounding Antarctica and it took two weeks to free the ship. That was after a helicopter rescue and help from the Chinese and Australians.