Tag Archives: day/night

Glow-in-the-dark Water

Have you ever started looking for something, only to find something else that was more interesting than what you were originally looking for?

Back on 10 January 2014, there were widespread rumors of a significant aurora event that would be visible much further south than usual. It got a lot of people excited, even in our backyard here in Colorado. But did it happen?

If you’re curious, here is an explanation as to why the aurora forecasts were a bust. But, that’s not to say the aurora didn’t exist anywhere on the globe. The VIIRS Day/Night Band image below shows there was an aurora that made it as far south as Iceland.

VIIRS Day/Night Band image, taken 02:31 UTC 10 January 2014

What about on the next orbit? Was the aurora still there?
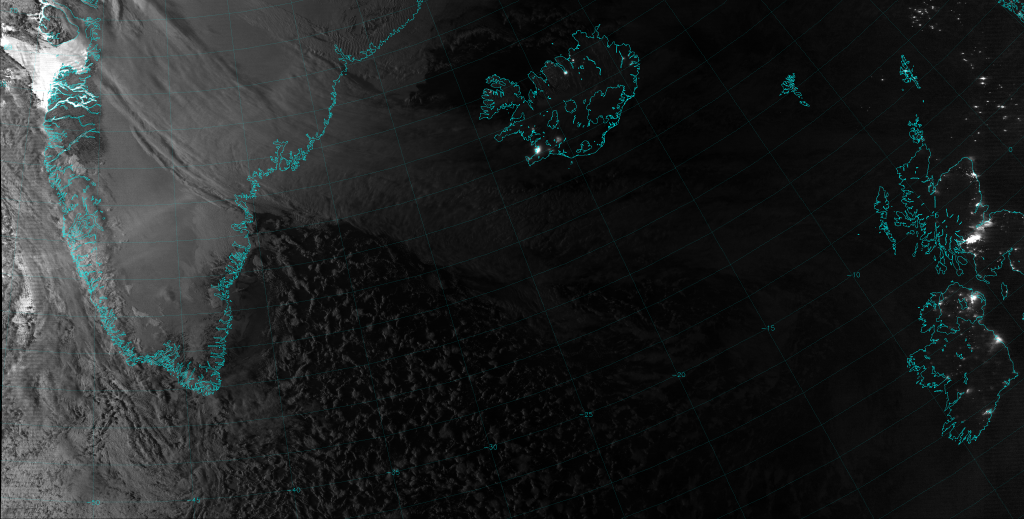
VIIRS Day/Night Band image, taken at 04:13 UTC 10 January 2014

If you squint, you can maybe see it over south-central Greenland. But, hold on a minute! What’s that in the upper-left corner? Why is the water so bright off the west coast of Greenland?

This is a nighttime scene, as evidenced by the city lights over Iceland, Ireland and the UK, although you might not think that by looking at only the left side of the image. And, let me assure you, the day/night terminator never appears at this angle at this time of day in January.

CIRA researchers have recently begun producing VIIRS imagery centered on Alaska on a quasi-operational basis. About a month ago, I noticed this image that also shows “glow-in-the-dark” water, and the mystery deepened:

VIIRS Day/Night Band image, taken 11:37 UTC 9 February 2014

And again, a few days ago, the Day/Night Band captured this image:

VIIRS Day/Night Band image, taken 12:35 UTC 10 March 2014

This time, there is a pretty vivid aurora but, you can also see bright water off the southern coast of Russia.  So, what’s with water that appears to be glowing in the dark?

Is it some kind of bio-luminescent phenomenon, like milky seas? Is it some kind of radioactivity that makes everything glow, like in The Simpsons? Or an alien-UFO conspiracy to control the world’s population?

Sorry to get your hopes up, “truthers,” but it’s a pretty mundane explanation. (Either that, or I’m a member of the Illuminati. MWAH HA HA!) Have you ever looked at a body of water and saw glare from the sun? Or seen glare off of snow and ice? We call that sunglint. It is related to the Bi-directional Reflectance Distribution Function (BRDF), the mathematical way we describe that incoming light on a surface reflects more at certain angles than others. But, it’s not only sunlight that causes glint. Moonlight does it, too. (What is moonlight, if not reflected sunlight?)

Notice that the images with the glowing water were taken roughly a month apart. That’s not just a coincidence. According to this website, each of those images was taken 2-3 days after the moon reached first quarter, when the moon was 75-80% full. Why is this important? Because the phase of the moon is related to when the moon rises and sets, and this determines where the moon is in the sky when VIIRS passes overhead.

From a day or two after last quarter to new moon to a day or two after first quarter, the moon is below the horizon when VIIRS passes overhead during the nighttime overpass. (It’s above the horizon on the daytime overpass, but you can’t tell because the sun is so bright.) From just after first quarter to full moon to just after last quarter, the opposite is true – the moon is up at night and down during the day. When you get to 2-3 days after first quarter, that’s when the moon is close to the western horizon when VIIRS passes over at night. That’s why the left sides of the above images are brighter than the right sides. And, that’s also when this form of moon glint occurs, just like in this clip.

It’s not aliens or UFOs or mysterious radioactivity. It’s the geometry between the satellite, the Earth and the moon and the preferential reflection of light off of a body of water. It’s repeatable and predictable. It’s science.


UPDATE (3/14/2014): “Glow-in-the-dark” water is not confined to high latitudes like Greenland and Alaska. It happens anywhere the angle between the satellite, the Earth’s surface and the moon is in the glint range. Steve Miller (CIRA) forwarded information about a case he looked at off the coast of Louisiana. Here’s one of his images with everything labelled:

VIIRS Day/Night Band image, taken 07:41 UTC 12 January 2014
VIIRS Day/Night Band image, taken 07:08 UTC 12 January 2014. Interesting features have been identified and labelled.

This case occurred when the moon was 90% full. The brightest water occurs where the surface is calm and the “glint angle” is less than 10°.  When the surface is not calm, waves scatter the light in different directions and only a portion of the light is reflected to the satellite. This makes the water appear not as bright. For glint angles between 0° and 30°, waves will scatter some of the light back to the satellite, and the water won’t appear dark. Calm water outside the 10° glint zone will appear dark, though, because the angle of the water surface isn’t right to reflect the moonlight back to the satellite. This is what you see along the coast of Texas. Outside of the 30° zone, waves aren’t at the proper angle to reflect light back to the satellite.

To demonstrate this, here’s a comparison with the same area on the next orbit along with the glint angles:
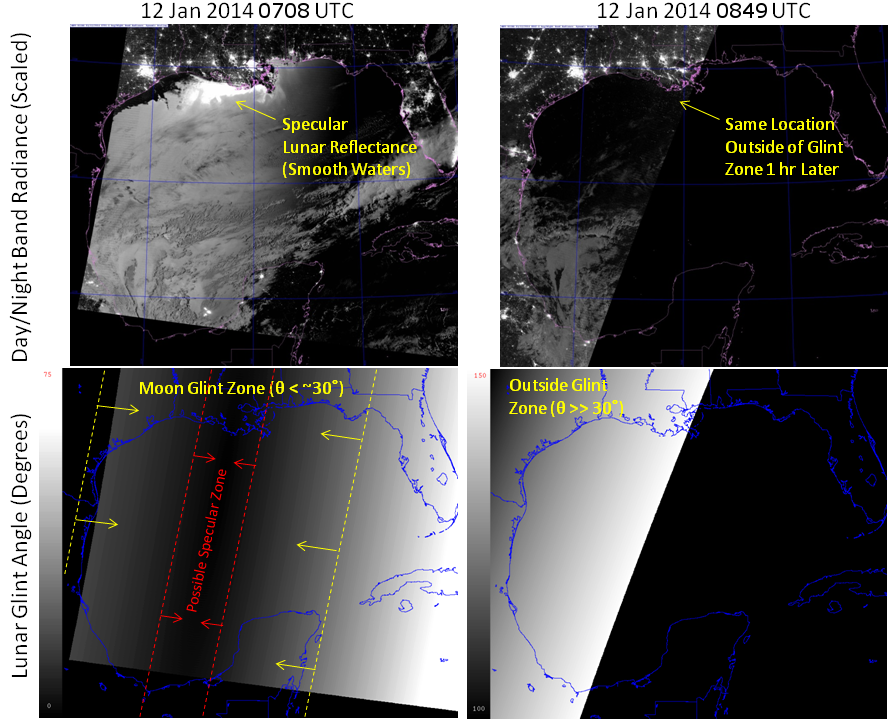
Comparison between DNB images and lunar glint angle for consecutive VIIRS overpasses on 12 January 2014
Comparison between DNB images and lunar glint angle for consecutive VIIRS overpasses on 12 January 2014.

On the next overpass, about 100 minutes later, all the water is outside the glint zone (the glint angles are all higher than 100°) and the water is dark everywhere, as expected.
The Calving of B-31

Full disclosure: this is not the only blog I maintain. I also write about the uses of VIIRS for all kinds of events around the globe for the JPSS Imagery and Visualization Team Blog. You can find that blog by clicking on the link “VIIRS Imagery Blog” below the banner image at the top of the page.

Sometimes, events happen that have appeal to both audiences. The calving of the B-31 iceberg from the Pine Island Glacier is one such event. I know the subtitle of this blog is “VIIRS in the Arctic” and Pine Island Glacier is part of Antarctica (opposite side of the world), but that doesn’t mean this is not applicable to people in the Arctic. Glacier calving and the break-up of ice sheets happen in both places.

If you want to read the full, original blog post I wrote, you can click here. Otherwise, on this blog post, I’ll focus on the practical applications that Arctic aficionados should be aware of.

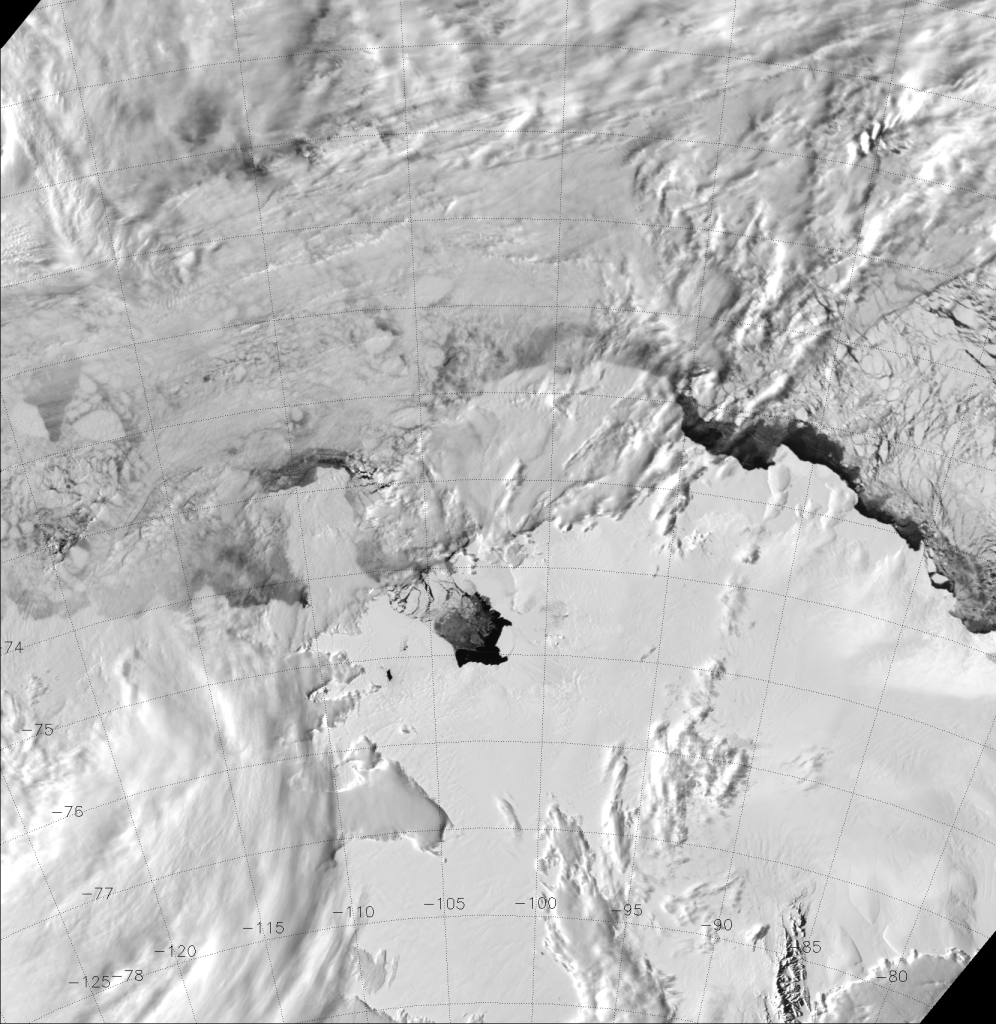
Now, this event started in October 2011, before VIIRS was even launched. A group of NASA researchers flying over Pine Island Glacier noticed a large crack beginning to form in the ice.  Two years later, a chunk of ice estimated to be the size of the land area of Singapore had completed the calving process and the resulting iceberg has been named B-31. NASA released these images of B-31 from MODIS and Landsat-8.

Now VIIRS has something MODIS and Landsat do not have: the Day/Night Band (DNB), which is used to create Near Constant Contrast (NCC) imagery. Even though it is summer in Antarctica right now, Pine Island Glacier is at a latitude where the day/night terminator passes over our region of interest on an almost daily basis (i.e. except near the December solstice). As explained before, these twilight scenes are where the NCC imagery really proves its worth.

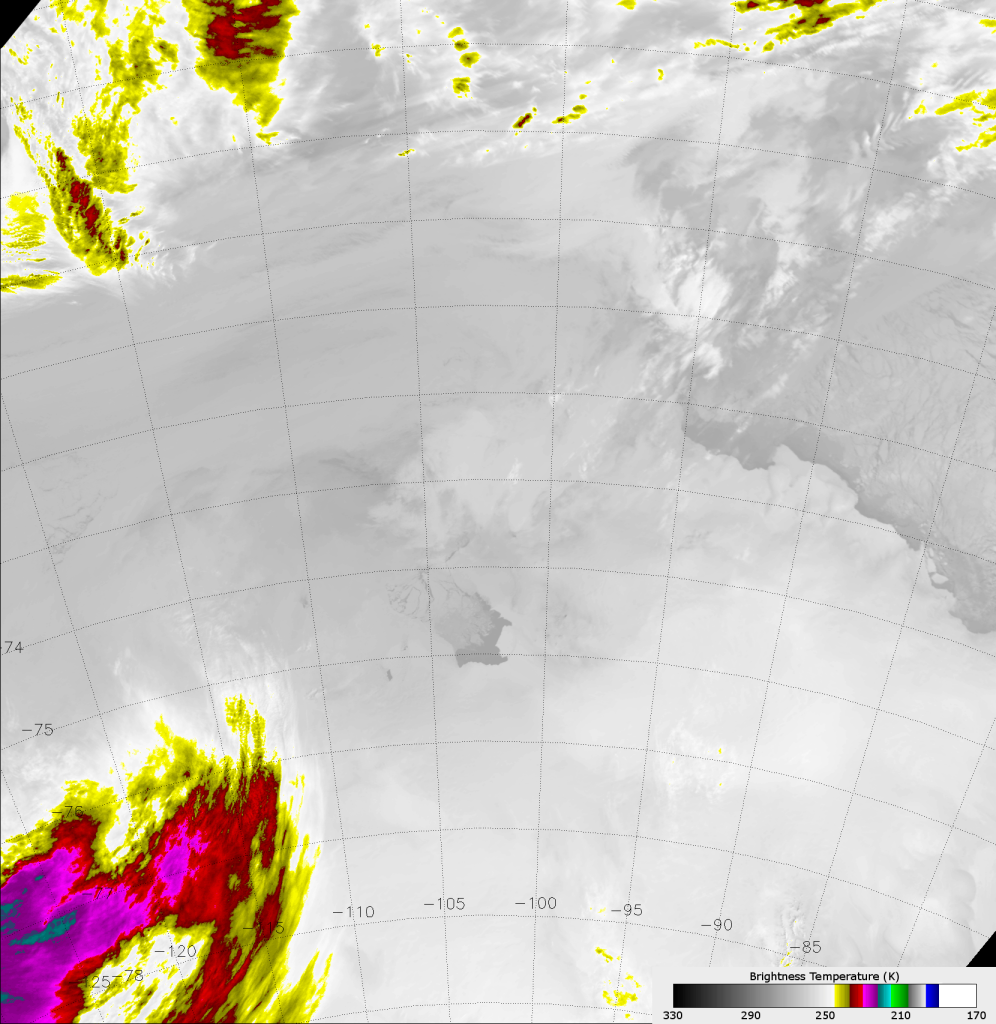
Being able to detect visible wavelength radiation at all hours of the day is very valuable. To demonstrate this, take a look at the VIIRS infrared image (M-15, 10.7 µm) below. Images in the “infrared window” (the N-band window, according to this site) used to be the only way to detect surface features and clouds at night. At these wavelengths, the amount of radiation detected by the satellite is a function of the temperature of the objects the instrument is looking at.

VIIRS IR image (M-15) taken 23:34 UTC 7 November 2013

See that slightly darker gray area near the center of the image? That’s open water in Pine Island Bay, which is only slightly warmer than the ice and low clouds surrounding it. Otherwise, there isn’t much detail in this picture. What really stands out are the cold, high clouds that are highlighted by the color scale. Contrast this with a visible wavelength image from the same time (M-5, 0.67 µm):

VIIRS visible (M-5) image, taken 23:34 UTC 7 November 2013

The open water in Pine Island Bay shows up clear as day because, well, it is daytime and the ice and snow reflect a lot more sunlight back to the satellite than the open water does. Icebergs can easily be distinguished from the low clouds now. You can even see through some of the low clouds to identify individual icebergs that are not visible in the infrared image. In fact, it is difficult to identify any icebergs in the infrared image. And, even though this is a daytime scene, the same holds true at night when only moonlight is available.

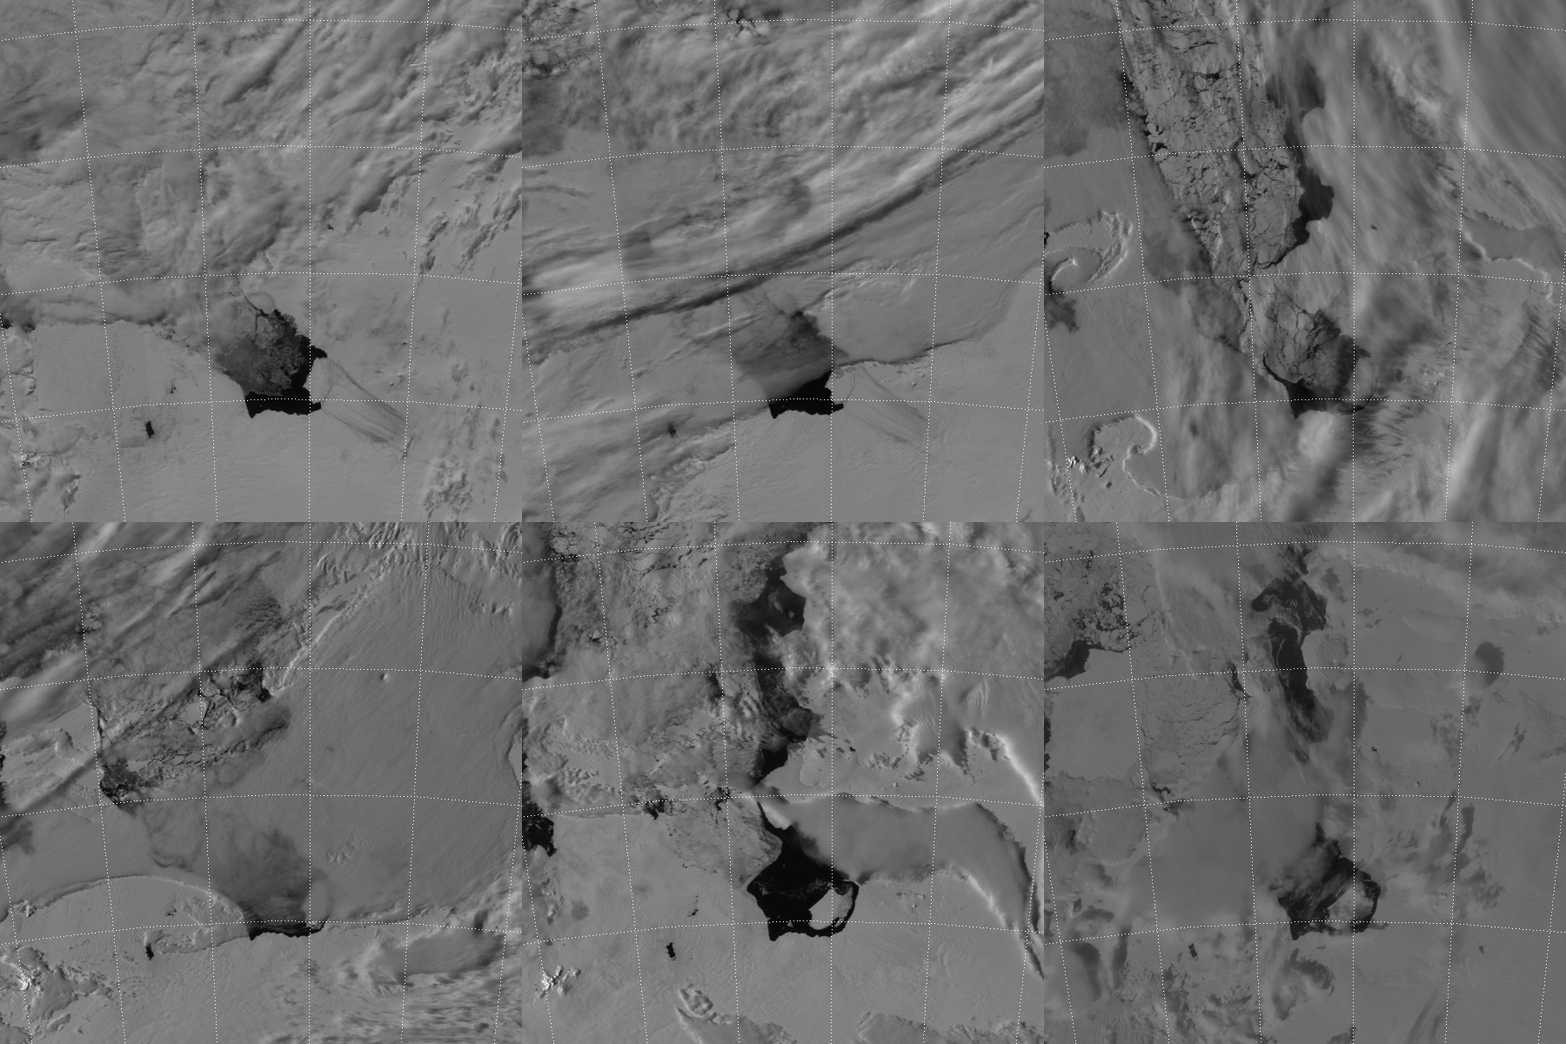
Since VIIRS is on a polar-orbiting satellite, it views the poles every orbit (~101 minutes). This provides a lot of overpasses with which to capture the calving of B-31, which hadn’t happened yet in the images above. If we zoom in on Pine Island Bay, it is quite easy to see this major calving event:

Animation of VIIRS NCC images of the Pine Island Glacier from 7-18 November 2013
Animation of VIIRS NCC images of the Pine Island Glacier from 7-18 November 2013.

I should say that the above animation does not include images from every orbit. I’ve subjectively removed images that were too cloudy to see anything as well as images where the VIIRS swath didn’t cover enough of the scene. This left 25 images over the 11 day period. Even so, VIIRS captured the moment of B-31 breaking free quite well.

Notice how easy it is to monitor the motions of the icebergs in this loop – even in the presence of thin clouds.

VIIRS was able to track the B-31 iceberg in the weeks following the calving event, which occurred on or about 11 November 2013. To prove it, here is a video (in MP4 format) of NCC images from the start of the above animation (7 November 2013) all the way to 26 December 2013:

Animation of VIIRS NCC images from 7 November – 26 December 2013 (.mp4 file)

You may need an appropriate browser plug-in or add-on (or whatever your browser calls it) to be able to view the video.

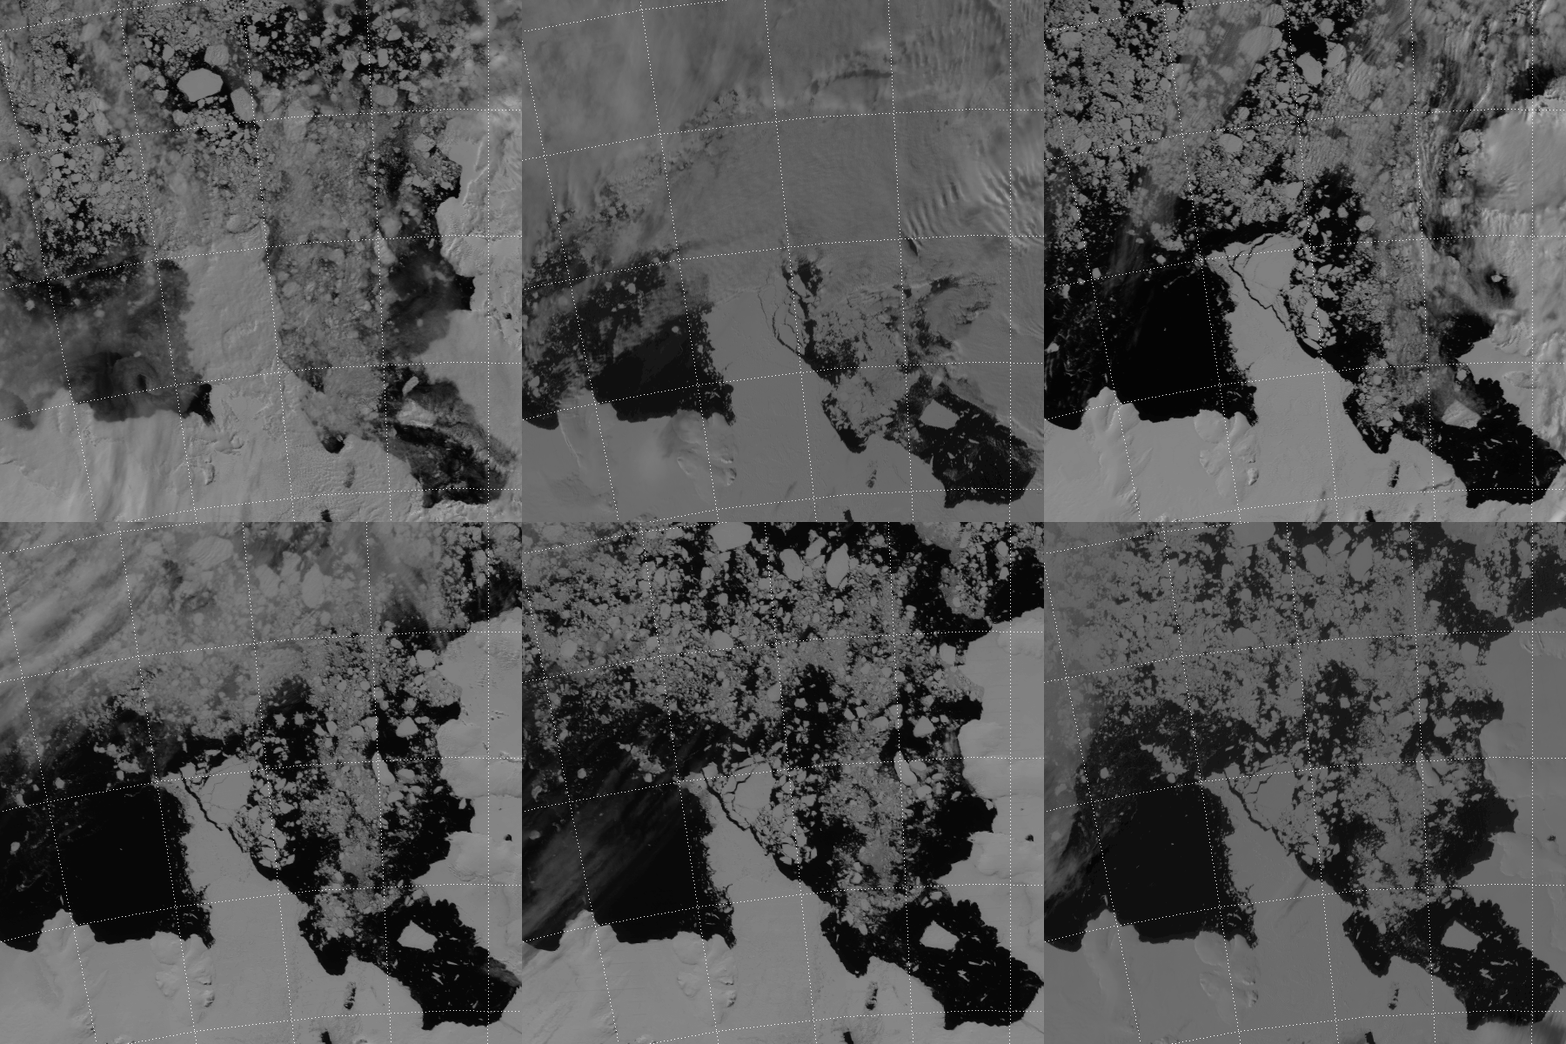
That’s 50 days of relatively cloud-free VIIRS NCC images (7 November – 26 December 2013), compressed down to 29 seconds. Go ahead, watch the video more than once. Each viewing uncovers additional details. Notice how B-31 doesn’t move much after 10 December. Notice how ice blocks the entrance to Pine Island Bay at the beginning of the loop, then clears out by the end of the loop. Notice all the icebergs near the shore that are pushed or pulled or blown out to sea from about 20 December through the end of the loop. Notice that B-31 isn’t even the biggest chunk of ice out there. Notice the large ice sheet on the west side of Pine Island Bay that breaks up right at the end of the loop. In fact, here’s another zoomed-in animated GIF to make sure you notice it:

Animation of VIIRS NCC images from 20-26 December 2013
Animation of VIIRS NCC images from 20-26 December 2013.

The area of ice that breaks off of that ice sheet is much larger than B-31! In fact, I would estimate it to be roughly the size of the state of Rhode Island. B-31 has been described as a city-sized iceberg, but this is a state-sized amount of ice breaking off of an ice sheet on Antarctica.

Being able to track these icebergs both day and night is very important. On 24 December 2013, a Russian icebreaker ship got stuck in the ice surrounding Antarctica and it took two weeks to free the ship. That was after a helicopter rescue and help from the Chinese and Australians.

Beginning to See the Light: an Introduction to VIIRS DNB and NCC

If you found this webpage, you are either A) a spam-bot searching for new websites to inundate with spam messages, B) interested in learning about VIIRS and it’s revolutionary Day/Night Band or C) very upset at Google right now for steering you to the wrong place. This website is for those of you in group B, but hopefully a few of you in group C will stick around and become interested to learn about the kinds of things you can do with weather satellites – particularly with a sensor as powerful as the VIIRS Day/Night Band.

First, a little background on VIIRS. Actually, just read this “Beginner’s Guide” (PDF file) that I wrote if you need background. (Hey, I wrote it. I might as well promote it.) It’s designed for people who are interested in using the data but, even if you don’t deal with VIIRS data directly, that PDF has a lot of good information in it you may find useful. Our topic today is basically an expansion on pages 23 and 24 of that document.

Typically, imaging sensors on weather satellites operate in the visible and infrared portion of the electromagnetic spectrum. This is the case with VIIRS, which has 22 channels (also called “bands”) ranging in wavelength from 0.412 µm to 12.01 µm. Perhaps the most revolutionary channel on VIIRS is the Day/Night Band (or DNB). The DNB is a broadband channel sensitive to radiation in the wavelength range from about 0.5 – 0.9 µm, which covers much of the visible and into the near-infrared (near-IR) wavelengths.

What makes the Day/Night Band unique is its ability to detect the low levels of visible light that occur at night. Most visible-wavelength sensors don’t work at night because the signal is well below the noise of the instrument. (Only the DMSP OLS was able to capture visible imagery at night prior to the launch of VIIRS and the DNB has the OLS beat in spatial resolution, radiometric resolution and quantitative applications.)

The DNB observes band-integrated radiance values at ~750 m spatial resolution over a ~3000 km-wide swath that covers the entire Earth twice a day. Since it is on a polar-orbiting satellite, Suomi NPP, it observes high latitude areas (like the Arctic) every orbit (every 101 minutes). The data produced by the DNB is very useful for Arctic applications (as we will show in future topics), but it can be difficult to work with.

The radiance values observed at night are roughly 7-8 orders of magnitude less than during the day, and they vary by several orders of magnitude between a new moon and a full moon. (Here’s a quick and dirty resource for information on the moon’s phase.) This large contrast between day and night creates a lot of problems when trying to display images near the day/night terminator since a lot of computer displays only allow 256 colors. For high-latitude places like Alaska, the terminator is present all night long in the summer months.

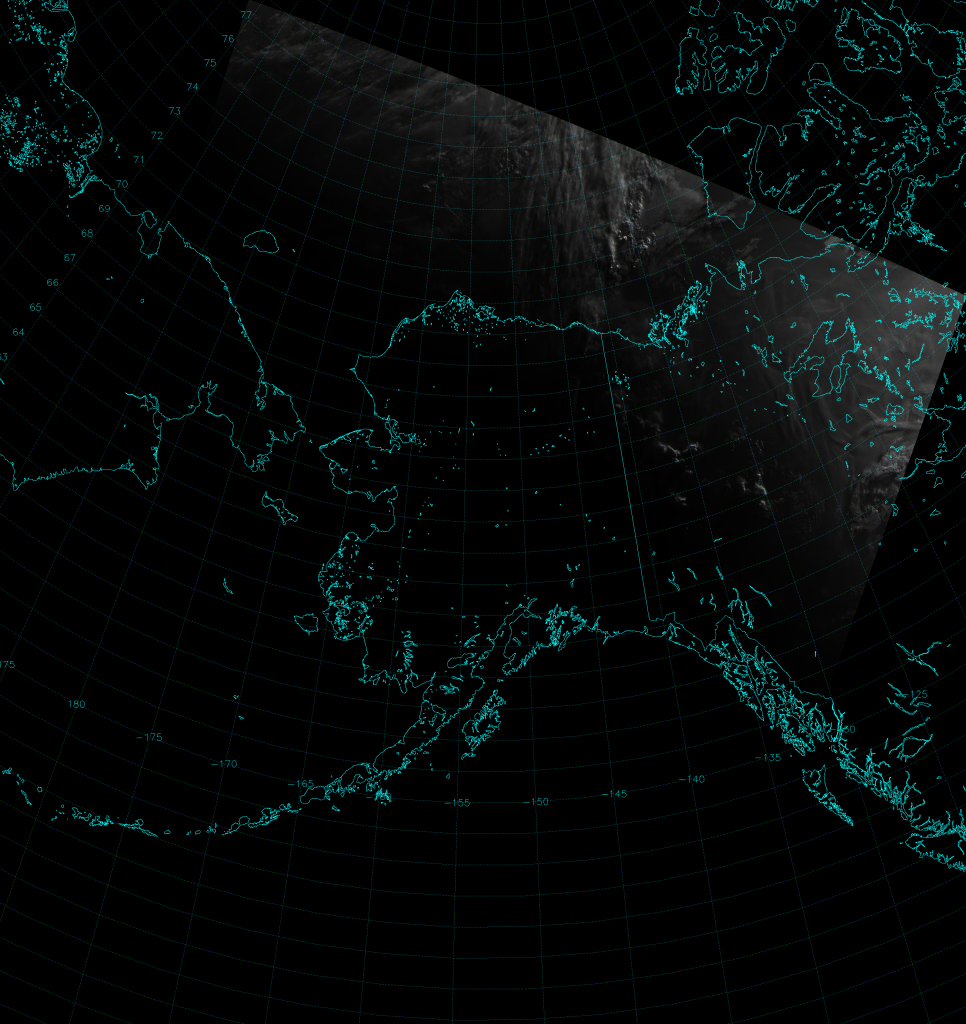
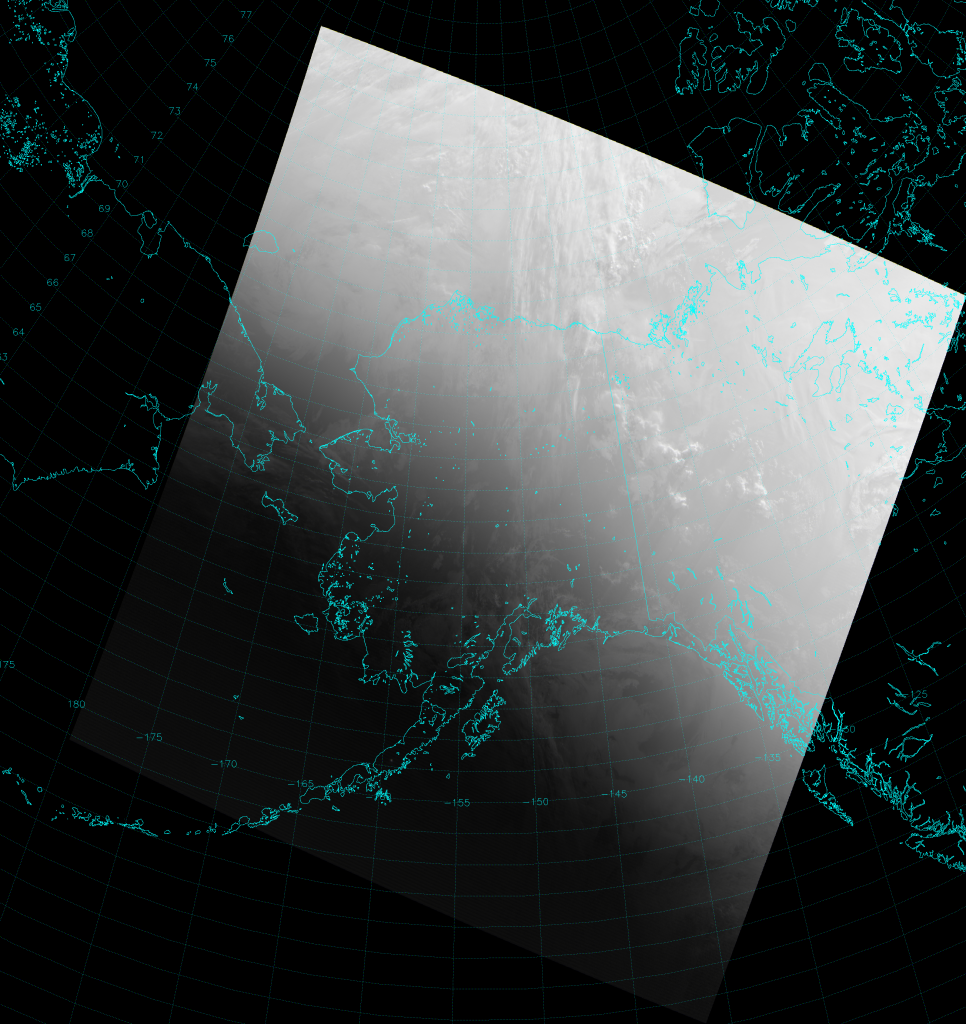
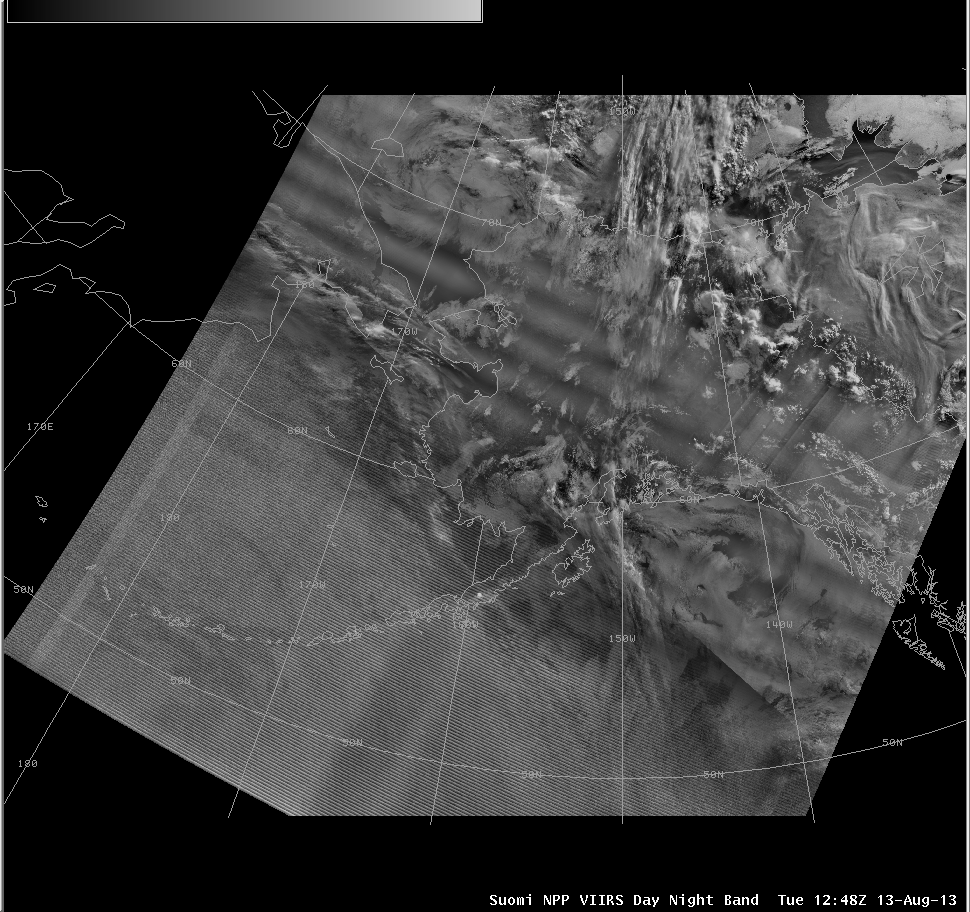
Here is a scene containing five VIIRS DNB granules over Alaska near 12:50 UTC on 13 August 2013. This image was created by linearly scaling the radiance values (which range from 1.4×10⁻³ to 7.3×10⁻¹⁰ W cm-2 sr-1) as a number from 0 to 255:

DNB with linear scaling
VIIRS DNB image taken 12:48 UTC 13 August 2013. This image uses linear scaling of the radiance values.

The top edge of the image is on the day side of the Earth, while the bottom is on the night side. The linear scaling only shows detail on the day side, even though the DNB can detect what’s on the night side.

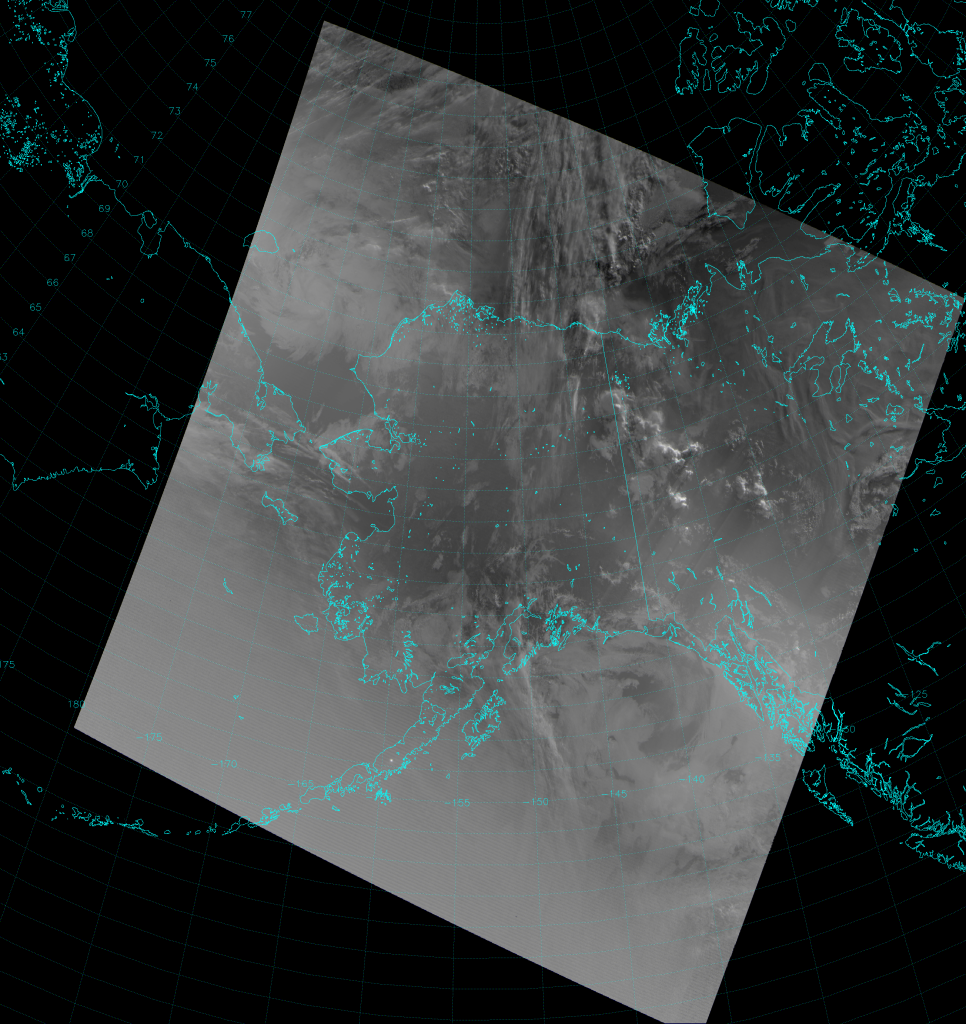
Taking the base-10 logarithm of the radiance values (now dealing with a scale from -2.3 to -9.1) brings out the detail in the twilight areas, but causes saturation on the day side of the image and the night side still looks dark:

DNB with logarithmic scaling
VIIRS DNB image taken 12:48 UTC 13 August 2013. This image uses logarithmic scaling of the radiance values.

By the way, if you follow my other blog, you might be surprised to find out you only need to click on these images once to get to the full resolution version. I should probably mention that these images show the full width of the VIIRS swath, but have been reduced in resolution by a factor of two.

Here is a more sophisticated attempt at scaling, which uses information about the solar zenith angle to divide the region into strips, and each strip has it’s own scaling designed to be continuous from strip to strip:

DNB example using solar zenith angle-dependent scaling.
VIIRS DNB example from 12:48 UTC 13 August 2013. This image uses solar zenith angle-dependent scaling. Image courtesy of GINA.

This scaling allows you to see features on the day side, night side, and everywhere in between. But, see all the wave-like, broad ripples in the middle of the image? Those aren’t actually in the data – it’s a consequence of using this scaling method. The shorter wavelength ripples near the bottom of the image are caused by “striping” and “stray light”.

Striping occurs because the 16 detectors that make up the DNB may not all have the exact same sensitivity to light. In each scan (16 rows of pixels in the full resolution data), some rows of pixels appear brighter, because that particular detector is more sensitive to light than its neighbors. This was a problem particularly at low light levels, but a stray-light fix has been implemented and was put into operation on 20 August 2013 (a week after this image was taken) that should fix (or at least reduce) this.

Stray light is light that hits the detectors that isn’t coming from the Earth – it comes directly from the sun. This happens shortly after the satellite passes into the night side and shortly before it passes back into the day side of the Earth. Don’t worry, though. This was fixed along with the striping on 20 August 2013.

Now, what about those stripes that go from northeast to southwest (primarily over the Yukon Territory)? Are those some sort of artifact of the scaling method? Nope. Those are shadows cast by deep convective clouds near sunset – just like in this photo.

So, we’ve highlighted this problem with the DNB: how do you best display a 7-orders-of-magnitude change in value using only 256 colors? VIIRS already has the solution covered. It’s called the Near Constant Contrast product (often shortened to NCC).

The Near Constant Contrast product takes the radiance values observed by the DNB and coverts them into reflectance (also called albedo). Now, think about what it means to do this conversion. For most visible wavelength imagery, reflectance is relatively straight-forward to calculate. The satellite observes the reflected radiation, and we assume the incident radiation is all coming from the sun. (This is a good assumption during the daytime.) Calculating the incident solar radiation on each point on the Earth at a given time (and day of year, etc.) is considered a solved problem. But, what do we do at night?

At night, you have to take the moon into account. The NCC imagery uses a model of the sun and moon to calculate the incident radiation for all points on the Earth at all times of day, all days of the year, for all phases of the moon. Accounting for this variation in the incident radation reduces the range of values we need to display for scenes that cross the terminator. The problem that arises is that the DNB senses light from more than just the sun and moon. It can detect fires, city lights and auroras (among other things), which are sources of emitted light, not reflected light. These light sources can be 2-3 orders of magnitude brighter than the reflected component (particularly during a new moon). Nevertheless, the NCC product reduces the range of values we have to display from 7-8 orders of magnitude down to 2-3 orders of magnitude, and it produces images like this:

NCC image using logarithmic scaling
VIIRS NCC image taken 12:48 UTC 13 August 2013. This image uses logarithmic scaling.

This image was scaled using the base-10 logarithm of reflectance on a scale from -1.3 to 1.3 (roughly from 0.05 to 20 in the original reflectance units). The only loss of contrast occurs on the bottom of the image where stray light is contaminating the reflectance signal, and this has since been corrected for.

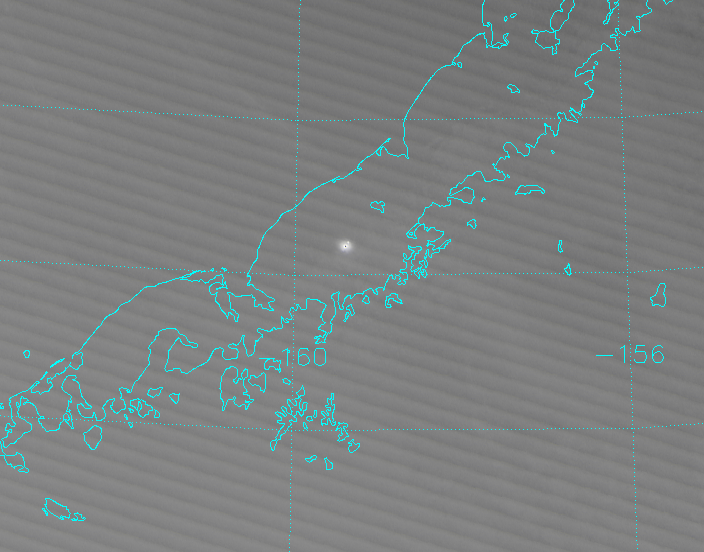
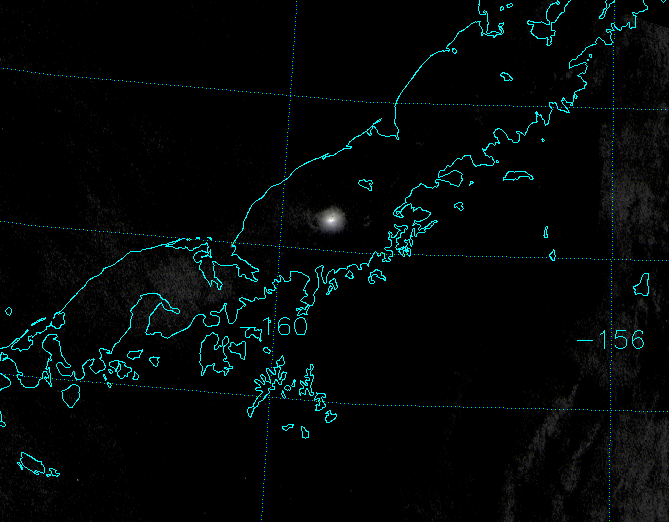
See that dot of light over the Alaska Peninsula? I’ll zoom in at full satellite resolution so you can get a better look:

VIIRS NCC image taken 12:52 UTC 13 August 2013. This is cropped and zoomed in from the previous image.

That’s light emitted by the molten-hot magma erupting from the Veniaminof volcano. The DNB (and its sister product, NCC) are sensitive enough to see glowing-hot lava all the way from outer space!

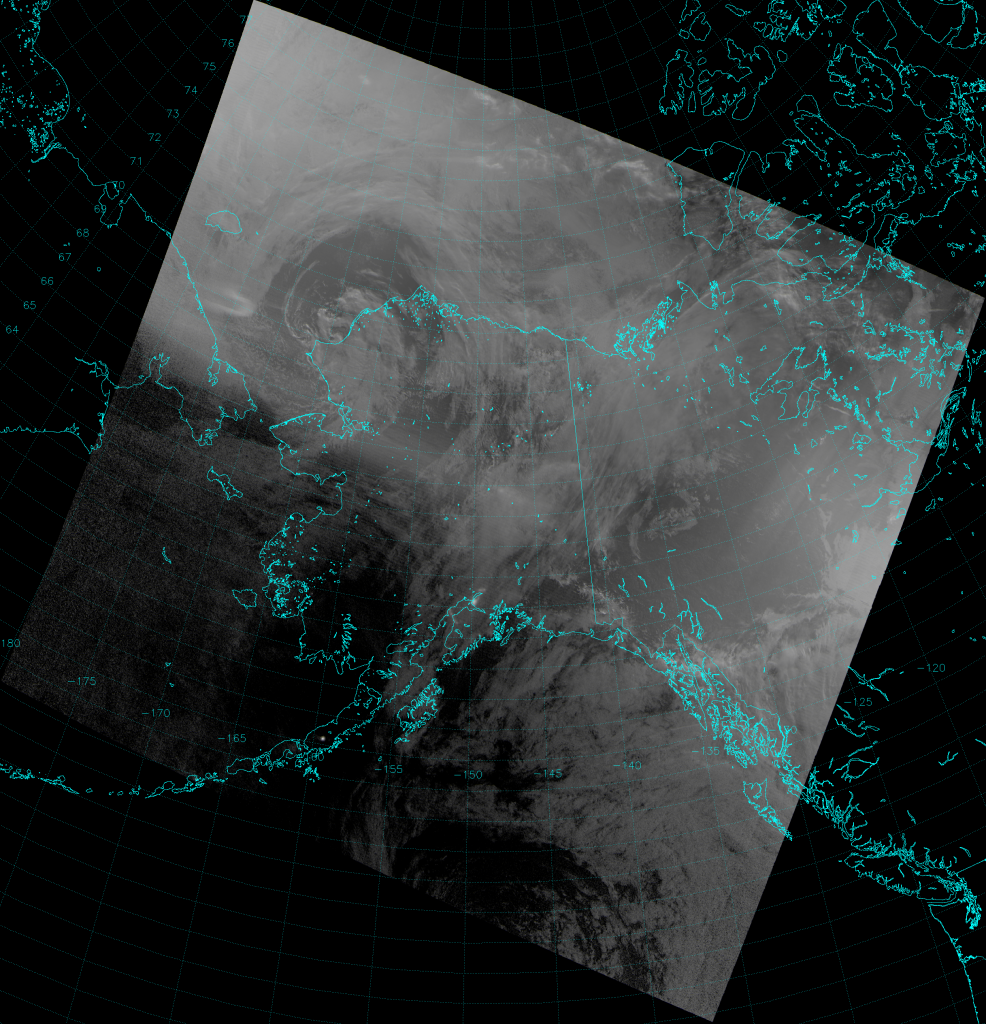
Want to know what it looks like with the stray light removed? Here’s an image from 30 August 2013 (about a week after the stray light correction became operational):

VIIRS NCC image, taken 12:30 UTC 30 August 2013
VIIRS NCC image taken 12:30 UTC 30 August 2013. This image uses logarithmic scaling.

The Veniaminof volcano is still erupting at this time (two weeks later!), and is really easy to see. Here it is at full resolution:

VIIRS NCC image taken 12:30 UTC 30 August 2013
VIIRS NCC image taken 12:30 UTC 30 August 2013. This is cropped and zoomed in from the previous image.

Depending on how the scaling is performed, NCC and DNB imagery is very similar for daytime and nighttime scenes, but it is the twilight and near-terminator scenes where the NCC product really shines.