When was the last time you heard anything about Paraguay? Nope – they weren’t in the World Cup, that was Uruguay. (Paraguay actually finished last out of all South American teams when it came to World Cup qualifying. Sorry to remind you, Paraguayans.) A quick perusal of the web indicates that the country has a history of isolationism, so it may not come as a surprise that news out of Paraguay is few and far between.
For you non-Paraguayans in the audience: How many of you knew that Paraguay was the richest nation in South America in the mid-1800’s? Paraguay held that title right up to the point that they tried to keep Brazilian influence out of a civil war in Uruguay. That kick-started the War of the Triple Alliance, which ultimately killed more than half the population of Paraguay, strengthened Argentina as a nation, and is credited with bringing about the end of slavery in Brazil. Paraguay has never been the same since. It became the poorest country in the region – a title it has held, pretty much, through today. This has caused one reporter to say (in one of the links above) that, to Paraguayans, success is a prelude to danger.
When the national football team scores, “it makes us nervous and we panic.”
But, this isn’t a metaphor for the title of this post. The title refers to Paraguay: the River (Rio Paraguay), which has brought the worst flooding in decades to Paraguay: the Country, and displaced more than 200,000 Paraguayans. Flooding has also occurred on the Rio Paraná – the second longest river in South America – and has impacted hundreds of thousands of people in Brazil and Argentina. (You won’t get me to say that it has impacted a Brazilian people – because that is an awful, overused joke. Oh, wait. Ignore what I said I wasn’t going to say.)
Just look at what the flooding did to Iguazú Falls – one of the wonders of the world you never heard about – on the border between Argentina and Brazil:
http://www.youtube.com/watch?v=76XfV42YvBI
There are more pictures of the flooding at the falls here. Iguazú Falls is located at the head of a narrow canyon called the Devil’s Throat, where water levels were reported to be 16 meters (52 feet) above normal! It is said that this is the worst flooding since 1982-1983. (That flood event killed 170 people.)
As shown before, VIIRS is capable of viewing widespread flooding. So, what does VIIRS tell us about this flood? As it turns out, both the “Natural Color” RGB composite and the “True Color” RGB composite provide unique information, so let’s take a closer look.
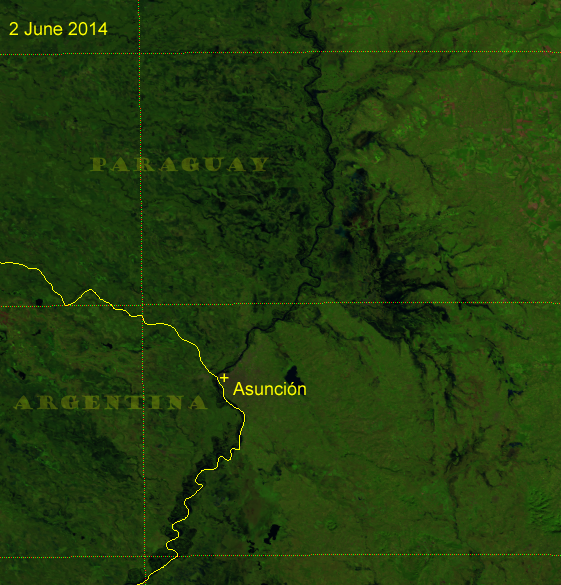
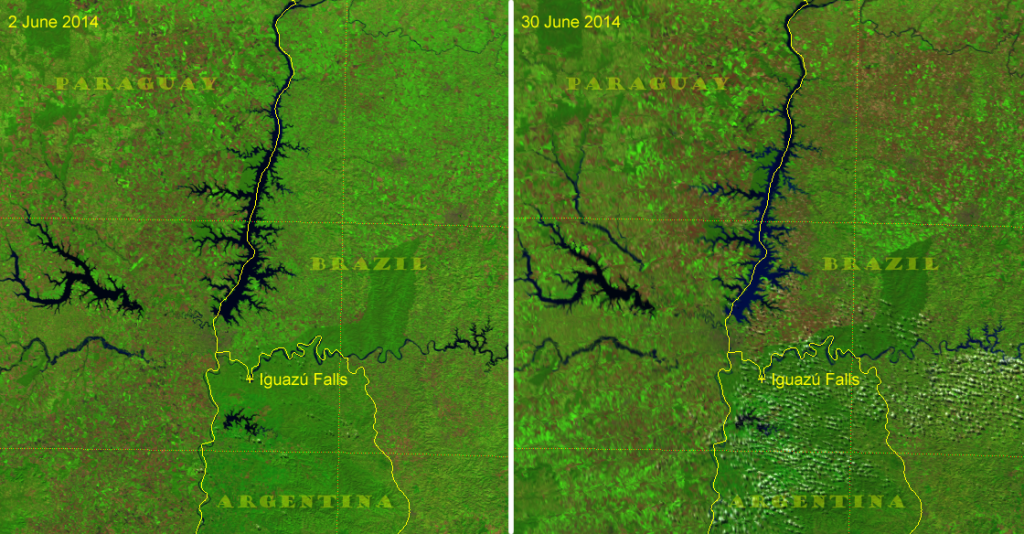
If you simply want to see where the water is, look no further than the “Natural Color” RGB composite. The “Natural Color” composite uses the high-resolution bands I-01 [0.64 µm; blue], I-02 [0.87 µm; green] and I-03 [1.61 µm; red]. At these wavelengths, water is not very reflective (it absorbs more than it reflects). So, with low reflectivity in all three channels, water appears nearly black. That allows one to identify water easily. Here’s a Natural Color image from a clear day before the worst of the flooding began (2 June 2014):

That’s Paraguay in the center of the image. Rio Paraguay is the north-south river that cuts Paraguay in half (OK, maybe 60-40). Rio Paraná is the big river that marks the eastern border between Paraguay and Argentina, and turns south after acquiring Rio Paraguay’s water. (Look for the big reservoir in the upper-right, and follow that river down to the bottom of the image, left of center.) Make sure you click on the image, then on the “3298 x 2345” link below the banner to see the full resolution version. Compare that with a similar image from the only clear day at the end of the month (30 June 2014):

At first glance, the most obvious flooding occurred along the Paraná in Argentina. But flooding is noticeable along the Rio Paraguay if we zoom in for a closer look. Here’s a “before” (2 June) and “after” (30 June) overlay for the area around Paraguay’s capital city, Asunción:
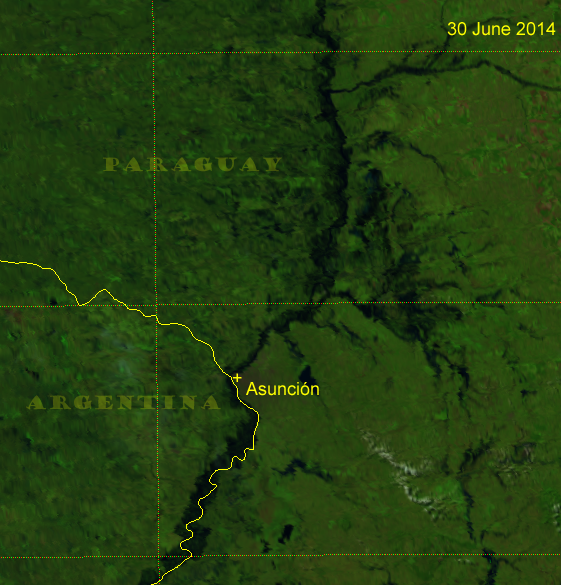
Drag the vertical bar over the images from left to right to compare the two. (If this “before/after” trick doesn’t work for you, try refreshing the page. It may not work at all if you’re using Google Chrome.) The flooding you see here near Asunción was associated with only a 2 m (6 ft) water rise.
Something interesting happens when we focus in on the Paraná at the Itaipú Reservoir, just upstream from Rio Iguazú:
After the flooding, the reservoir no longer appears black. This is because the flooding washed an awful lot of dirt into the water. And it really shows up in the “True Color” RGB composite:
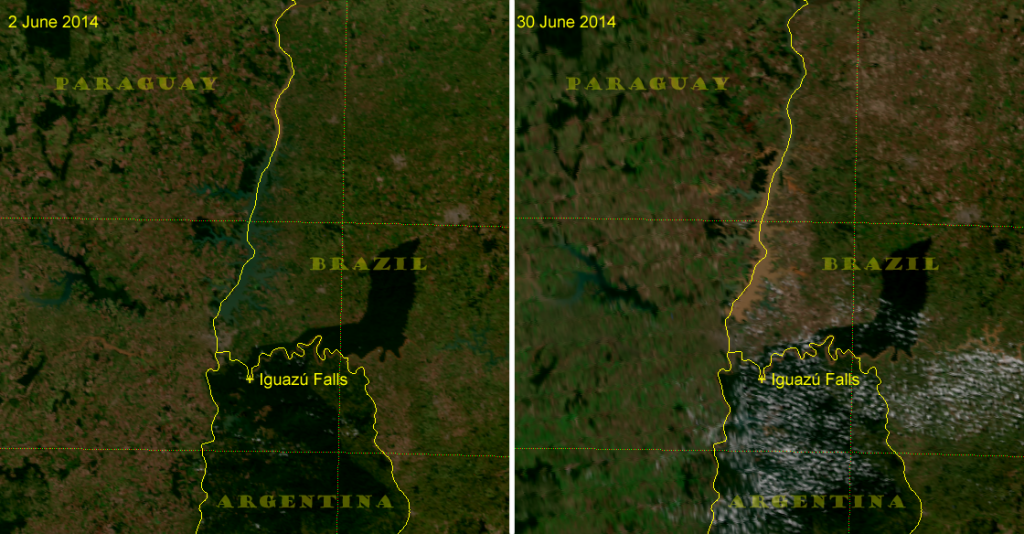
The water appears more turquoise before the flood, and brown after the flood. This is because the True Color composite represents the true color of the objects in the image. It is made from channels in the blue [0.48 µm; M-3], green [0.55 µm; M-4] and red [0.67 µm; M-5] portions of the visible spectrum. Take a look again at the Iguazú Falls video above and notice how brown the water is. The True Color images capture this. The reason the water appears blue and not black in the Natural Color composite is that there is enough sediment in the water to make it reflective at 0.64 µm (the blue component of the image). The longer wavelengths in the green and red components are not sensitive to the sediment, whereas the shorter wavelengths in the True Color components are very sensitive to sediment. (This is the basis for Ocean Color retrievals.)
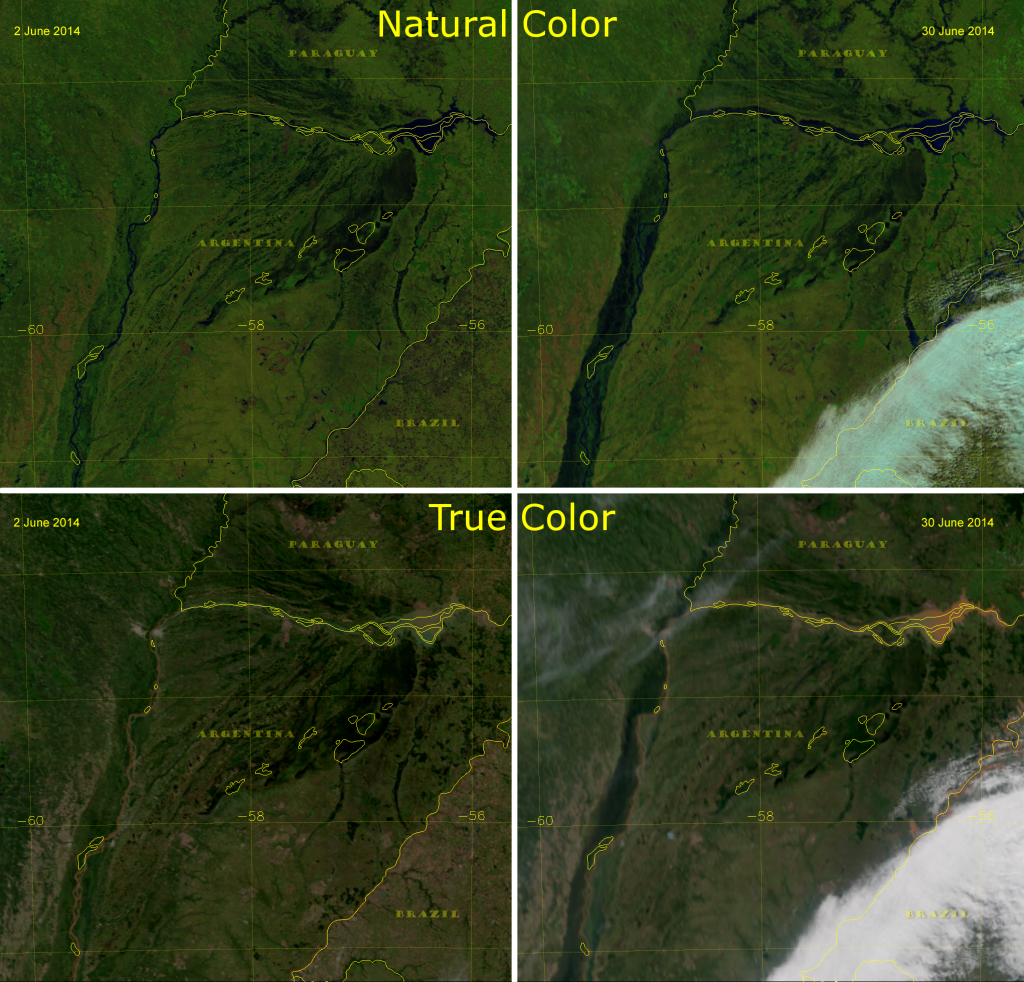
If we focus in on the Rio Paraná near where it meets the Rio Paraguay, we can see clearly that the Natural Color highlights where the flood waters are, and the True Color highlights the sediment in that water:
Unfortunately, floods on the Paraguay and Paraná rivers are not uncommon, as a resident of Asunción explains:
BONUS: The NOAA/STAR JPSS group has put together a website on the flooding in Paraguay that features my Natural Color images along with a number of other VIIRS-based products that are being developed for flood detection. A lot of people from a number of different research groups played a part in this!