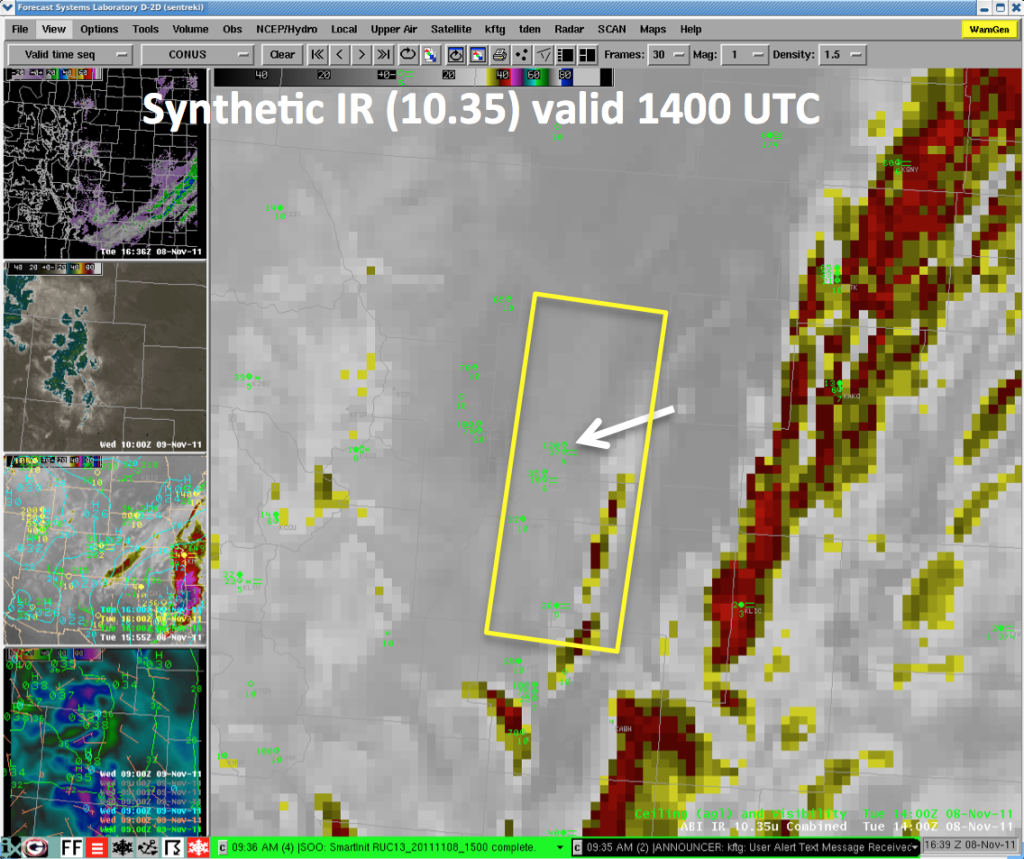
This example from the Boulder WFO shows the use of synthetic IR imagery generated from the 4-km horizontal grid resolution NSSL WRF model for predicting an area of fog and low clouds near the Denver International Airport (DIA) on the morning of 8 November 2011. The WRF model is run daily at 0000 UTC, and the ultimate purpose of the synthetic imagery is to use it to replicate realistic-looking imagery that represents some of the new GOES-R channels. Building forecaster confidence in using this new type of output from a numerical model as well as the ability of the model post-processing to generate realistic-looking satellite imagery is an important step towards ultimately using synthetic imagery to test GOES-R products.
In this case the synthetic IR imagery replicates the 10.35 micron channel, the current GOES IR channel available on AWIPS. Boulder WFO forecaster Scott Entrekin, the local Aviation Focal Point, saved this example. He noticed that the synthetic IR imagery predicted an area of low clouds that threatened DIA for the hours near sunrise into the morning. DIA of course is an important Terminal Aviation Forecast (TAF) site, and this type of output is potentially useful for helping with such forecasts.

Figure 1a. Synthetic IR image over eastern Colorado (the Boulder WFO forecast area is within the area covered by this image) valid at 1400 UTC. The rectangle encloses some of the low cloud area and is included for reference to Figure 1b, which is at a different scale. Aviation observations are shown from the METAR sites (key: cloud fraction shown next to ceiling height (AGL, in hundreds of feet), weather on the right side, and visibility (in miles) the bottom number), and the arrow points to DIA.

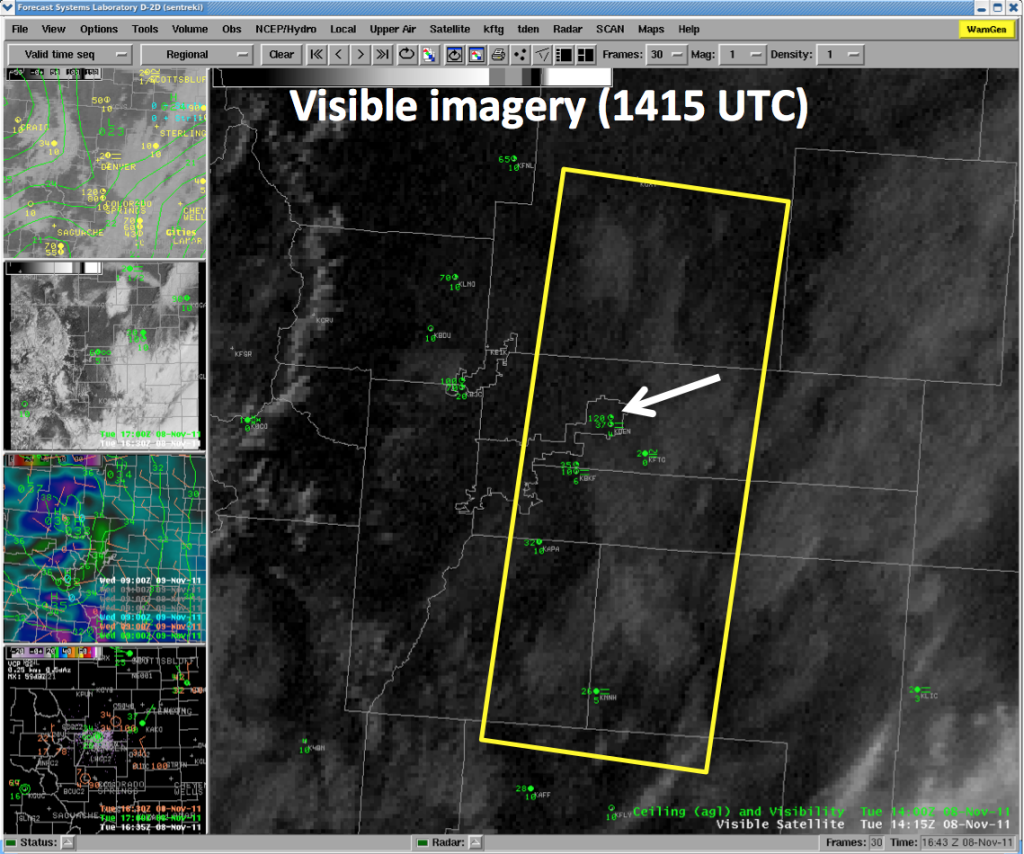
Figure 1b. Actual visible image for 1415 UTC with aviation observations. The rectangle shown covers approximately the same area as in Fig. 1a. Scott noted how the low clouds seen in the visible imagery compare favorably to the low clouds indicated in the synthetic imagery shown in Figure 1a. At 1400 UTC DIA was near the western edge of the area of low clouds and fog, and reported a 4 mile visibility in light fog, with scattered clouds at 3700 and 12000 feet.

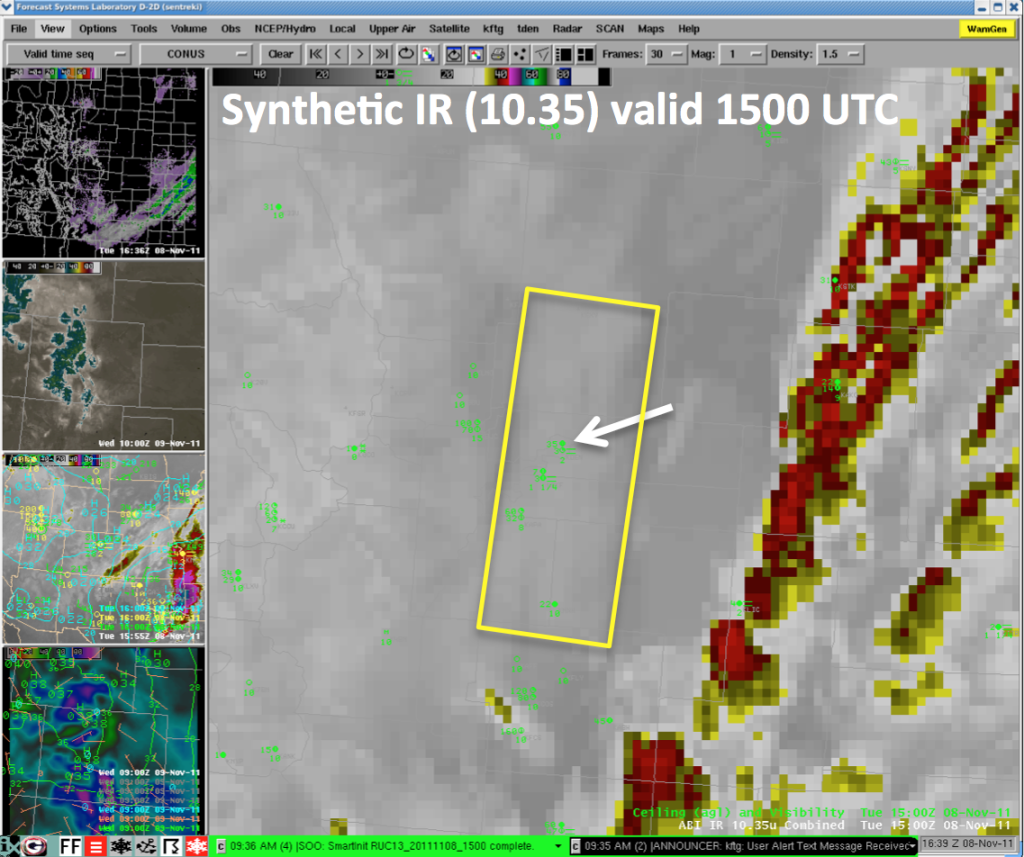
Figure 2a. Synthetic IR image as in Figure 1a but for 1500 UTC.

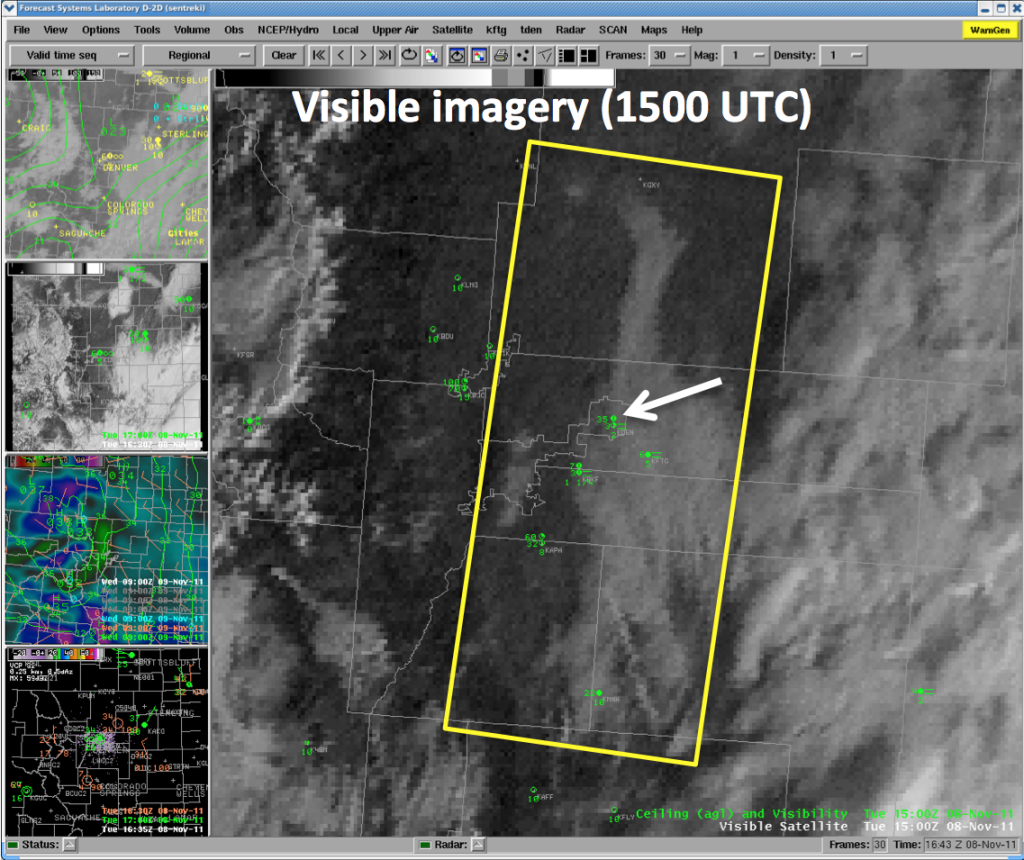
Figure 2b. Visible image for 1500 UTC with aviation observations. As in the comparison at 1400 UTC, the low cloud area depicted in the synthetic imagery compares favorably to low cloud and fog area seen in the visible imagery, although certainly not a perfect forecast. Conditions at DIA had deteriorated by 1500 UTC, with 2 mile visibility in fog, scattered clouds at 300 feet, and broken clouds at 3500 feet.

