
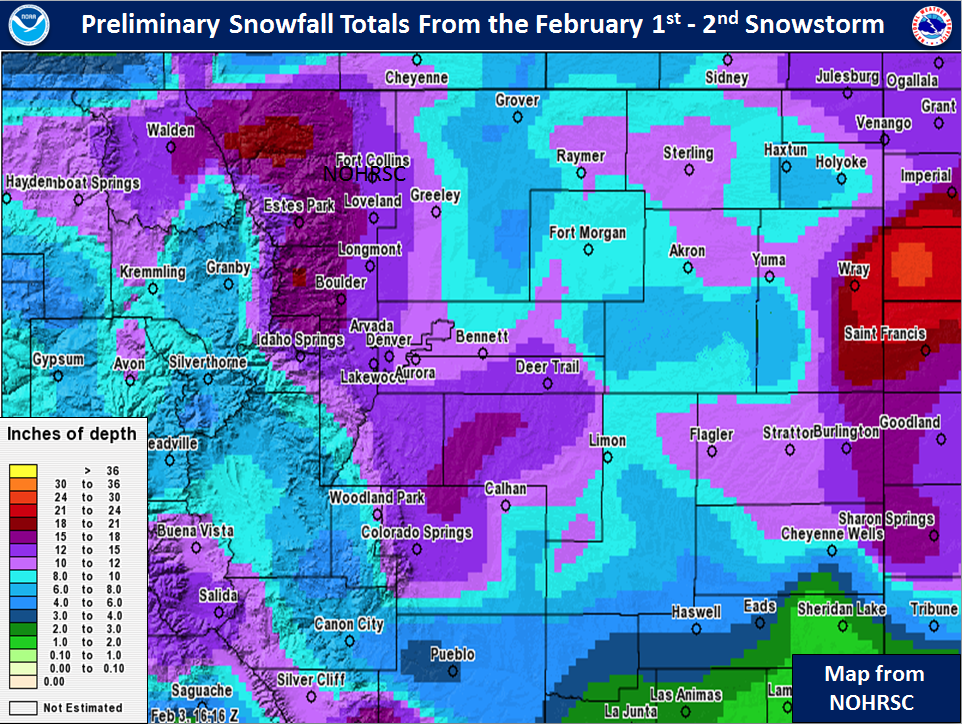
A winter storm that passed through Colorado on 1-2 February 2016 resulted in significant snowfall over northern / northeast Colorado:
One of the key aspects of this extra-tropical cyclone was the development of a warm conveyor belt (Harrold 1973). The 4-km NSSL WRF-ARW synthetic water vapor imagery from the 0000 UTC 1 February run valid 1800 UTC 1 Feb to 0600 UTC 2 Feb:
forecasts what appears to be a warm conveyor belt (WCB) by around 0100 UTC 2 Feb, highlighted here:
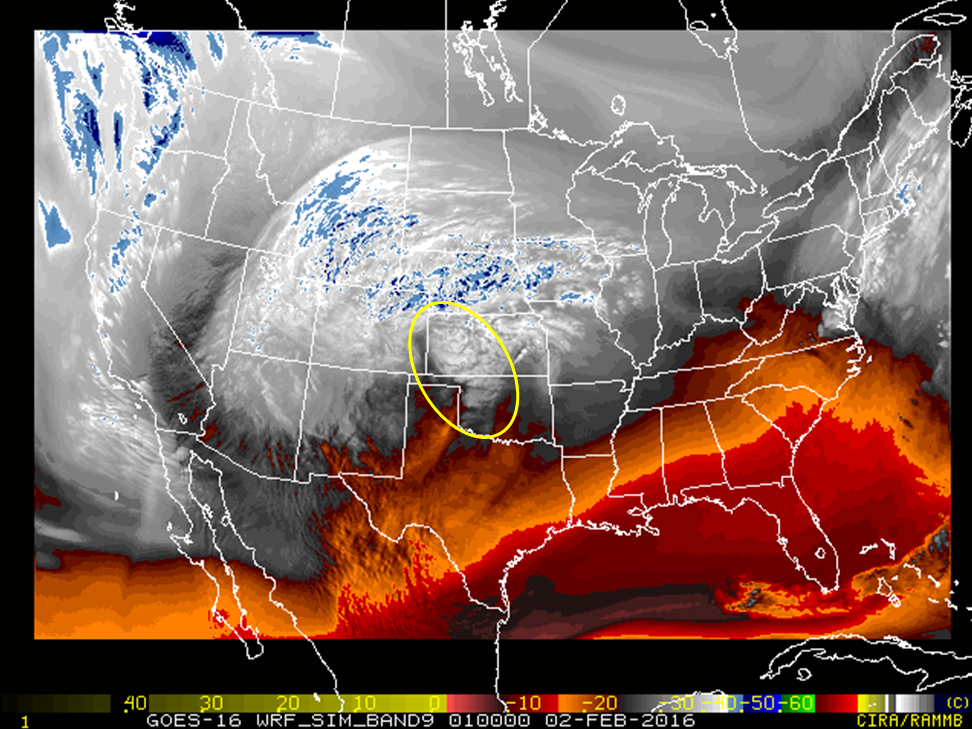
Keep in mind, one the of the limitations of the synthetic water vapor imagery from the NSSL WRF is that that areal coverage of cold cloud tops tends to be underdone due to the microphysics scheme of this model run. Interpretation should focus on the feature of interest (the WCB) rather than the specific cloud top temperatures to compare with GOES.
For this event, GOES-14 Super Rapid Scan Operations for GOES-R (SRSOR) was in effect, meaning that 1-minute imagery was collected (Schmit et al. 2015). This is in preparation for GOES-R (scheduled for launch in October 2016) since 1-minute imagery will be available much more frequently for significant weather events.
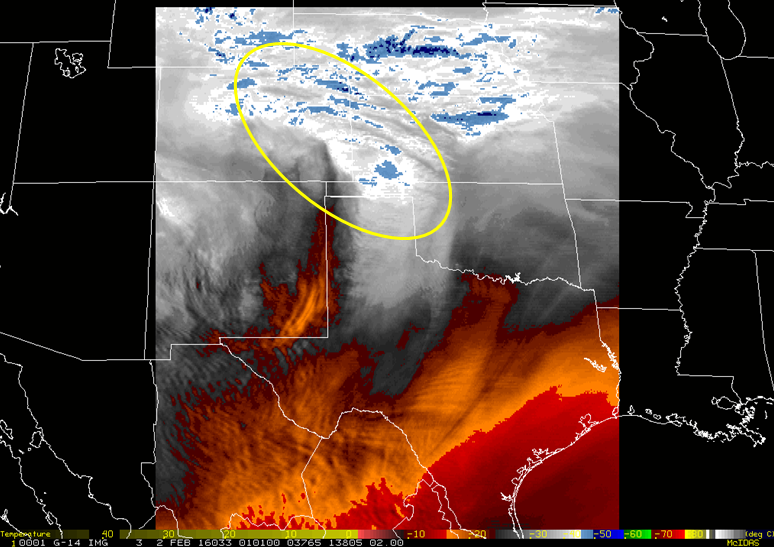
In the 1-minute GOES-14 water vapor imagery between 1800 UTC 1 Feb to 0100 UTC 2 Feb:
We can see the development of the WCB over eastern Colorado and western Kansas, consolidating by the end of the loop:
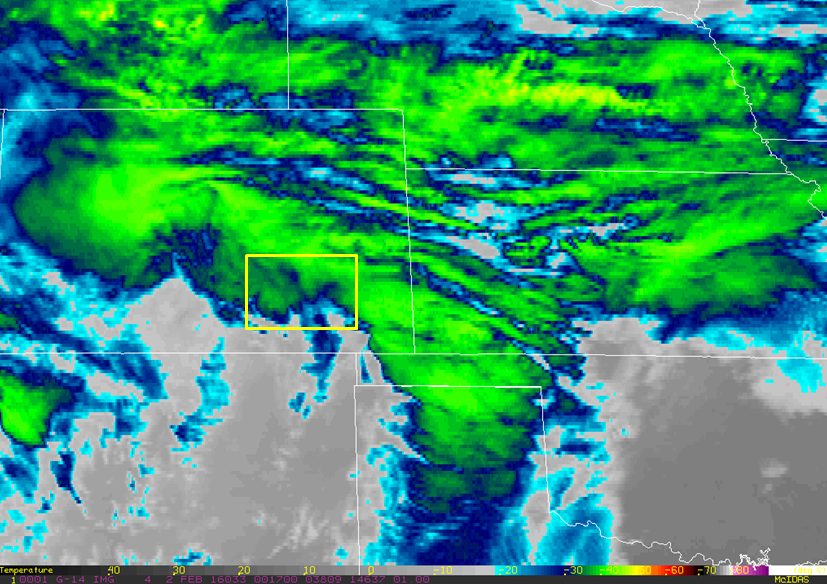
Next, lets consider the perspective of the GOES-IR (10.7 um) 1-minute imagery:
Note the rapid expansion in areal coverage of colder cloud tops from the Texas panhandle / western Oklahoma into western Kansas then curving cyclonically westward into Colorado. This is the WCB of interest. Where is the surface low in this loop? Note the highlighted region below:
In the animation near this time, we observe a circulation with colder brightness temperatures just after 2300 UTC followed by what appears to be a deformation zone that is quasi-stationary. The surface low is slightly southeast of this zone that is quasi-stationary.
Later, between 0100 and 0600 UTC 2 Feb:
We see the continued expansion of colder cloud tops associated with the WCB that is impacting Colorado. During this period, snowfall rates increased as a result of this WCB as heavy snow impacted much of northern / northeast Colorado.
We observe a number of interesting features in the 1-minute imagery that we normally would not see under routine GOES scanning at 15 minute intervals. For example, note the highlighted region in the following two images at 0300 and 0418 UTC:
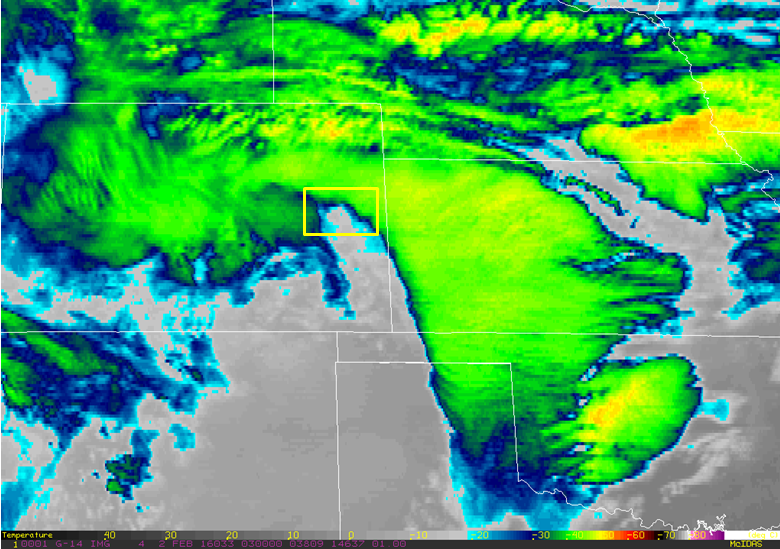
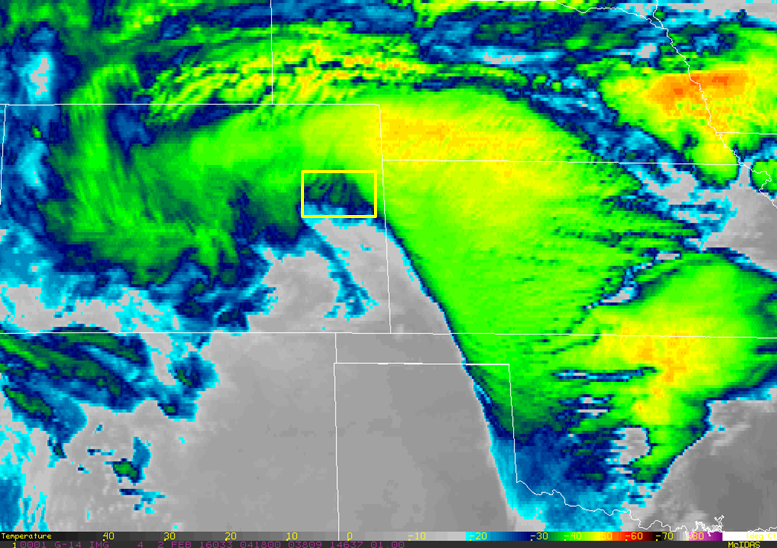
Closer inspection of the animated imagery during the time period shows the development of transverse bands along the western edge of the WCB (which has a well defined limiting streamline).
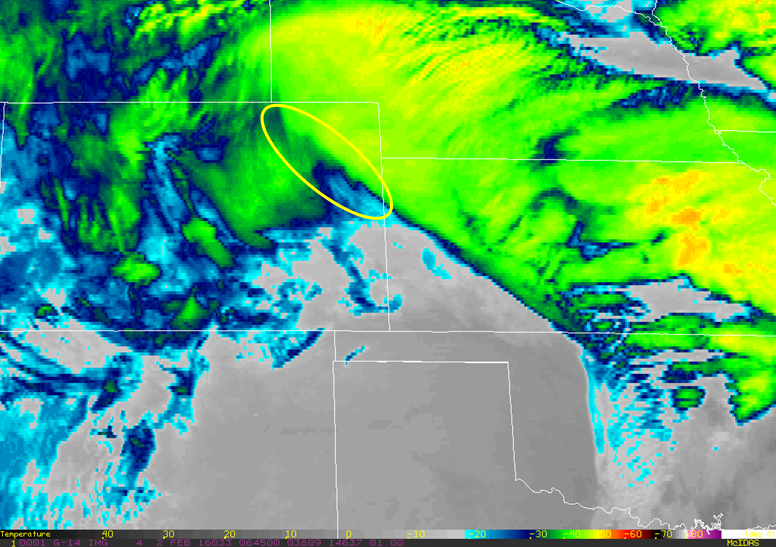
Moving on to the next time period of IR imagery:
We see a number of gravity waves along the edge of the WCB that appear and disappear over short-time scales, for example, note the highlighted region at 0645 UTC:
1-minute imagery from this winter storm illustrates one of the reasons why GOES-R will be a “game changer”. The high temporal resolution imagery will show features that were not sampled adequately to be observable under current/past temporal resolution. Since some of these features have not been seen before, there will be an opportunity for research into these new features to understand what we are observing, and more importantly, potential applications for use in operational meteorology. Another consideration is the 1-minute imagery latency on AWIPS will be approximately 1-minute, much greater than currently available for GOES RSO (Rapid Scan Operations), this impacts how much more effectively the data could be used operationally.
For completeness, analyze the 1-minute water vapor imagery for the remainder of the event. What additional features do you see?
How does the development of the WCB relate to the increase in snowfall rates as observed from the NESDIS Snowfall rate product retrieved from polar orbiting satellites?
References:
Harrold, T.W. 1973: Mechanisms influencing the distribution of precipitation within baoclinic disturbances. Q.J.R. Meteorol. Soc., 99, 232-251.
Schmit, T.J., and Coauthors, 2015: Rapid Refresh Information of Significant Events: Preparing Users for the Next Generation of Geostationary Operational Satellites. Bull. Amer. Meteor. Soc., 96, 561–576.