
The extensive outbreak of severe weather on Sunday 27 April (see SPC plot of reports below in Figure 1) made headlines with many destructive tornadoes. A strong cold front associated with an intense low lifting out of the Rockies led to the large outbreak (Figure 2 shows the low at 1200 UTC Monday morning 28 April). Meanwhile very strong winds behind the front produced a large area of blowing dust across the Southern Plains. In this blog entry we will take a look at this dust area through some satellite products designed to highlight blowing dust.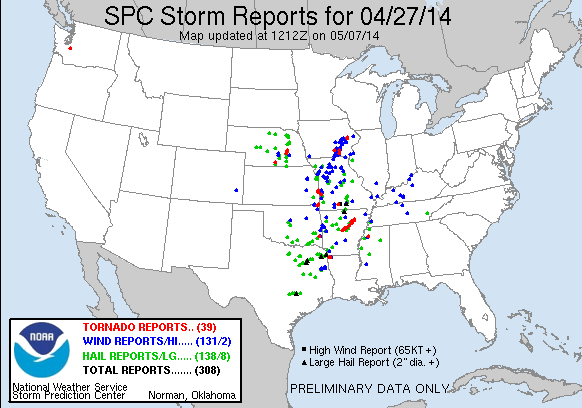
Figure 1. Plot of severe weather reports from the Storm Prediction Center for 27 April.

Figure 2. Surface mslp analysis with fronts at 1200 UTC on Monday 28 April.
First a comparison is made between how the dust storm looked on Sunday afternoon on GOES visible imagery currently on AWIPS and imagery from about the same time from the Suomi/NPP (Polar orbiting) satellite with the VIIRS instrumentation. The products from the Suomi/NPP satellite represent the type of imagery that will be available at high spatial and temporal resolution when the GOES-R satellite is launched. For now the spatial resolution is high (1 km) but the temporal resolution is low, with 2 times that can be shown using VIIRS for this case, one at 1859 UTC and the other at 2038 UTC. Similar looking imagery is also available from the MODIS Aqua and Terra Polar orbiting satellites, but is not shown here as the image swaths are at about the same time.
Images for the first time are shown in Figures 3-5. Figure 3 shows how the dust appears in AWIPS for a GOES visible image at 1852 UTC, overlaid with METAR observations from 1900 UTC. Gusty (30 mph or greater gusts) southwest winds prevail across much of Kansas and Oklahoma, with even strong winds farther west across the High Plains, lifting plumes of dust. Visible imagery from VIIRS with a true color background at 1857 UTC is shown in Figure 4. So much dust is lifted that it looks like we can easily see the plumes in the AWIPS image, and somewhat better in the true color image. It is not always so easy to see where the dust plumes are, however, so CIRA has developed a product that highlights the dust in a pink color (a similar version uses yellow for the dust), and this image is shown also for 1857 UTC in Figure 5. You can find more information on this (and other CIRA GOES-R Proving Ground products) product at http://rammb.cira.colostate.edu/research/goes-r/proving_ground/cira_product_list/ The dust plumes are easily seen in this image, which represents a product that will be available in the GOES-R era. Notice how the southernmost plume of dust in the Texas Panhandle is easily seen, whereas it is not so obvious in the GOES visible image shown in Figure 3.
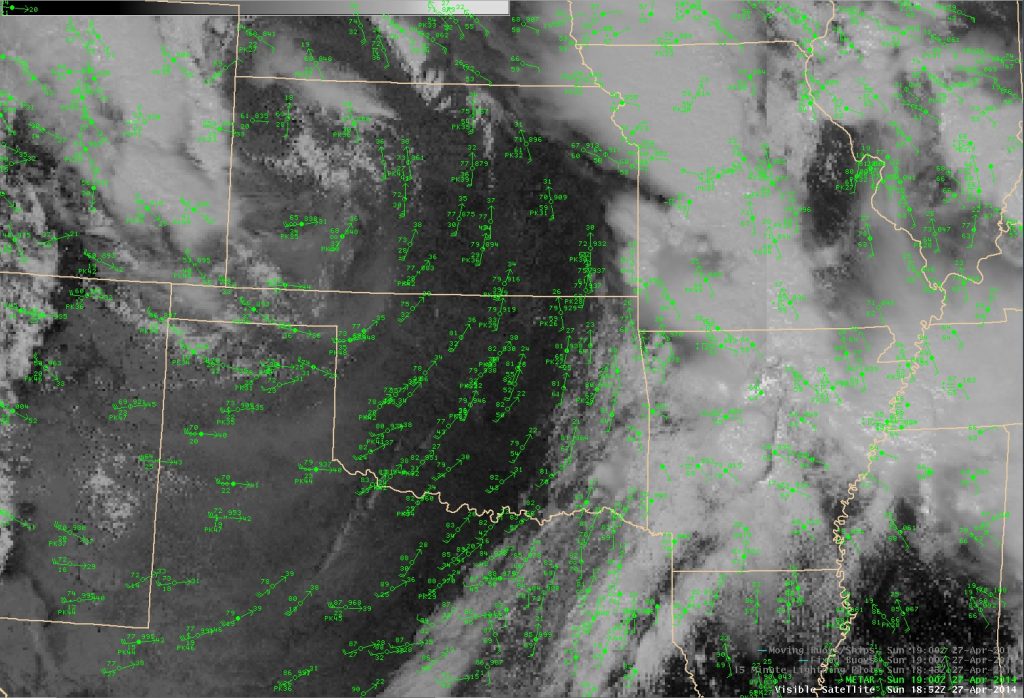
Figure 3. GOES visible image at 1852 UTC on 27 April from AWIPS overlaid with 1900 UTC observations.
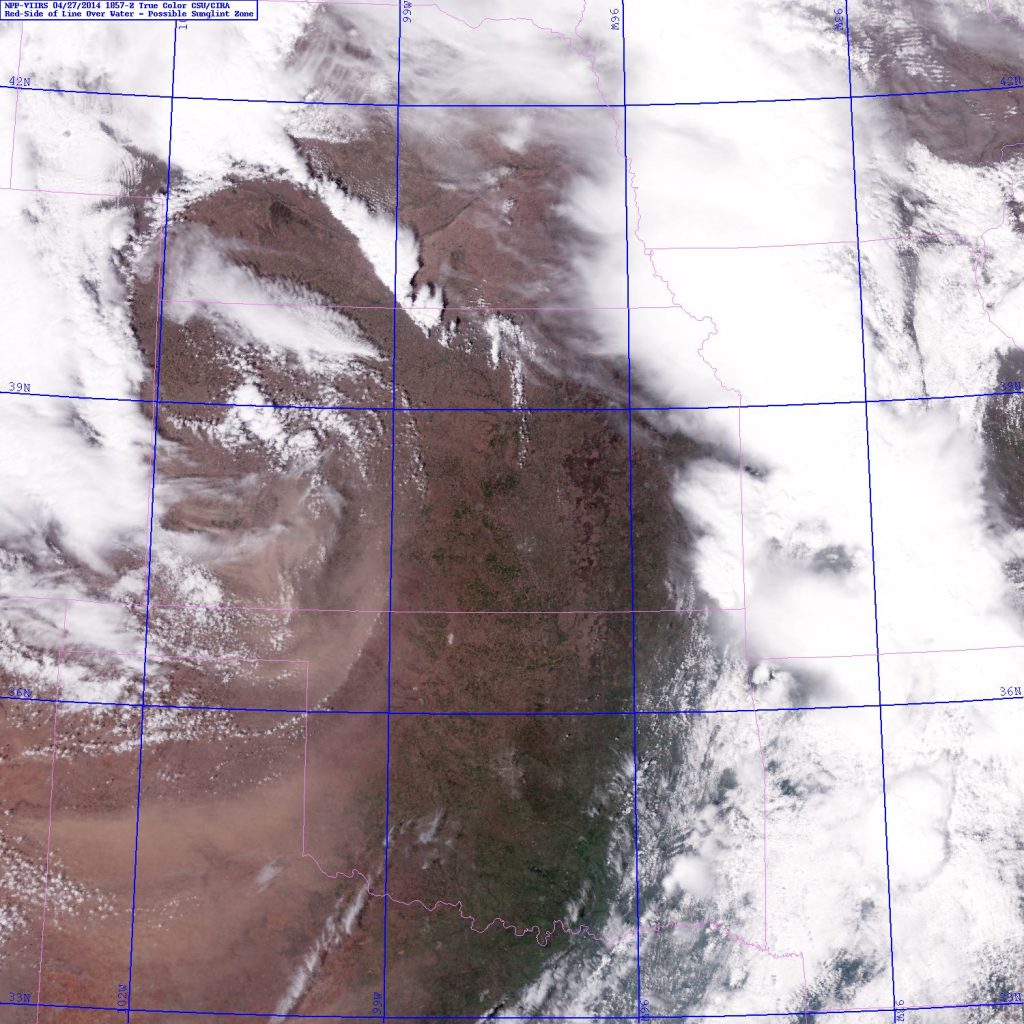
Figure 4. Suomi/NPP True Color image at 1857 UTC on 27 April.
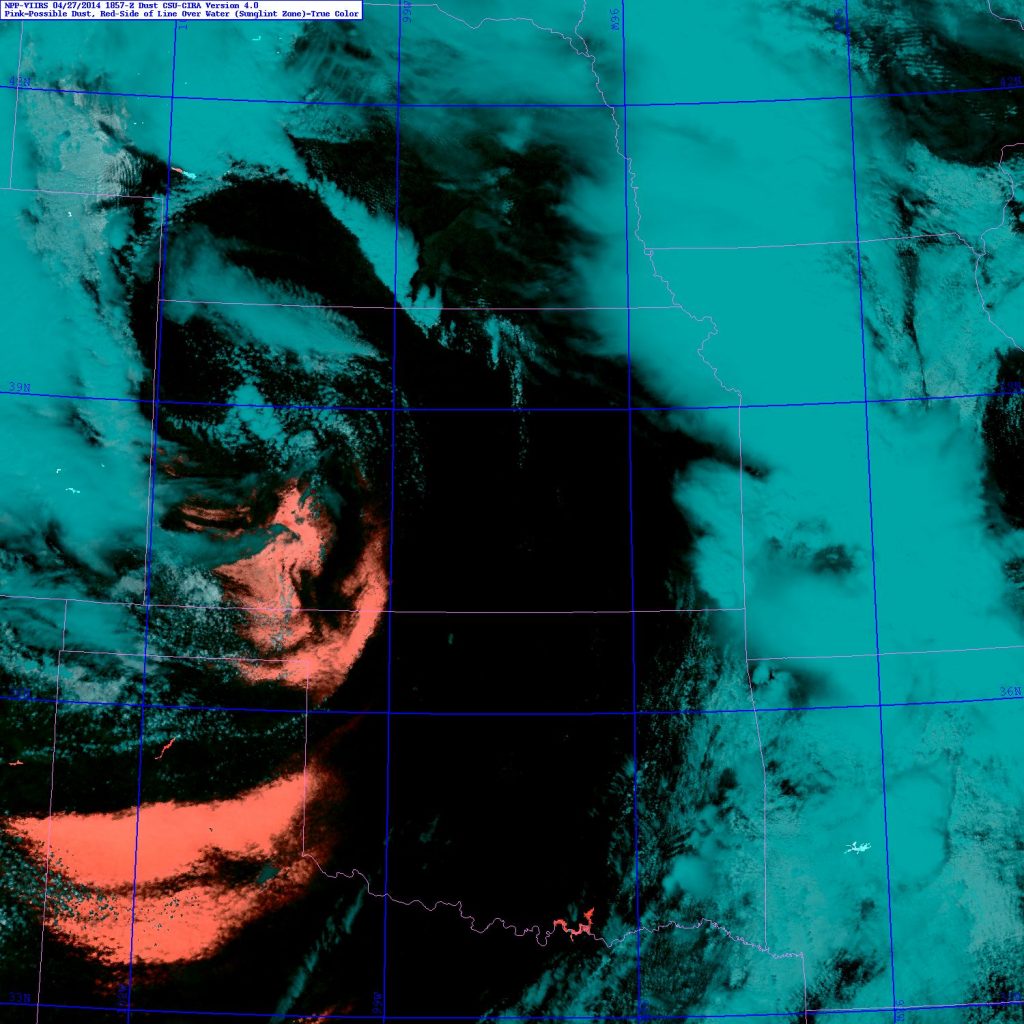
Figure 5. CIRA Suomi/NPP Pink dust image at 1857 UTC.
The same images are shown for the second available time (2038 UTC). Strong southwest winds continue to prevail across the Southern Plains, with areas of dust discernible in the visible image (Figure 6) across west-central KS and OK and the TX Panhandle. The Suomi/NPP images are shown for two areas in Figures 7-10. For the northern area most of the dust shown in the Pink dust image can also be seen in the two visible images. Figures 9 and 10 show the area farther to the south, and here the CIRA dust product in Figure 10 highlights dust plumes farther to the south that are not so obvious in the AWIPS visible imagery or even the true color image, showing the potential value of such a product.

Figure 6. GOES visible image from AWIPS at 2038 UTC on 27 April with 2000 UTC observations
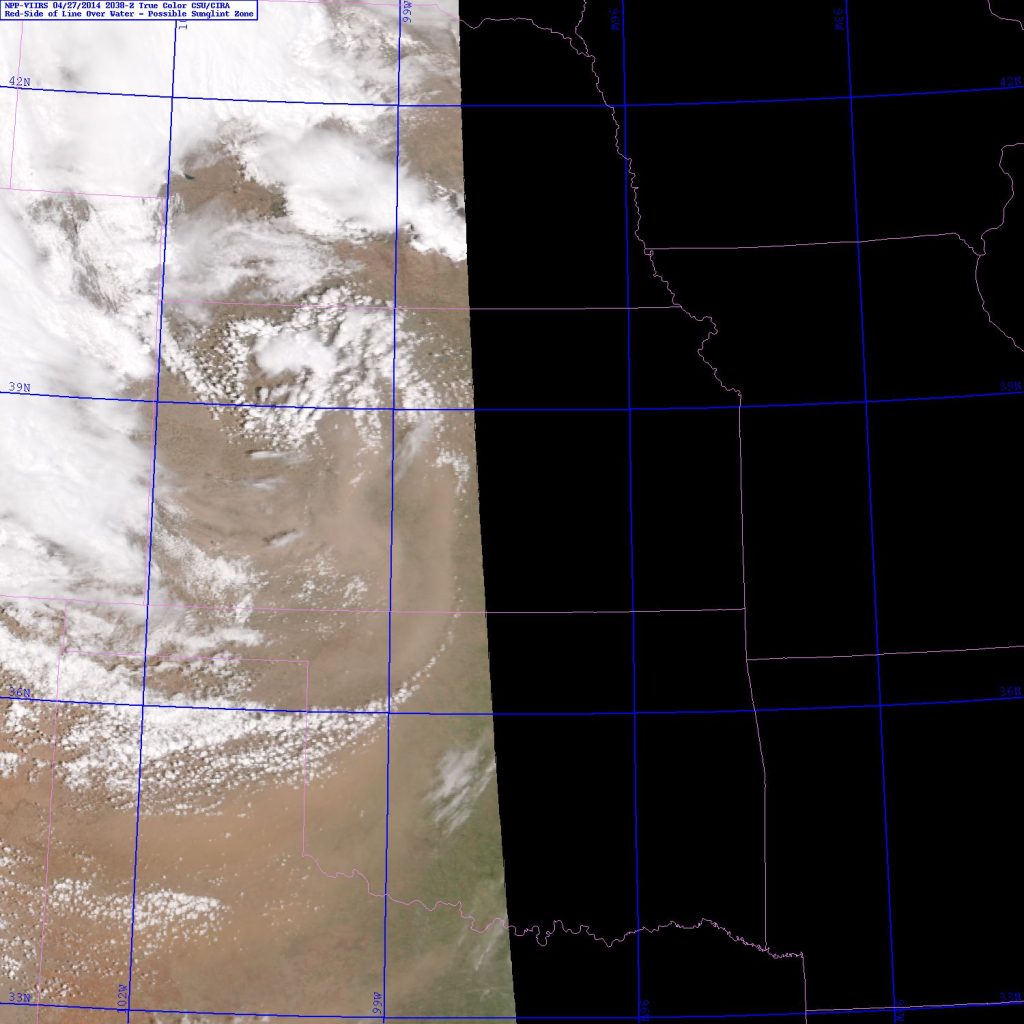
Figure 7. Suomi/NPP True Color image at 2038 UTC.
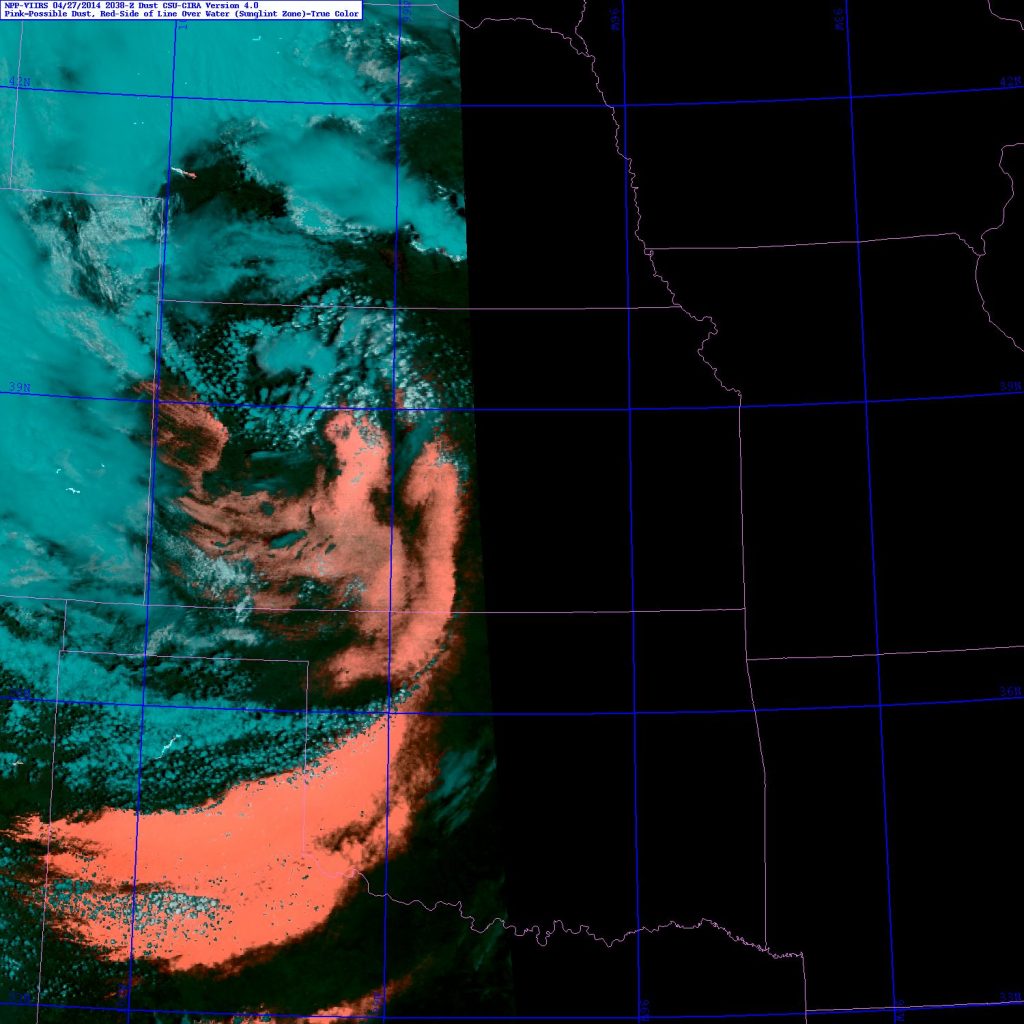
Figure 8. CIRA Suomi/NPP Pink Dust image at 2038 UTC over the same area.
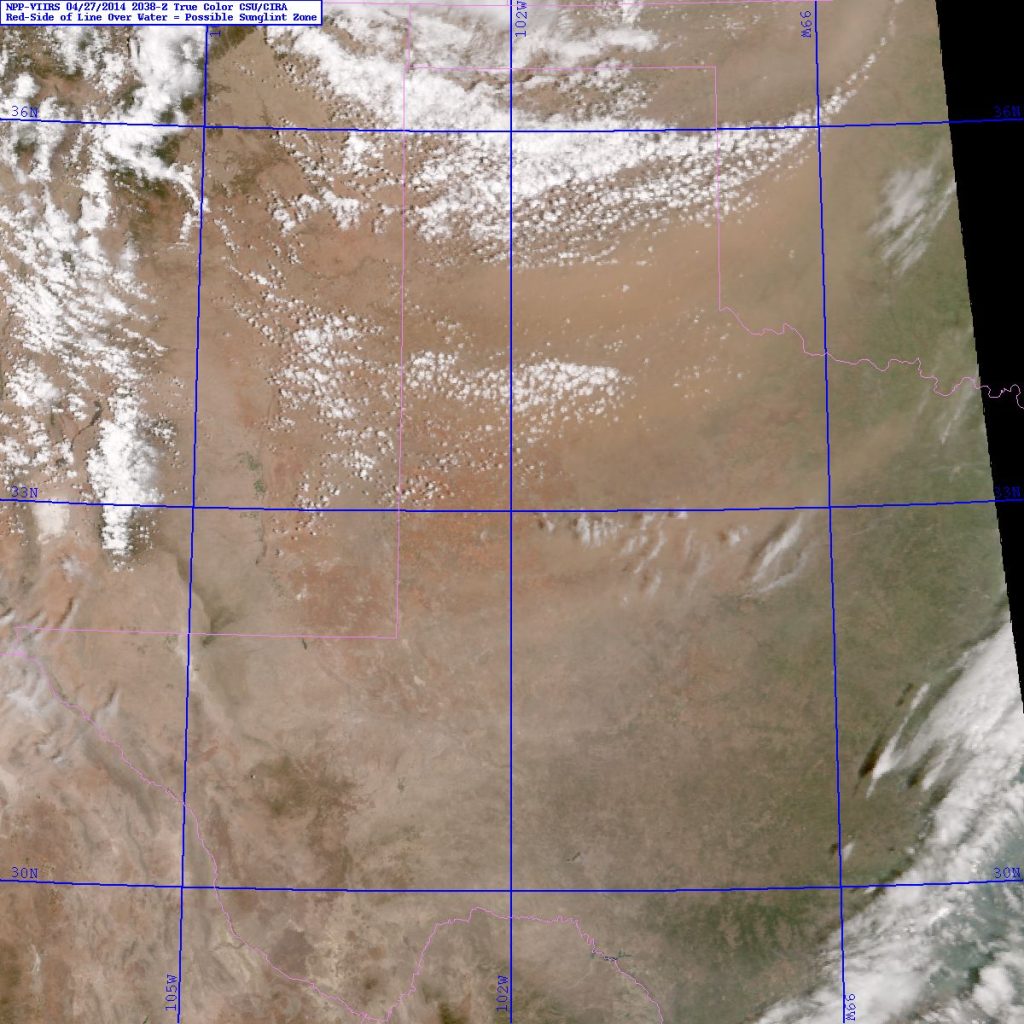
Figure 9. Suomi/NPP True Color image at 2038 UTC but zoomed in on the Texas Panhandle.
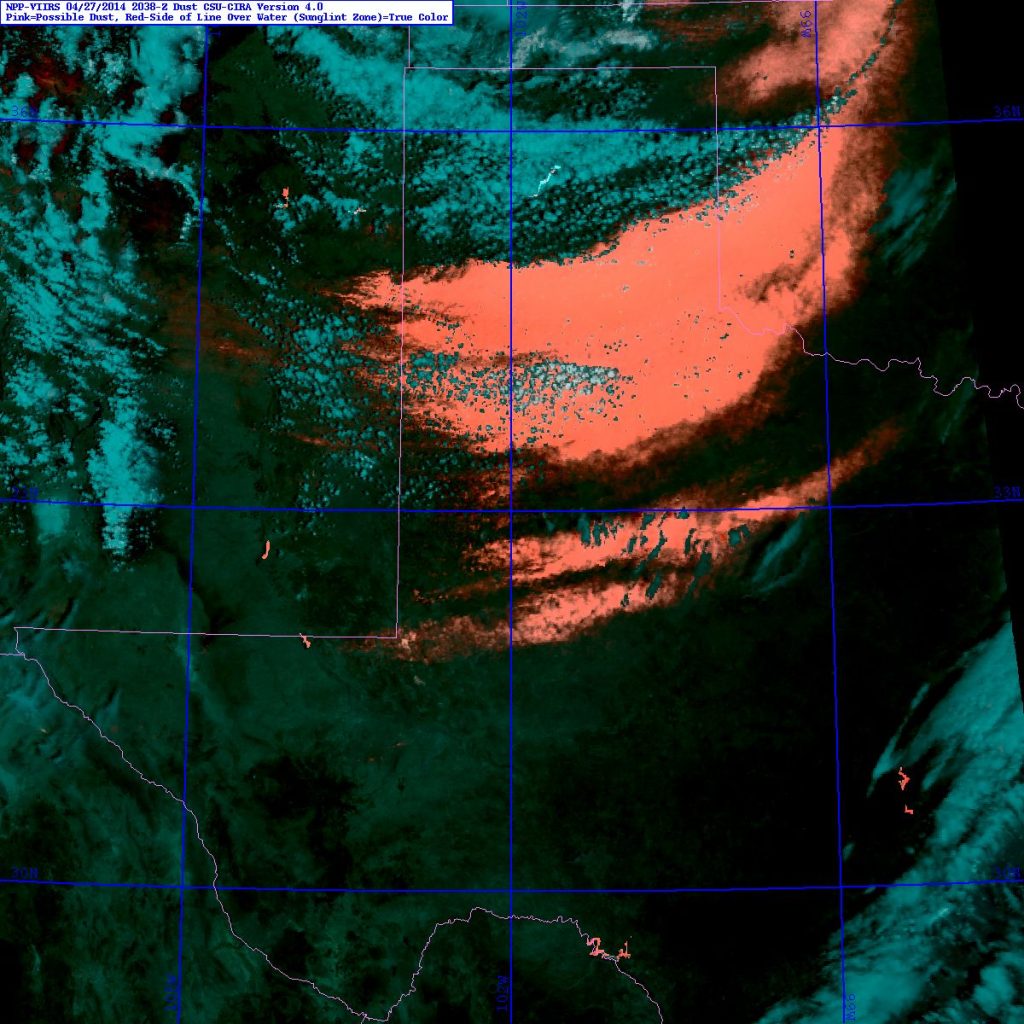
Figure 10. CIRA Suomi/NPP Pink Dust image at 2038 UTC also over the Texas Panhandle.
Dust discrimination imagery can also be created from the current GOES satellites through the GOES sounder, with a split window technique that uses the 10.7 um (more-transparent longwave) and 12.0 um (less-transparent longwave) infrared window bands. The resolution is much lower (10 km) than for images from the Polar satellites (and from what will be available in the GOES-R era), but there is the advantage of hourly time resolution, which means one can loop the imagery. Further description of the imagery and how it is made can be found on the link to the CIRA products page given earlier. An example of this GOES-based dust imagery produced by CIRA for this case is shown in Figure 11 for 1846 UTC and in Figure 12 at 2046 UTC on 27 April. Dust appears as yellow or red (red for thicker dust).
Figure 11. CIRA GOES-based dust product at 1846 UTC on 27 April.
Figure 12. CIRA GOES-based dust product at 2046 UTC on 27 April.
The imagery shown in this example is available now for display in AWIPS I or II; contact CIRA if interested.