The GOES-16 data posted on this page are preliminary, non-operational data and are undergoing testing. Users bear all responsibility for inspecting the data prior to use and for the manner in which the data are utilized.
By Ed Szoke and Dan Bikos
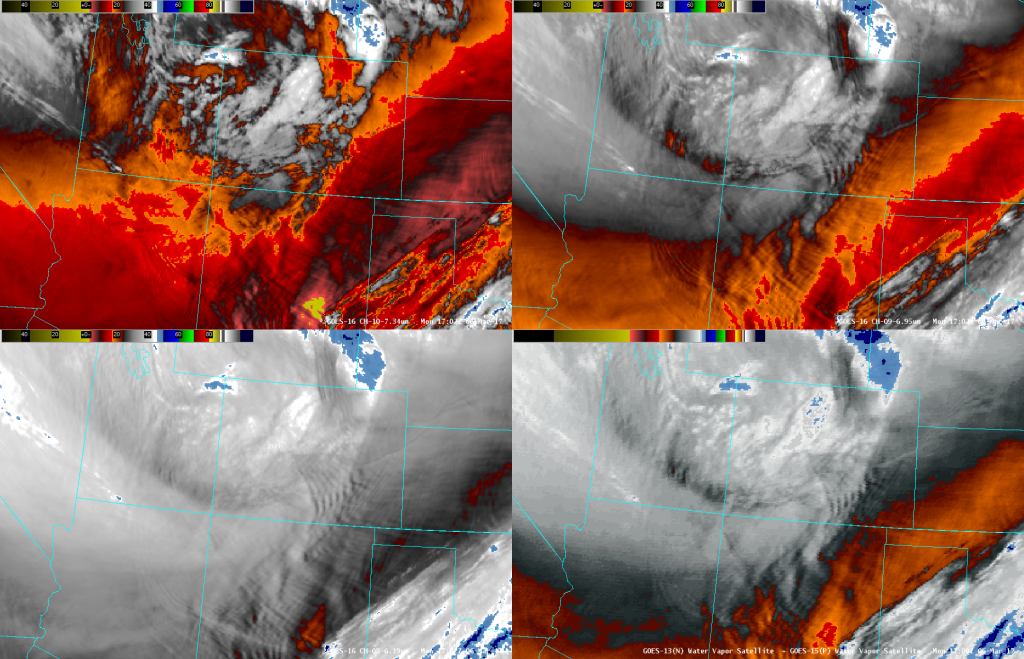
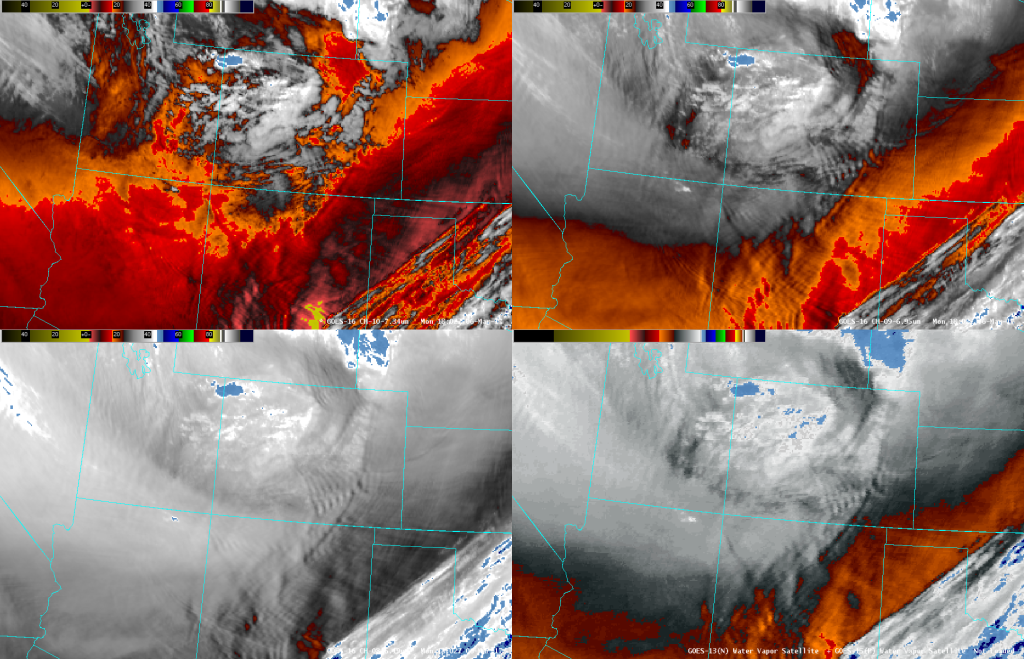
Among the 16 channels on GOES-16 are 3 water vapor channels at 2 km resolution (at NADIR), compared to a single water vapor channel on GOES-15 or GOES-13 at 4 km resolution. Here we take a look at the new water vapor imagery over and near Colorado from Monday 6 March 2017. We’ll use the 4-panel display from AWIPS II at the Boulder NWS WFO, with the lower resolution GOES single water vapor image in the lower right panel. A series of three 4-panel images is shown below at hourly intervals from 1702 UTC to 1902 UTC.
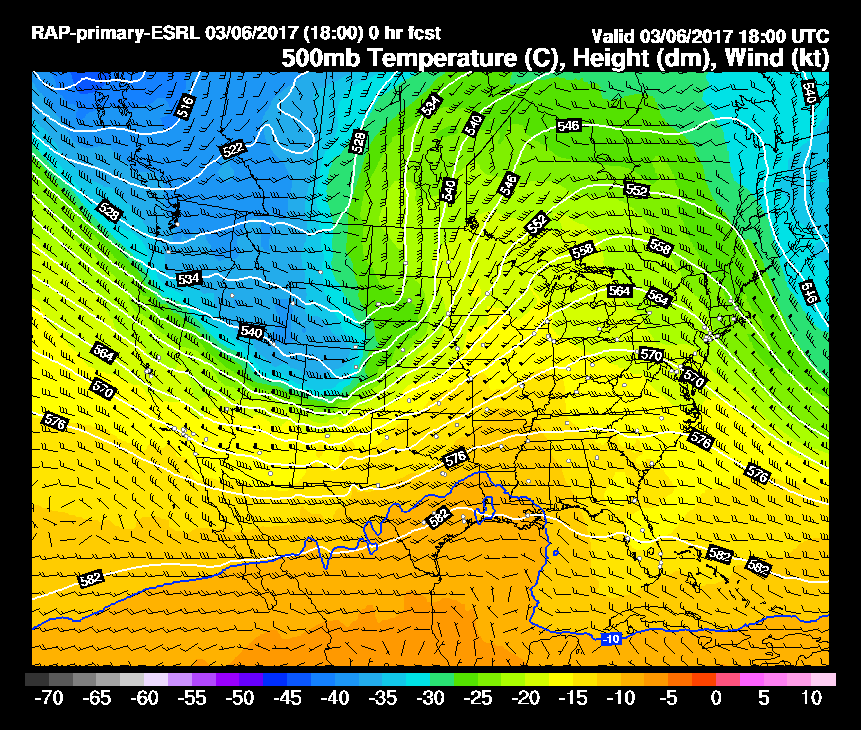
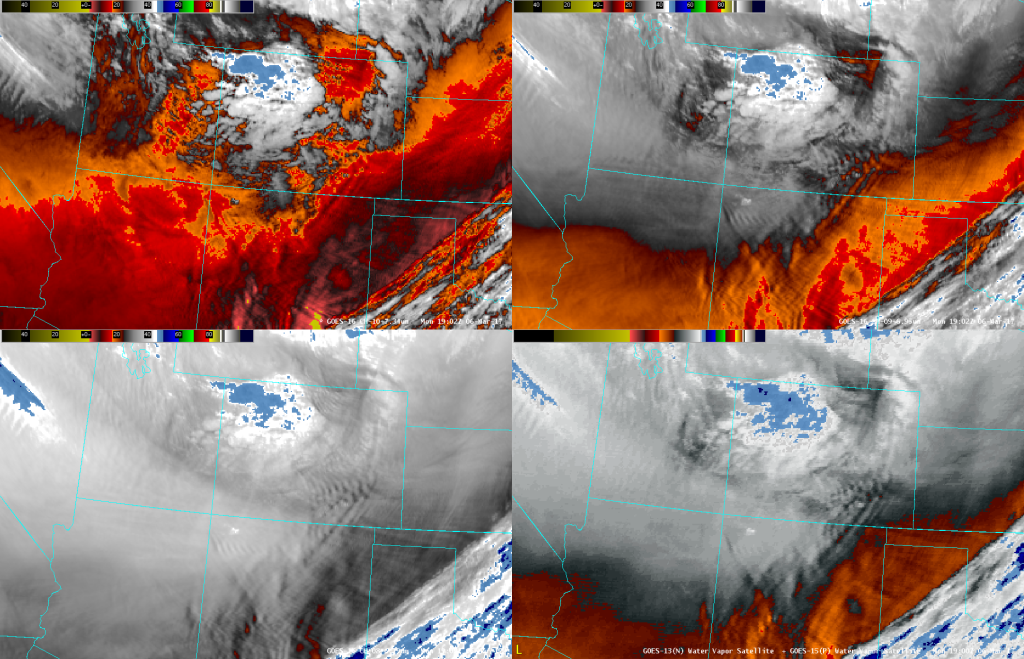 In the 4-panels above, GOES-16 water vapor imagery is channel 10 (7.34 µm), in the upper left panel, channel 9 (6.95 µm) in the upper right panel, channel 8 (6.19 µm) in the lower left panel, and from GOES-15 the single water vapor band at 6.5 µm. A strong trough is passing across Colorado at this time, as seen in the RAP analysis of 500 mb heights and temperature below. Many wave features on various scales are seen in all the imagery, but more distinctly with the higher resolution GOES-16 imagery.
Notice the very cold air near and just behind the trough axis, which passes across the Front Range of Colorado at this time (1800 UTC). The strong warming/drying signature in northeastern Colorado is just south of the center of a smaller scale circulation associated with the overall trough. Meanwhile farther to the east very warm brightness temperatures are seen across the Texas Panhandle into southwestern Kansas behind the dryline that had pushed eastward. Plunging dewpoints and strong SW winds in this area created very high fire danger and numerous grassland fires developed and rapidly spread, as detailed in other blogs accessible through the VISIT homepage.
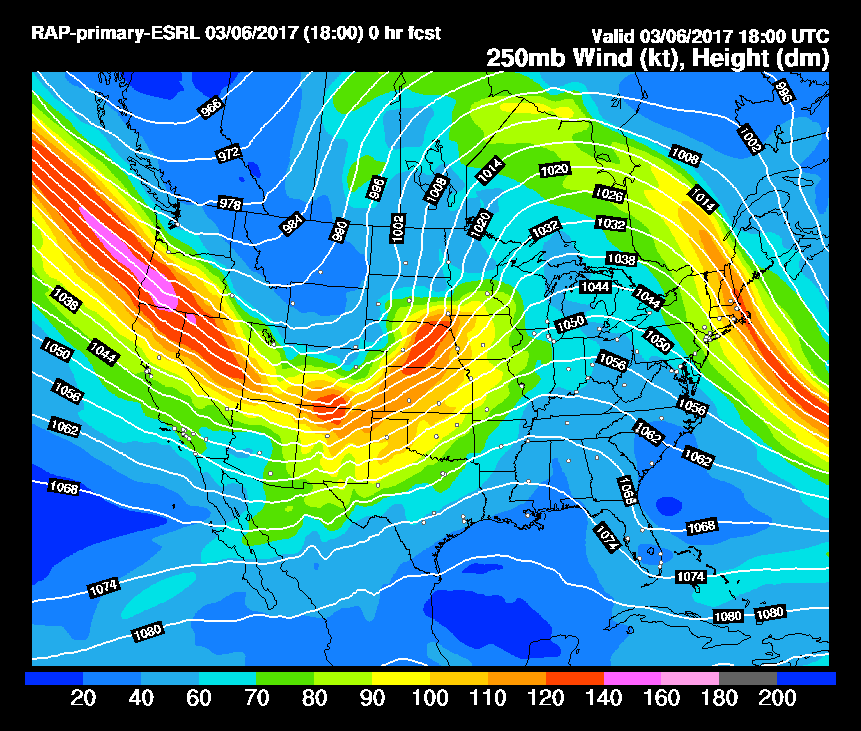
A strong jet accompanied this trough, as seen in the 250 mb wind speed and height analysis below.
One interesting feature that was quite evident in the looping of the imagery was a small piece of cirrus that moved rapidly from the UT/AZ border at 17z to just WSW of the 4-corners point at 1802z to ESE of the 4-corners by the last image at 1902z. We can see this feature also in this loop of the channel 10 (7.34 µm) lower-level water vapor imagery from GOES-16: http://rammb.cira.colostate.edu/templates/loop_directory.asp?data_folder=training/visit/loops/6mar17/B10&loop_speed_ms=80
At first we were a bit unsure as to what this was since it was moving so much faster than all the other cloud features. In the higher resolution imagery it was quite apparent as a small “blocky” feature. Using the tracking feature on AWIPS II we estimated a motion of ~115 kts, which is in agreement with the wind speed analysis of the stronger winds with the leading edge of the main jet.
Some of the other bands from GOES-16 were used to confirm the feature was a patch of cirrus. These are shown in the 4-panel below.
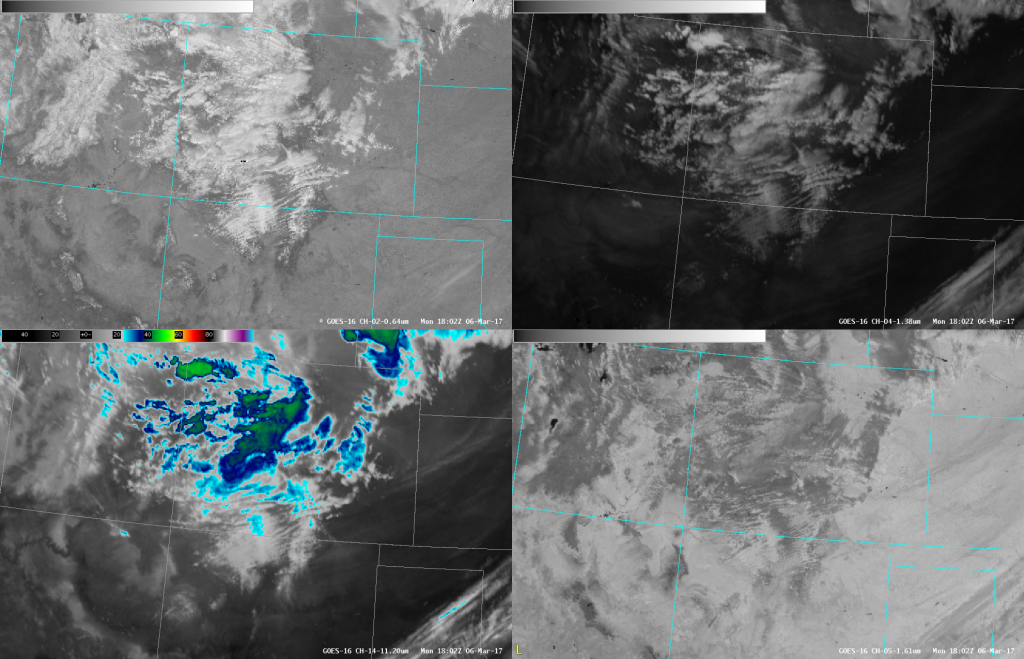
This 4-panel from AWIPS II has 4 different channels from GOES-16: channel 2 V=visible imagery (0.64 µm), in the upper left panel, the channel 4 “Cirrus band” (1.38 µm) in the upper right panel, channel 14 IR (11.2 µm) in the lower left panel, and channel 5 “snow/ice” imagery (1.61 µm) in the lower right panel. In this case the cirrus and IR channels most clearly define the patch of cloudiness as an ice cloud.

