
-
Synthetic imagery for the 3 Dec 2013 fog/low cloud case
The previous blog entry discussed CIRA satellite imagery that can be useful in highlighting fog and low clouds. These images utilize existing satellite imagery to create images that try to replicate those that will be available in the GOES-R era. Another method to create GOES-R type imagery is to use output from a high-resolution model […]
-
Widespread Fog East of the Rockies – 3 Dec 2013
Widespread fog and low clouds covered much of the nation east of the Rockies 0n the morning of 3 Dec in the moist airmass ahead of the developing western storm and strong cold front that has since pushed south. Dense Fog Advisories were issued by many WFOs, as seen in the graphic below valid at […]
-
October 17, 2012 fog over Wisconsin
Let’s examine the synthetic low cloud / fog product from the 4-km NSSL WRF-ARW model. This is from the 0000 UTC 17 October run valid between 0900-1600 UTC 17 October: http://rammb.cira.colostate.edu/templates/loop_directory.asp?data_folder=training/visit/loops/17oct12_syn_fog&image_width=1020&image_height=900 Low cloud / fog is depicted as blue in this color table, with mid- to high level clouds being black / dark grey. Early […]
-
Synthetic low cloud / fog imagery to forecast stratus
The synthetic low cloud / fog product from the NSSL WRF-ARW model has a variety of forecasting applications. One of those is forecasting the development of stratus clouds. The NWS forecast office in Austin / San Antonio made use of this product for the above mentioned application on September 23: AREA FORECAST DISCUSSION NATIONAL WEATHER […]
-
Synthetic Satellite Imagery evaluated at SPC
As part of NOAA’s Hazardous Weather Testbed Spring Experiment at the Storm Prediction Center, CIRA is delivering 3 synthetic imagery products to be evaluated in the Experimental Warning Portion of the experiment in their AWIPS-II system: 6.95 micrometers, 10.35 micrometers, and the 10.35 – 12.3 micrometer difference product. Chris Siewert is hosting a separate blog […]
-
ORI product for 18-20 December 2010 massive California rain event
A period of extremely heavy rain and massive higher elevation snow hit California and other portions of the West during mid-December 2010. Here we take a look at the ORI product for a portion of this storm, concentrating on Central and then Southern California. The ORI (for Orographic Rain Index) product is designed to indicate […]
-
Low cloud/fog example from Boulder WFO case from AWIPS on 9 December 2010
GeoColor and Low cloud/Fog GOES-R Proving Ground imagery from CIRA has been available at the Boulder WFO for several years. After feedback from the forecasters, recently GeoColor imagery without the city lights was added. This example shows both types of GeoColor imagery along with the Low Cloud/Fog product for a case of expanding low clouds […]
-
Cloud over snow example on 30 November 2011 from Buffalo WFO using MODIS imagery
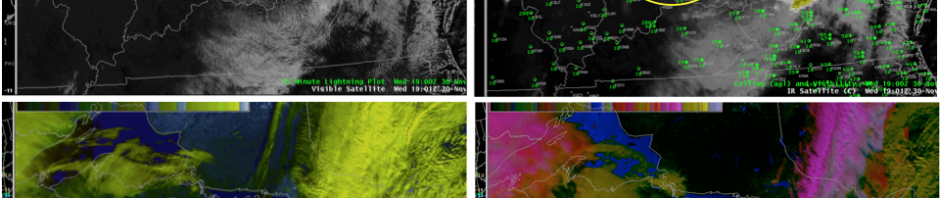
Buffalo WFO SOO David Zaff collected this imagery from one of the forecasters, Robert Hamilton, who sent him the following message: “I found it very interesting to see snow cover on the basic IR imagery late this afternoon, so I have attached both the IR and VIS imagery from 19z. ‘Sampling’ over the snow cover on the IR imagery, I was getting […]
-
Synthetic IR imagery showing fog/low clouds from BOU WFO on 8 November 2011

This example from the Boulder WFO shows the use of synthetic IR imagery generated from the 4-km horizontal grid resolution NSSL WRF model for predicting an area of fog and low clouds near the Denver International Airport (DIA) on the morning of 8 November 2011. The WRF model is run daily at 0000 UTC, and […]
-
Synthetic Fog Product – November 19/20, 2011 example
This blog entry will look at an example of the synthetic fog product (from the 4-km NSSL WRF-ARW model) for an event that took place during the overnight hours of November 19 to 20, 2011. Here is the synthetic fog product during the overnight hours: http://rammb.cira.colostate.edu/templates/loop_directory.asp?data_folder=training/visit/loops/19nov11_syn_fog There is southerly flow advecting moisture from the Gulf […]
Recent Posts
Recent Comments
People are concerned about snowboarding when they should be worried about the water supply in general. We’re using it an…
An excellent and very thorough analysis of this high-impact blowing dust event. Additional satellite images (including GOES visible animations) are…
I’ve been looking at DNB (and brightness temperature difference) over the PAC NW the past couple days: https://fusedfog.ssec.wisc.edu/?p=886 Great time…
Ed, Yes, I had noticed this the other day also…good that you caught it and posted! These dust events over…
Excellent analysis of this event. As a supplement, we have GOES-15 and Himawari-8 water vapor imagery of the storm posted…