MODIS Snow/Cloud Discriminator Example

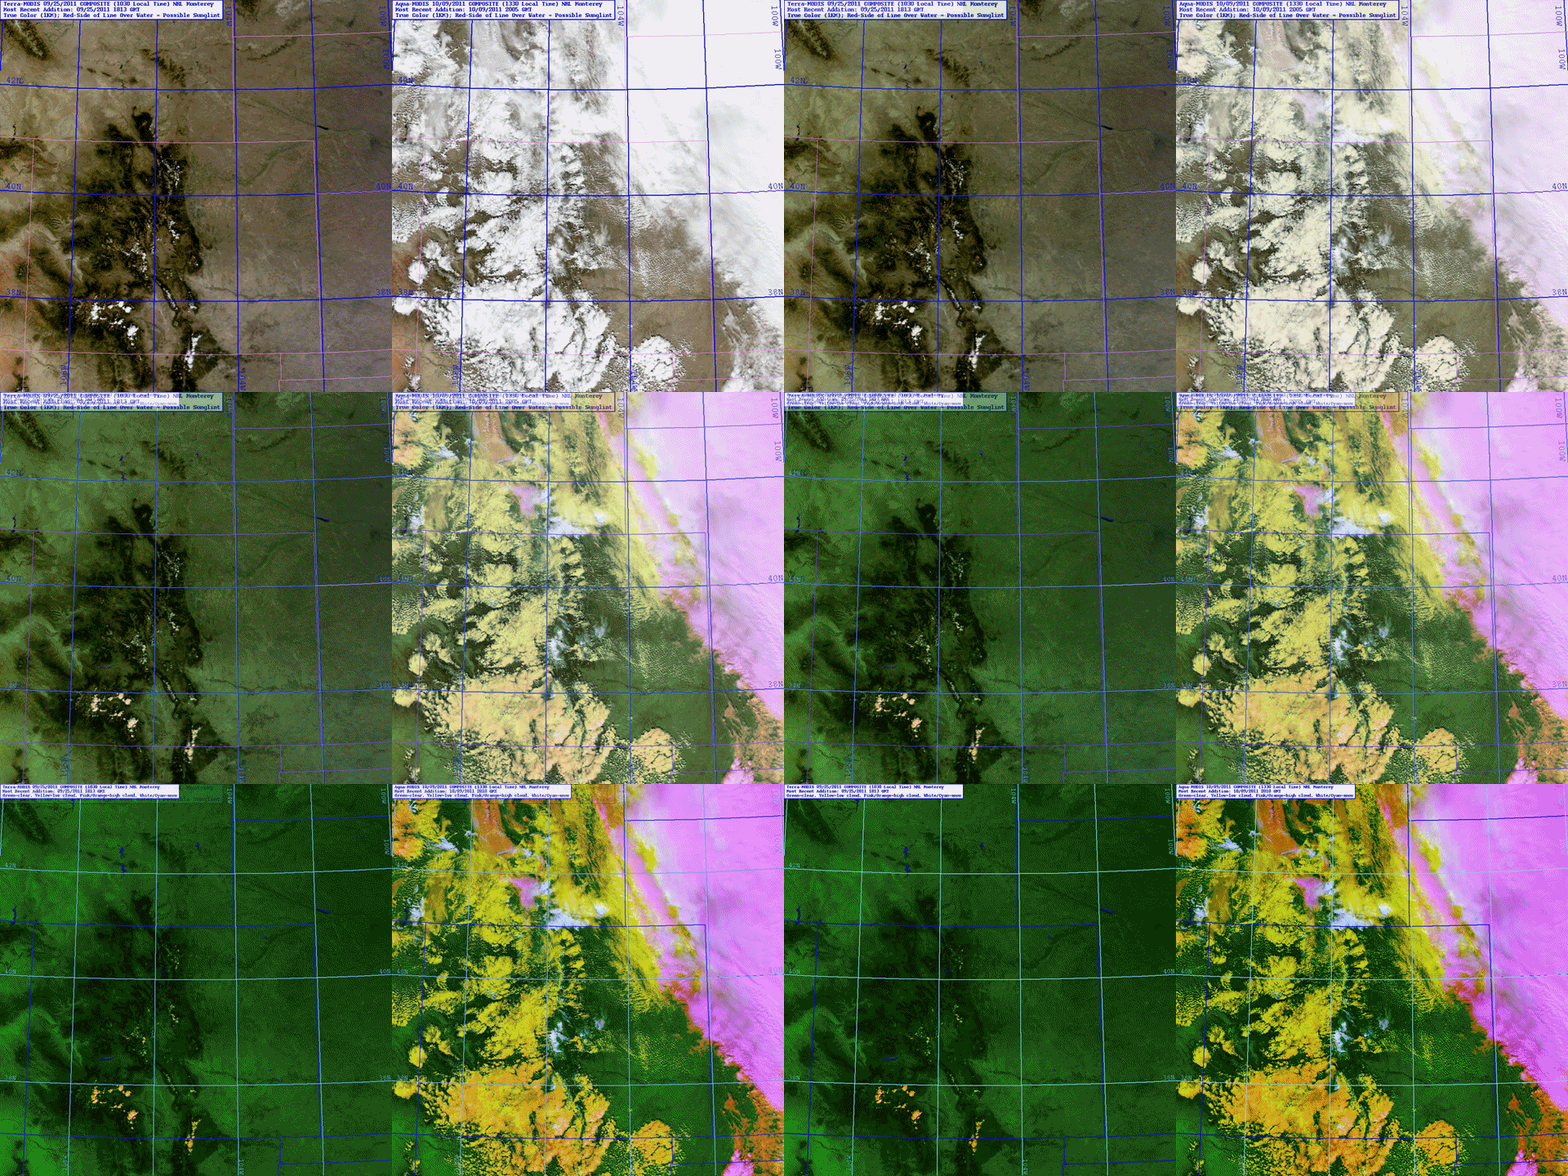
As part of the GOES-R Satellite Proving Ground, NASA MODIS data are being used to preview the kinds of snow detection capabilities that will become available from the GOES-R ABI.  The fading image example above demonstrates the MODIS Snow/Cloud Discriminator product, coupled with the true color product which presents the scene as “color-vision imagery” but does not discriminate snow from clouds.  The discriminator product, presented here as enhanced imagery,  takes advantage of shortwave infrared bands currently not availble to GOES to present high clouds in magenta, mid/low and overlapping level clouds in orange/yellow, snow cover in white, and clear-sky over land as green (water bodies, when present, appear as blue).

On the left side of this example is an image from 9/25/2011 centered over Colorado near the end of the ‘water year’ (which runs from Oct 1 to Sep 30, and corresponds roughly to the storage cycle of snowpack in the Rockies).  On the right side is an image from 10/9/2011, entering the new water year and shortly after one of the first Colorado high-country snow events.  The 9/25/2011 fading loop is MODIS true color imagery in which no snow cover is discerned (with only a few broken cumulus clouds over the mountains).  After the snow event, a large portion of the domain is filled with what might be low clouds, high clouds, or snow (right).  Using the true color imagery alone, a forecaster would have trouble discriminating between the clouds and snow in this complex scene.  However, the snow/cloud discriminator product makes the identification less ambiguous.

With GOES-R, this capability will be further improved by virtue of the high temporal refresh rate (5 minute, standard), enabling detection of snowfields that are currently obscured by cloud cover.  Through the Proving Ground, forecasters are able to familiarize themselves with and evaluate the capabilities of improved snow/cloud discriminators in anticipation of operation commission of the GOES-R ABI later this decade.

Posted in MODIS Snow/Cloud Discriminator | Comments Off on MODIS Snow/Cloud Discriminator Example

Snow Cover Representation in the Synthetic Imagery

Upon inspection of the synthetic infrared (10.35 micron) imagery from the NSSL WRF-ARW model:

http://rammb.cira.colostate.edu/templates/loop_directory.asp?data_folder=training/visit/loops/13oct11_syn_ir

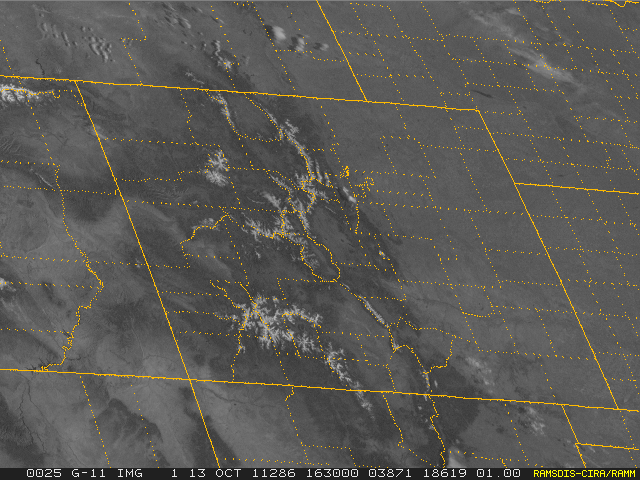
your attention may be drawn to the region of southwest Colorado since we see a region of cold brightness temperatures  that does not move and persists for the duration of the loop (1600-0000 UTC).  Could these be low clouds / fog? Let’s look at the GOES visible imagery for 1630 UTC:

Skies are clear across southwest Colorado, so we are not looking at low clouds / fog.  However, note that there is snow cover over the mountains.

What we’re looking at in the synthetic imagery is a representation of  snow cover.  The snow cover data that goes into the NSSL WRF-ARW model is relatively coarse, therefore the cold ground signature is spread out over relatively large areas when there is snow cover in the model.  This signature shows up quite easily early in the cold season with the large temperature difference between snow cover and no snow cover, and will increase in coverage moving into winter as snowfall coverage increases.

Posted in Synthetic NSSL WRF-ARW Imagery | Comments Off on Snow Cover Representation in the Synthetic Imagery

A known limitation of the observed and synthetic Fog Product

Let’s analyze the following loop of the synthetic fog product, generated from the 4-km NSSL WRF-ARW model:

http://rammb.cira.colostate.edu/templates/loop_directory.asp?data_folder=training/visit/loops/10oct11_syn_fog/

In this color table, grey into light blue represents increasing confidence in liquid water clouds.  Our example from the 0000 UTC 10 October 2011 NSSL WRF-ARW model run shows a large area of liquid water clouds (most likely stratus) across Texas extending northward through the central US.  The darker shades of grey and black correspond to ice clouds (most likely cirrus) forecast by the model.

The region of blue in Arizona and Utah extending southward into northwest Mexico that does not move catches your attention.  A quick look at the visible satellite imagery:

http://rammb.cira.colostate.edu/templates/loop_directory.asp?data_folder=training/visit/loops/10oct11_goes_vis

shows that the region is mostly cloud free.  However, the lighter shade of grey extending northwest to southeast through the four corners of AZ/CO/UT/NM corresponds to the blue in the synthetic fog product; this false cloud signature is a consequence of surface emissivities at the two channels.  This is not a model error, rather, an observed feature in GOES-11.  Similarly, the other blue region in the northeast quadrant of AZ and southwest AZ into northwest Mexico are also consequences of the surface emissivity.

The easiest way to identify a false signature is to look at the loop, and the areas that don’t move at all throughout the duration of the loop are likely false emissivity signatures.

Posted in Synthetic NSSL WRF-ARW Imagery | Comments Off on A known limitation of the observed and synthetic Fog Product

Synthetic Satellite Imagery in Temperature Forecasting

Synthetic satellite imagery can be useful in forecasting temperature.  This example from September 20-21, 2011 demonstrates the utility of synthetic imagery from the 4-km NSSL WRF-ARW model in forecasting the overnight low temperature.

Focusing on southeast Wyoming, examine the synthetic infrared imagery from late afternoon (2000 UTC) through the late night hours (0800 UTC):

http://rammb.cira.colostate.edu/templates/loop_directory.asp?data_folder=training/visit/loops/20sept11_syn&image_width=800&image_height=600

Early in the loop, there is afternoon convective clouds in southeast Wyoming, which diminishes by 0300 UTC.  However, notice the region of clouds (indicated by the colder brightness temperatures) developing across southeast Wyoming in the 0300-0800 UTC time range.  If the forecast is correct, the cloud cover would keep temperatures from cooling down as quickly.

Now let’s analyze what actually happened by looking at the GOES IR imagery:

http://rammb.cira.colostate.edu/templates/loop_directory.asp?data_folder=training/visit/loops/20sept11_goes&image_width=800&image_height=600

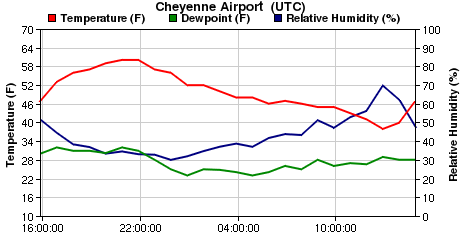
Note the clouds developing into southeast Wyoming in the 0500-0745 UTC time range, similar to what was forecast by the WRF-ARW model.  This caused locations under the cloud cover to not cool off as quickly, for example, look at the temperature trace (red line) for Cheyenne, WY:

Temperatures at Cheyenne cooled off gradually to about 1000 UTC, then the cloud cover dissipated allowing temperatures to cool more rapidly to an overnight low of 36 F.

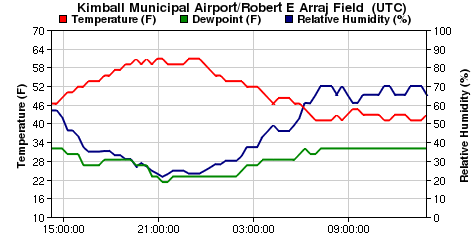
Similarly, at locations further east in the southern Nebraska panhandle, cloud cover kept Kimball, NE from cooling off too rapidly for an overnight low of  42:

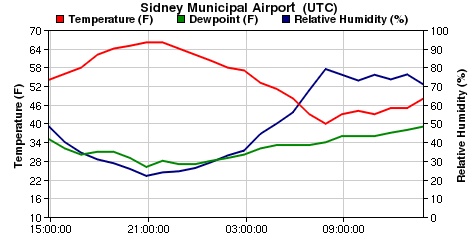
And an overnight low of 40 at Sidney, NE:

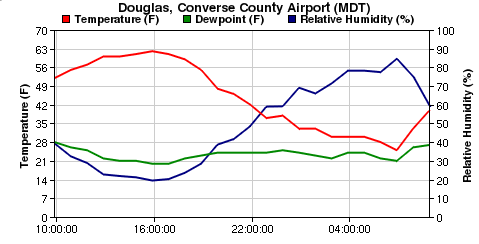
Meanwhile, at Douglas (about 150 miles north of Cheyenne) in east central Wyoming:

Temperatures cooled off more rapidly as skies remained clear, and the overnight low was 25 F.

Real-time synthetic imagery from the 4-km NSSL WRF-ARW model may be viewed here:

http://rammb.cira.colostate.edu/ramsdis/online/goes-r_proving_ground.asp#Synthetic_GOES-R_Imagery_from_Real-Time_NSSL_4_km_WRF-ARW

Contributor:  Becca Mazur, NWS forecast office, Cheyenne, WY

Posted in Synthetic NSSL WRF-ARW Imagery | Comments Off on Synthetic Satellite Imagery in Temperature Forecasting

Synthetic Fog Product

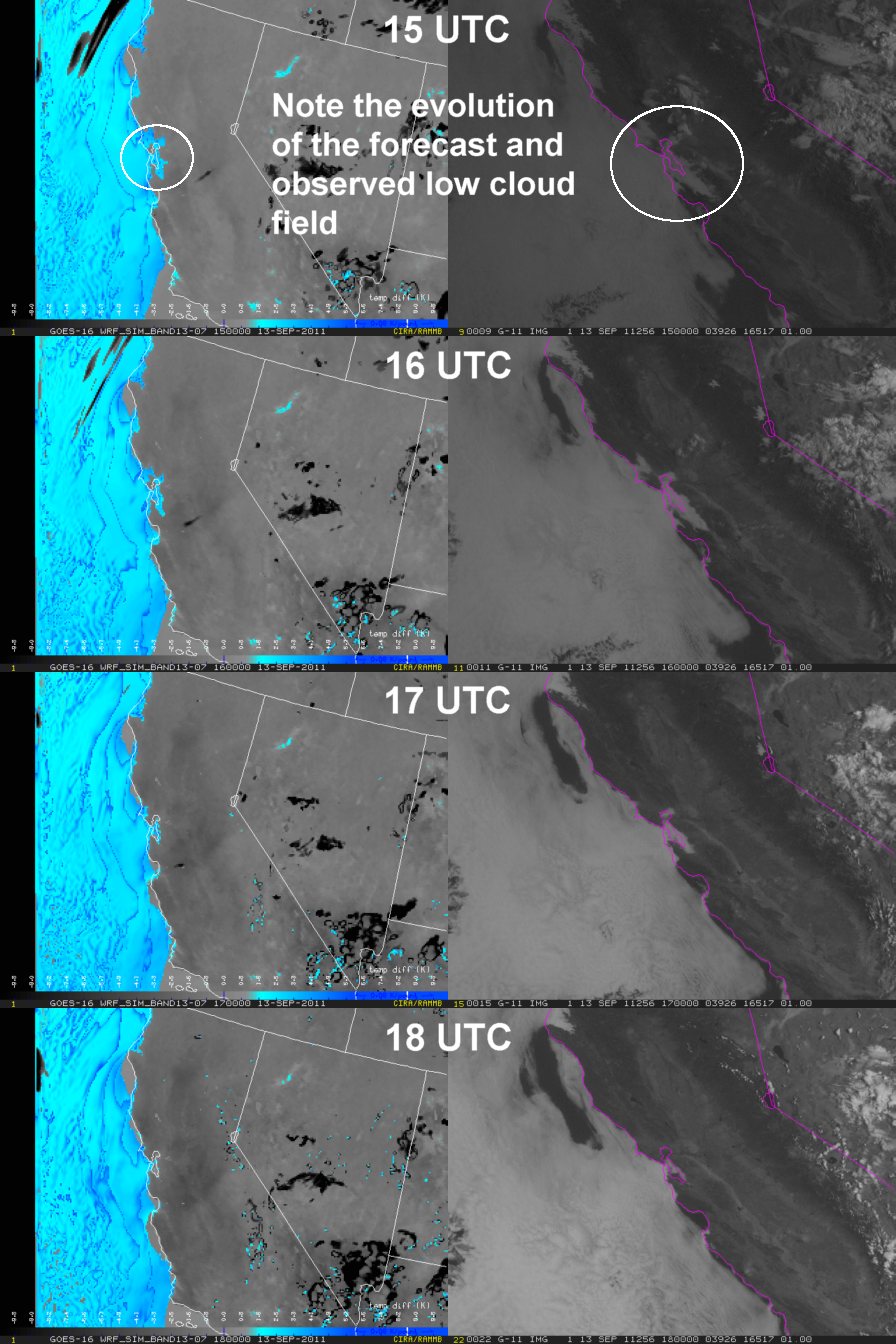
Synthetic Fog Product based on the 15- to 18-hour forecasts from the NSSL WRF-ARW (left), and GOES-11 Visible Imagery (right)

A new synthetic difference product is now being produced from the NSSL WRF-ARW output: the fog product, or 10.35 – 3.9 μm.  In order to generate synthetic 3.9 μm imagery in a timely manner, it’s necessary to assume that it’s always night because the solar reflected calculations are too expensive.  This allows the traditional fog product to be displayed for all forecast hours of the WRF.  In the example above, the color scheme for the synthetic fog product (left) is designed such that grey into light blue represents increasing confidence in liquid water clouds.  Note the forecast stratus clouds in the San Francisco Bay area, and compare that to the observed GOES-11 visible imagery on the right.  The WRF-generated fog product forecast does a good job with the location and dissipation time of the low clouds.  Such a forecast might be quite useful for the aviation industry given how often low clouds and fog cause delays at the West Coast airports.

Posted in Synthetic NSSL WRF-ARW Imagery | Comments Off on Synthetic Fog Product

Synthetic Imagery for Hurricane Irene

Synthetic imagery from the 4-km NSSL-WRF ARW model is produced at CIRA and is available in real-time here:

http://rammb.cira.colostate.edu/ramsdis/online/goes-r_proving_ground.asp#Synthetic%20GOES-R%20Imagery%20from%20Real-Time%20NSSL%204%20km%20WRF-ARW

The following loop shows Hurricane Irene at the time it was east of Florida:

http://rammb.cira.colostate.edu/templates/loop_directory.asp?data_folder=dev/lindsey/loops/nssl_wrf_g13_irene&image_width=1024&image_height=384

The right side shows the synthetic infrared imagery from the 0000 UTC 25 August model run, and the corresponding GOES infrared imagery is on the left.  Keep in mind some of the known biases with the model such as brightness temperatures typically warmer than GOES, and anvil cirrus from convection that is typically underdone.  Synthetic imagery can be compared with GOES imagery to look for forecast trends in the Hurricane.

Posted in Synthetic NSSL WRF-ARW Imagery | Comments Off on Synthetic Imagery for Hurricane Irene

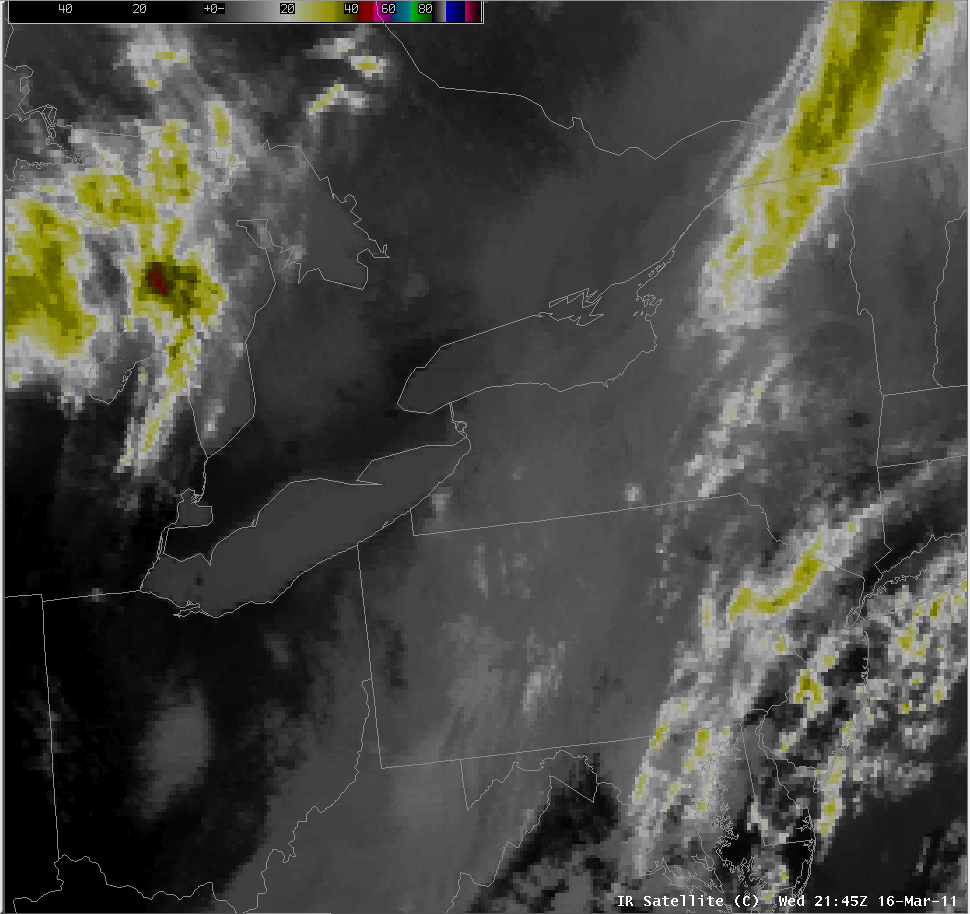
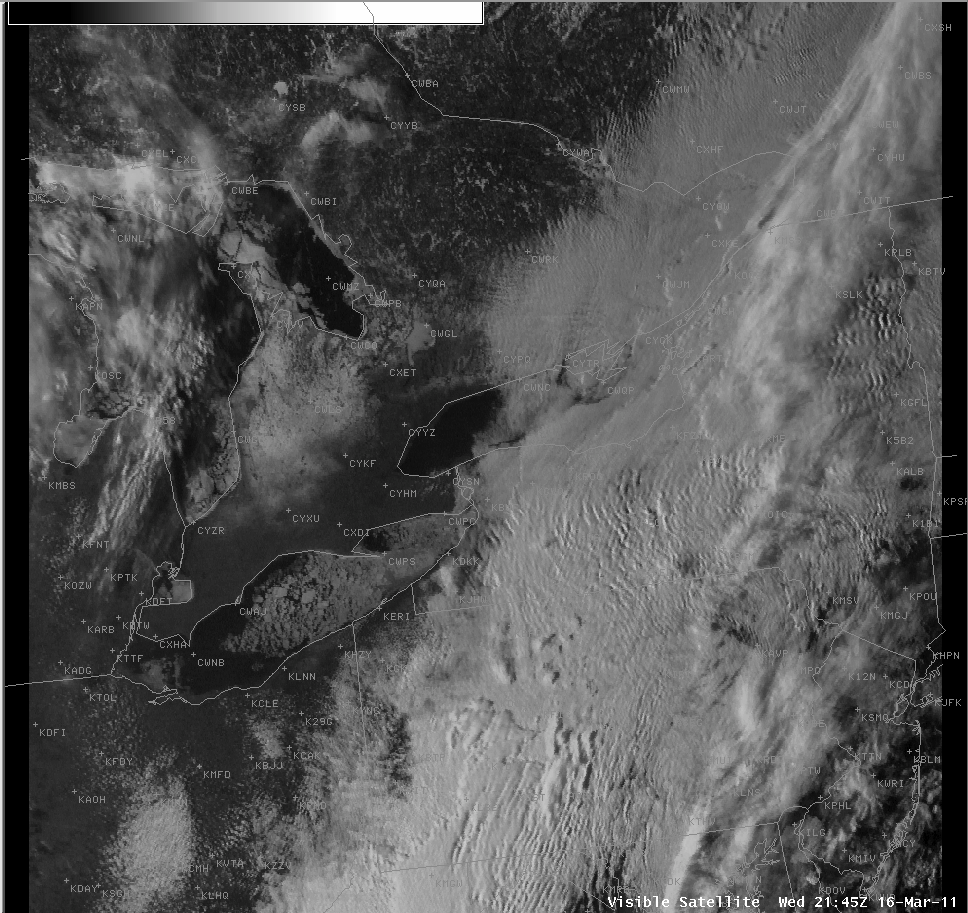
Low cloud/fog early detection over Lake Erie on 16 March 2011 from WFO BUF

Sent to the BUF SOO by forecaster Kirk Apffel

The new CIRA stratus/fog IR satellite worked well late
afternoon/evening.  It clearly showed low stratus and fog developing
on Lake Erie, which was hardly visible on other products. It was useful because the new product captured the feature before sunset (after sunset the 11u-3.9u picked it up).

Basic IR image

Posted in Uncategorized | Comments Off on Low cloud/fog early detection over Lake Erie on 16 March 2011 from WFO BUF

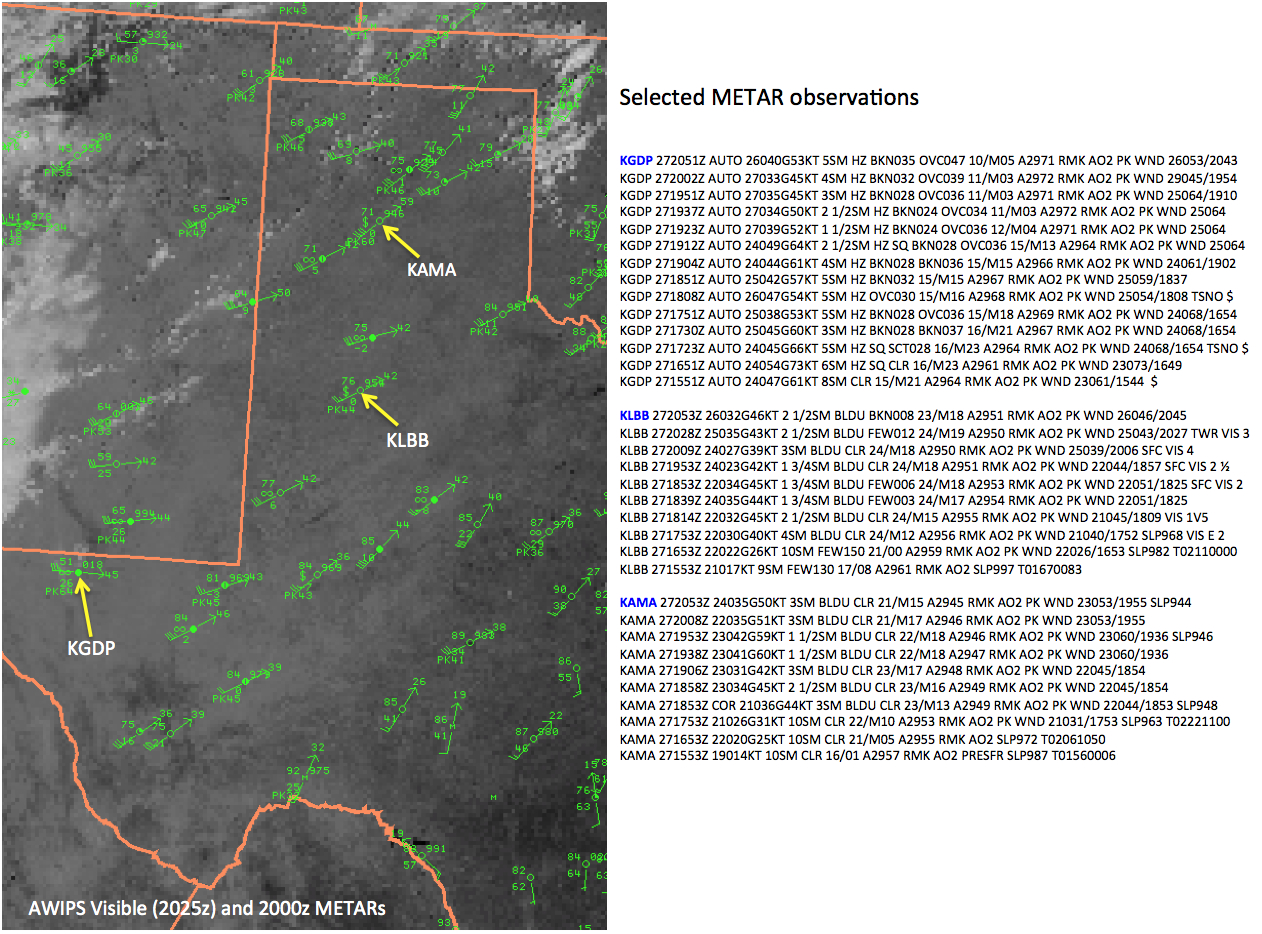
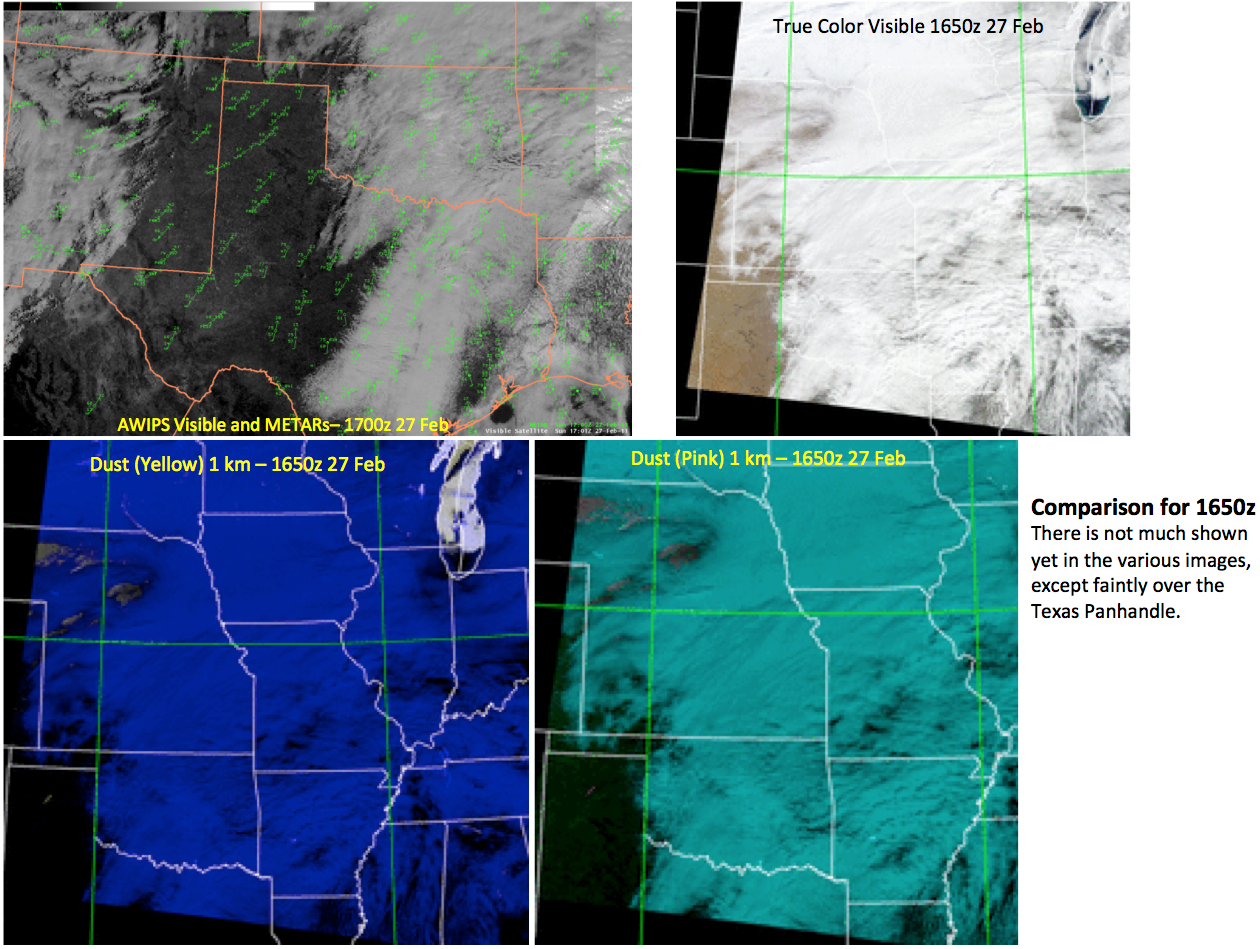
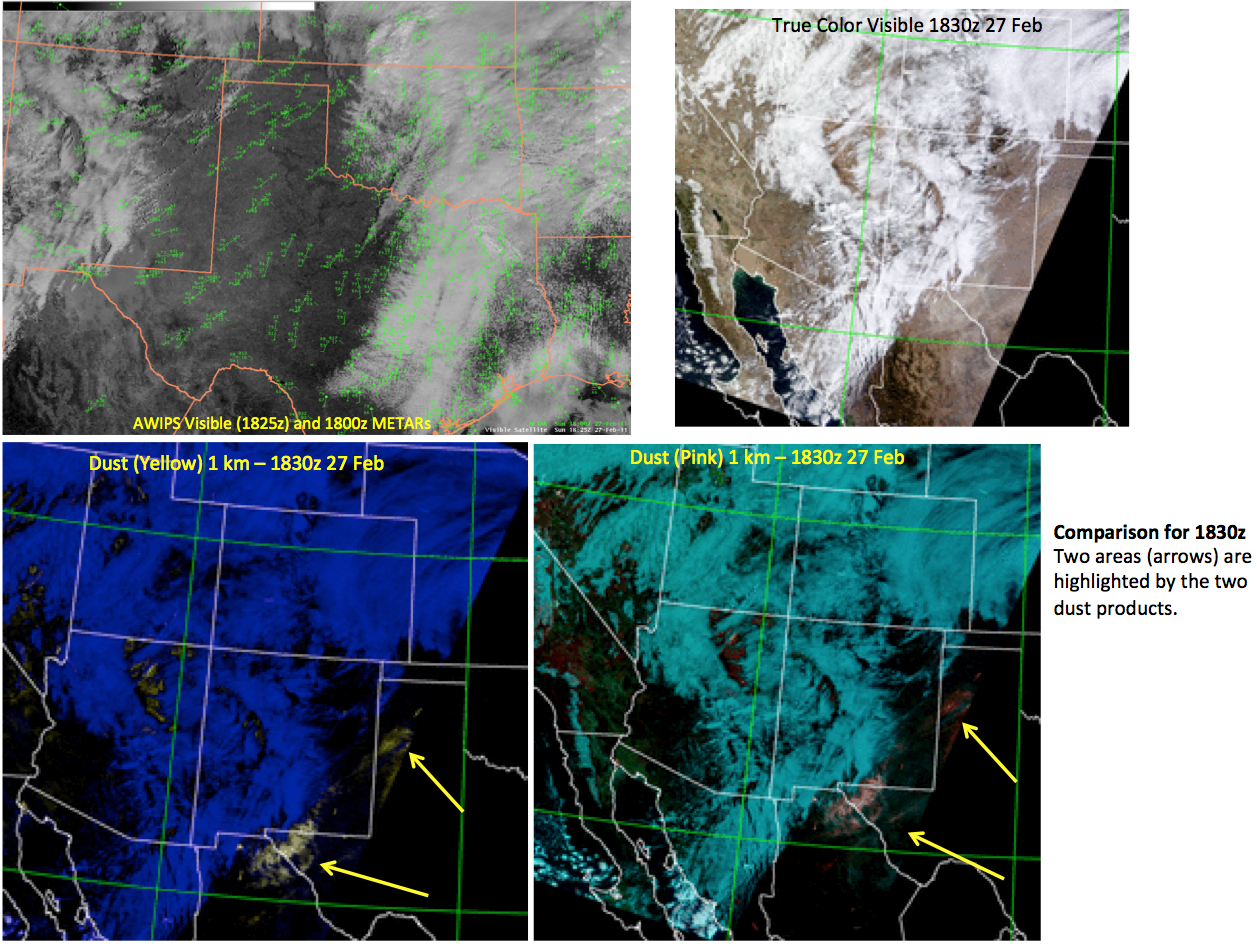
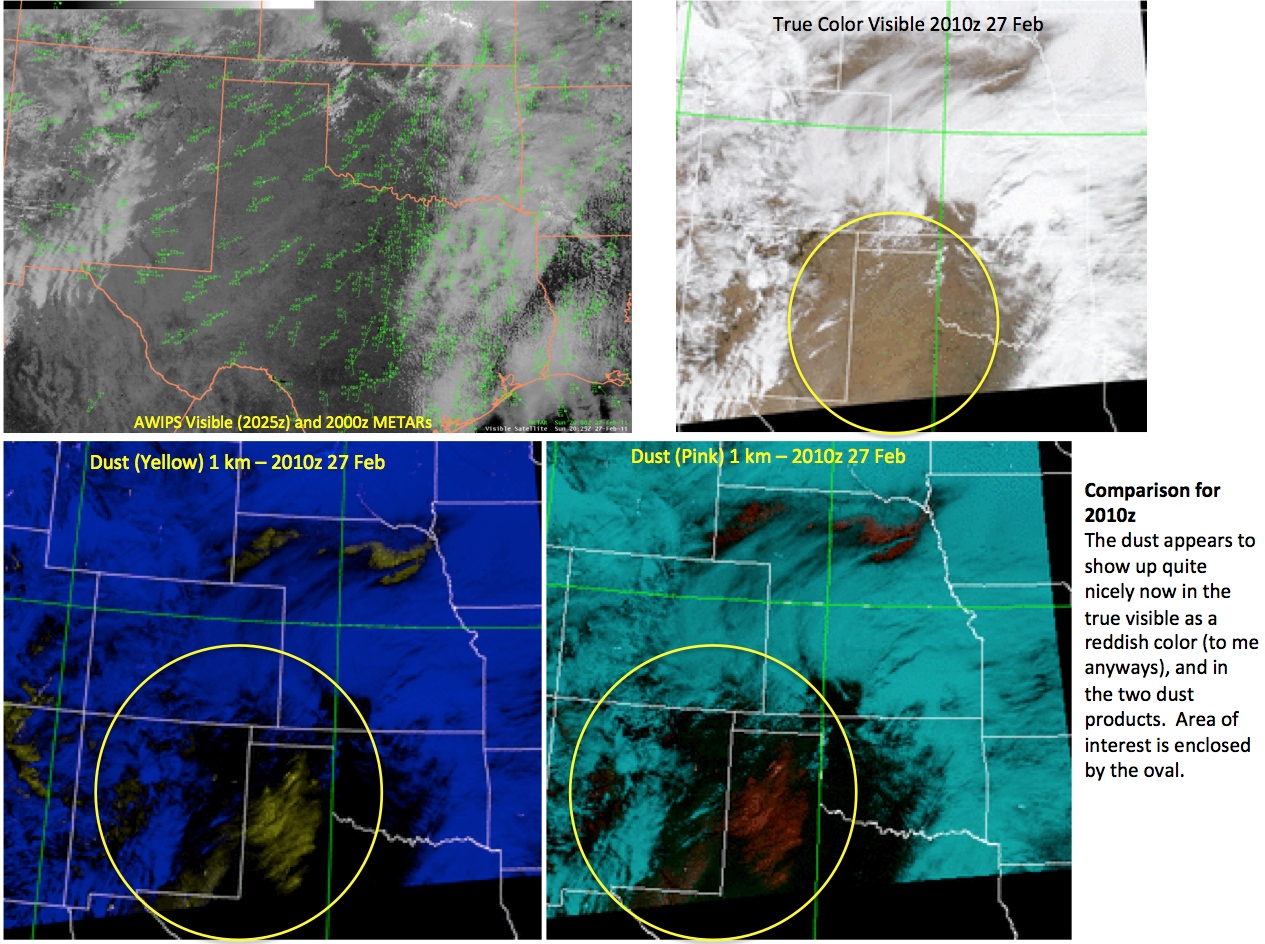
Comparison of CIRA Dust Products for 27 Feb 2011 Eastern NM/West TX dust storm

Summary: (comments are given for each time)
-Widespread blowing dust behind a strong dry line pushing across the western half of Texas
-Compared the two CIRA dust products with AWIPS visible imagery for 3 times on 27 Feb 2011
-Also looked at MODIS true-color visible imagery
Posted in Blowing Dust (Blue-light absorption technique) | 1 Comment