• Wild Week of Wildfires, Part II

    Last time on “Wild Week of Wildfires“, we looked at the Little Bear Fire and High Park Fire, two lightning-ignited fires burning out west that were so hot they caused saturation in the two 3.7 µm channels on VIIRS (I-04 and M-12). There was mention of the Duck Lake Fire, a lightning-ignited fire in northern Michigan, which VIIRS also saw, and I couldn’t resist showing some more images.

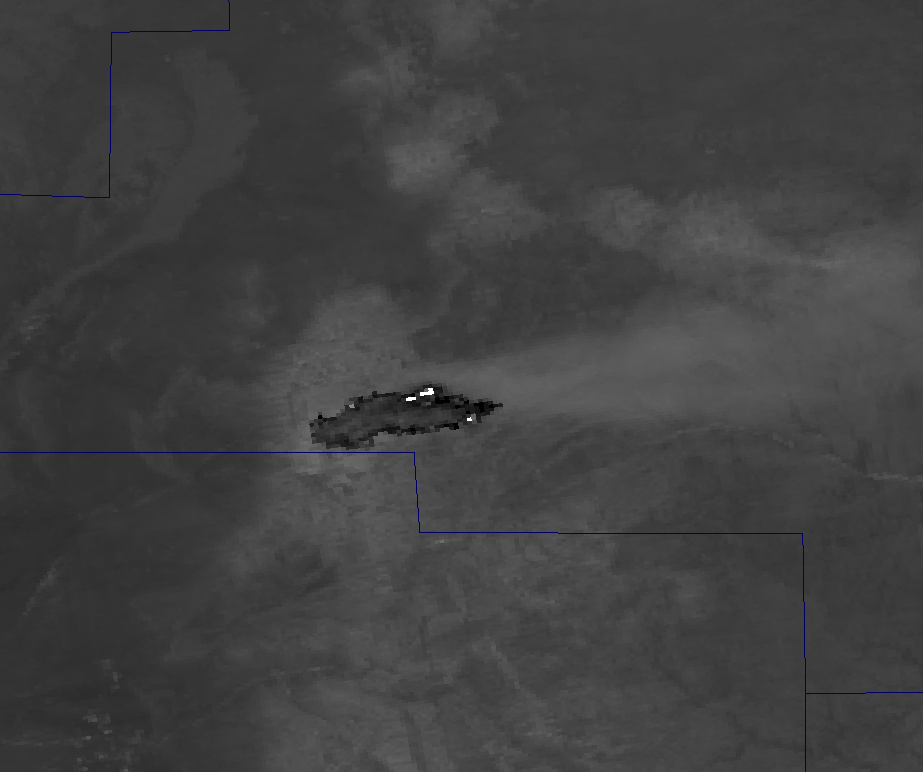
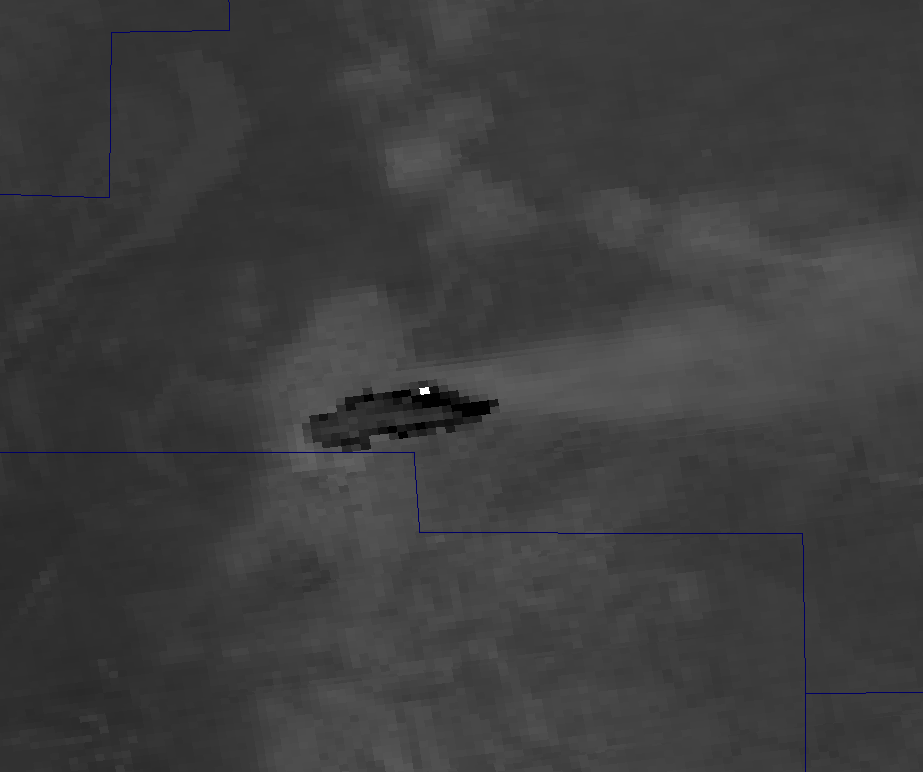
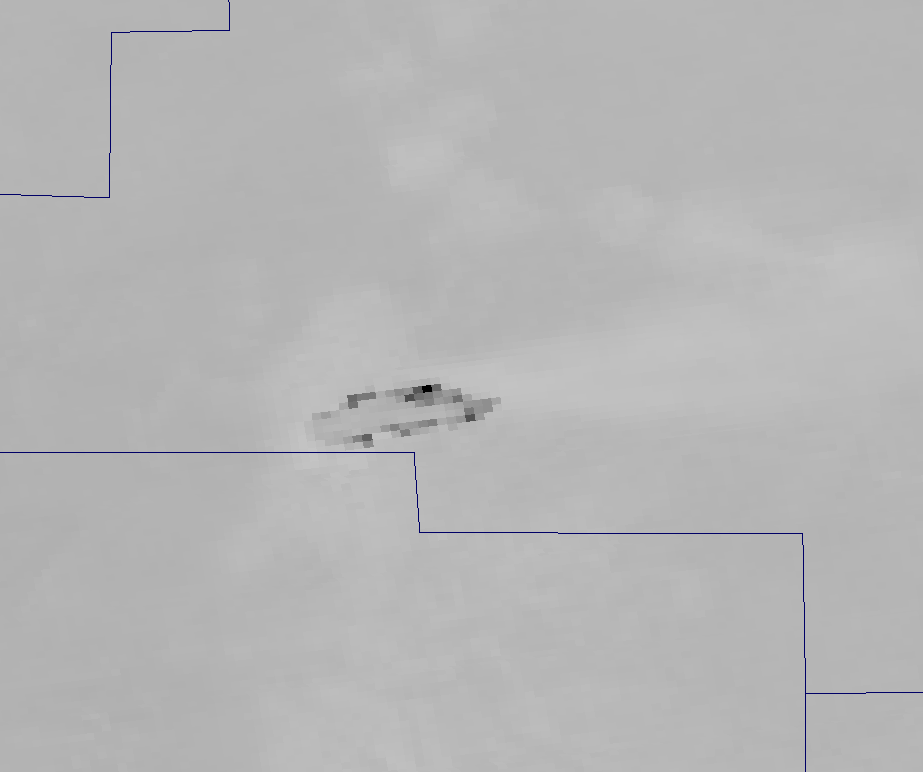
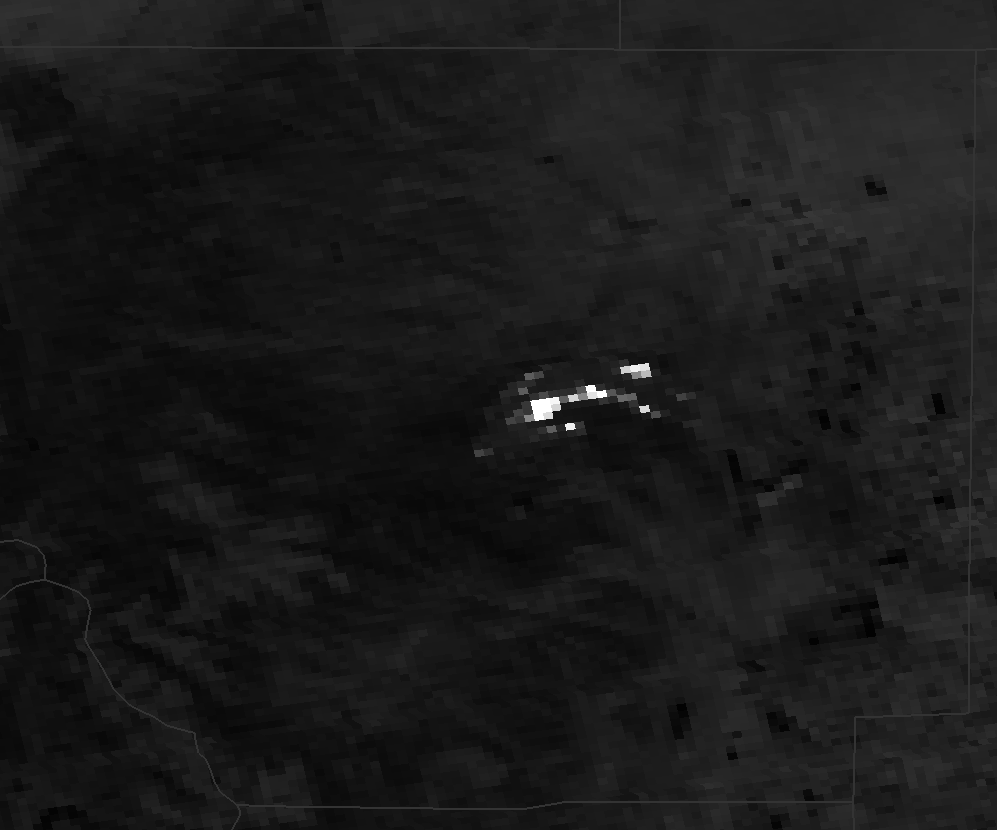
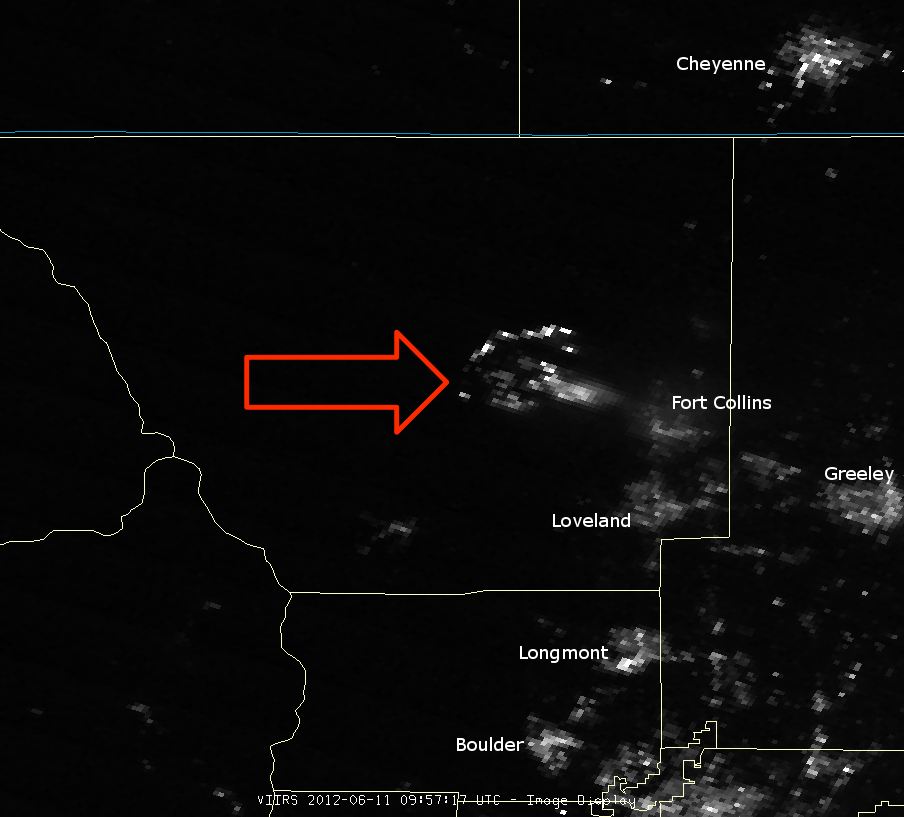
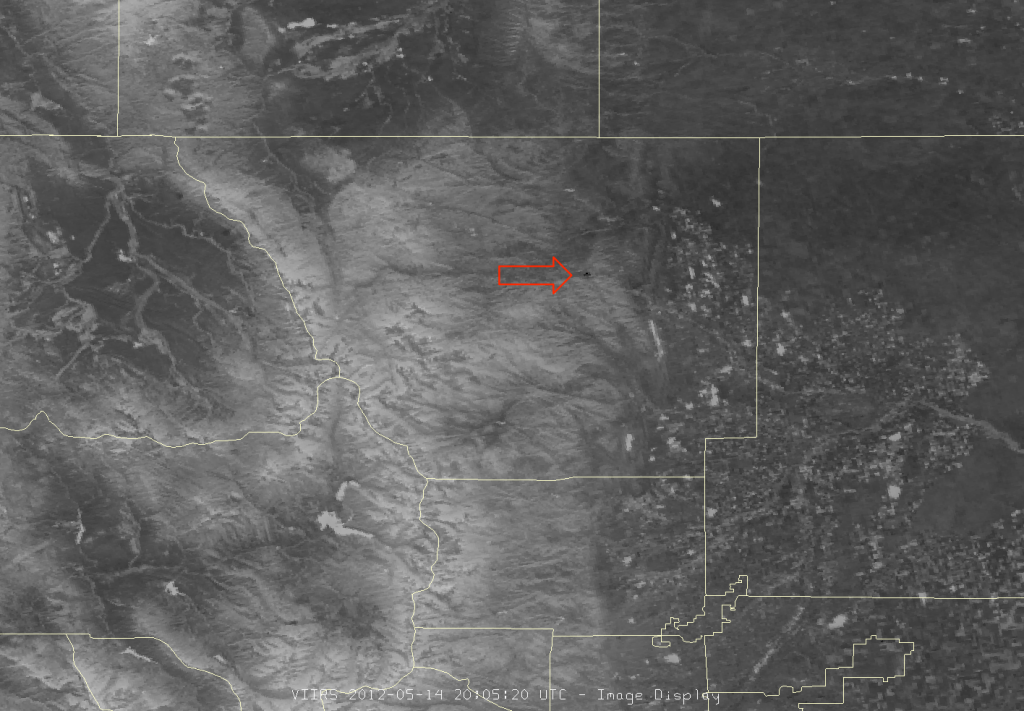
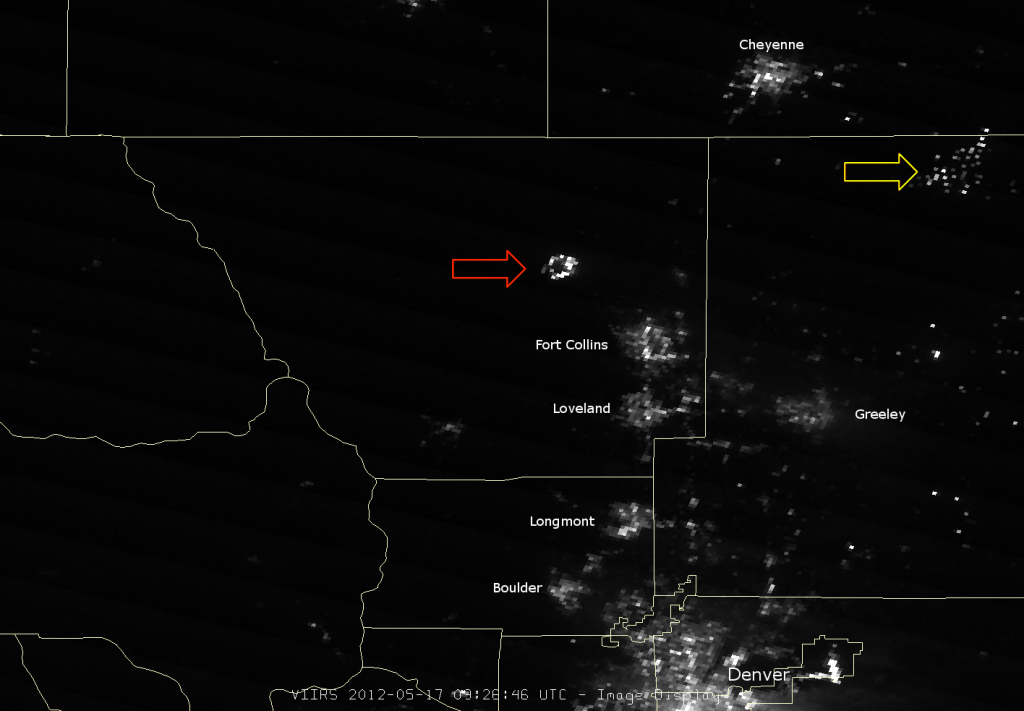
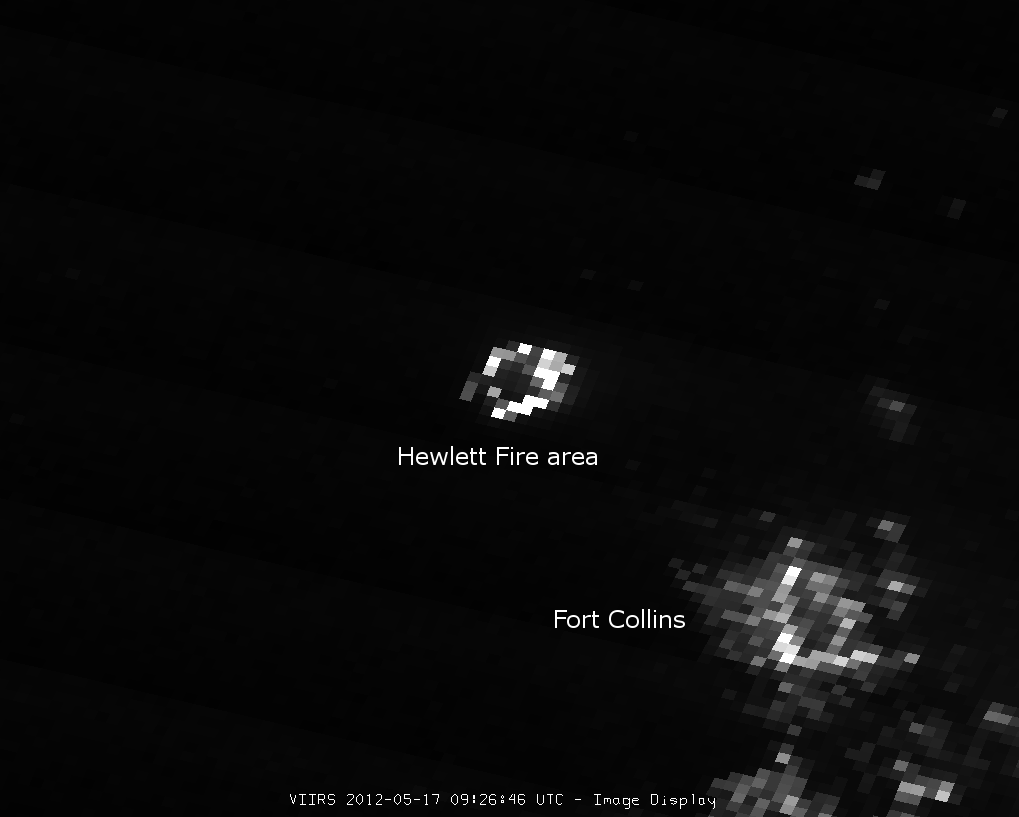
    On 9 June 2012, the same day the High Park Fire exploded (figuratively speaking), the Duck Lake Fire finally reached 100% containment after burning over 21,000 acres. The next day (10 June 2012), Suomi NPP passed over the Upper Peninsula of Michigan, and it was actually a clear day. (This joke comes courtesy of 20+ years experience of living in Michigan.) Even with 100% containment, the hot spot of the fire was still clearly visible in VIIRS channel I-04 (3.7 µm) that afternoon:

    Channel I-04 image of the Duck Lake Fire from VIIRS, taken 18:18 UTC 10 June 2012
    Channel I-04 image of the Duck Lake Fire from VIIRS, taken 18:18 UTC 10 June 2012

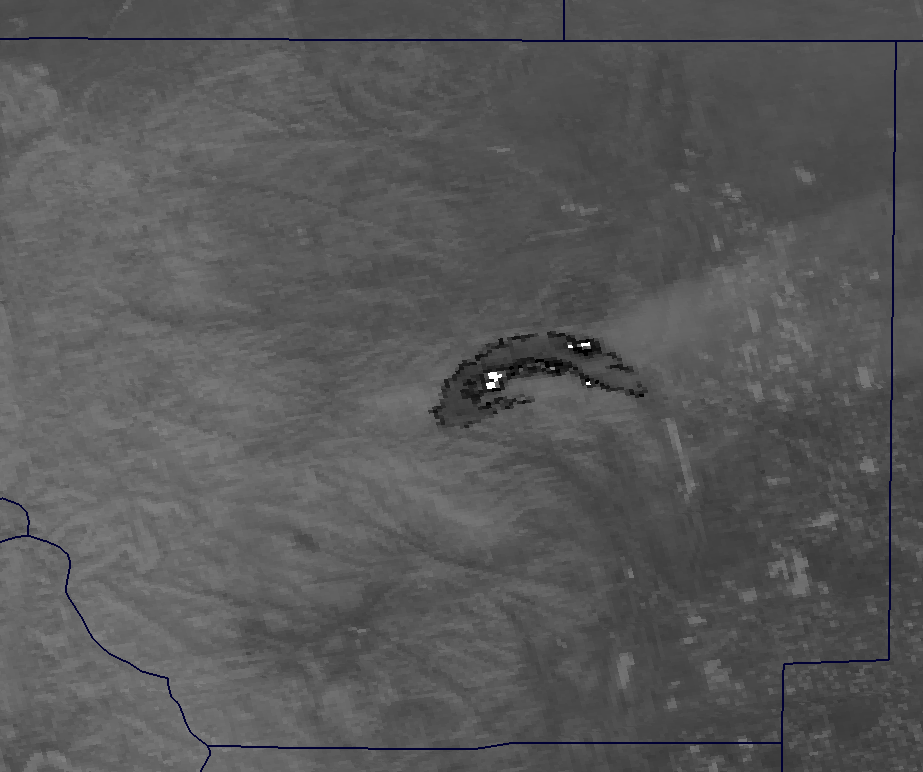
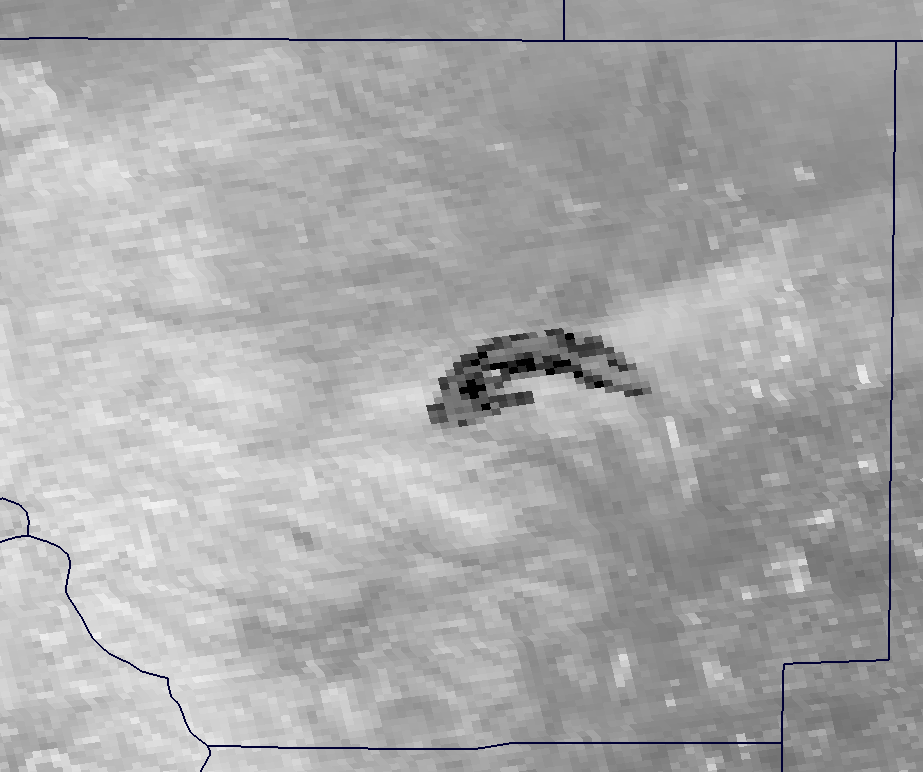
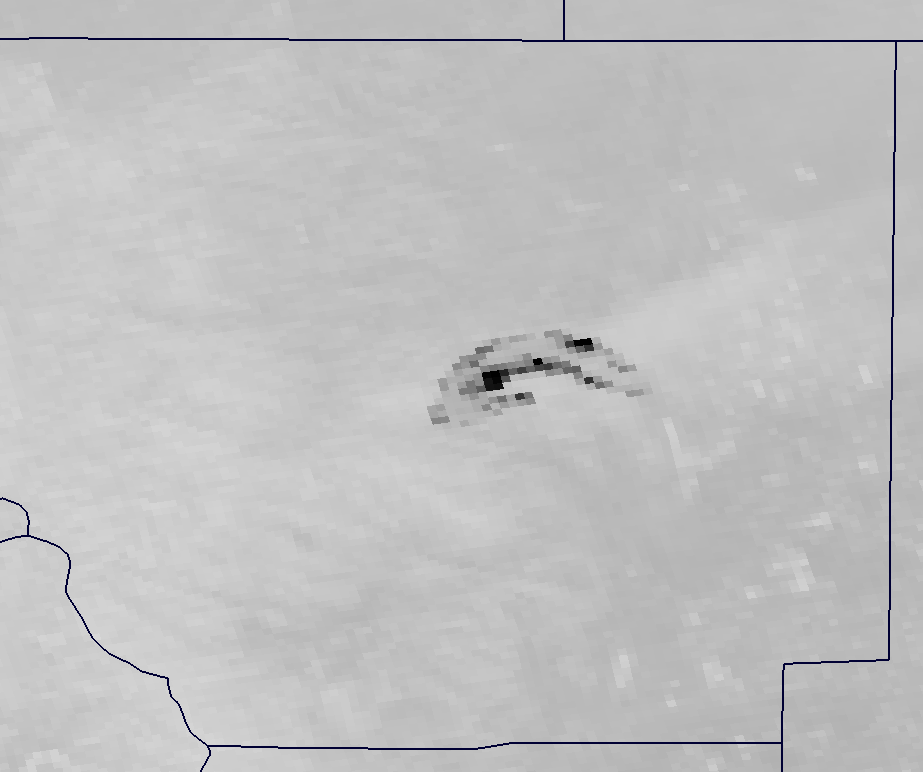
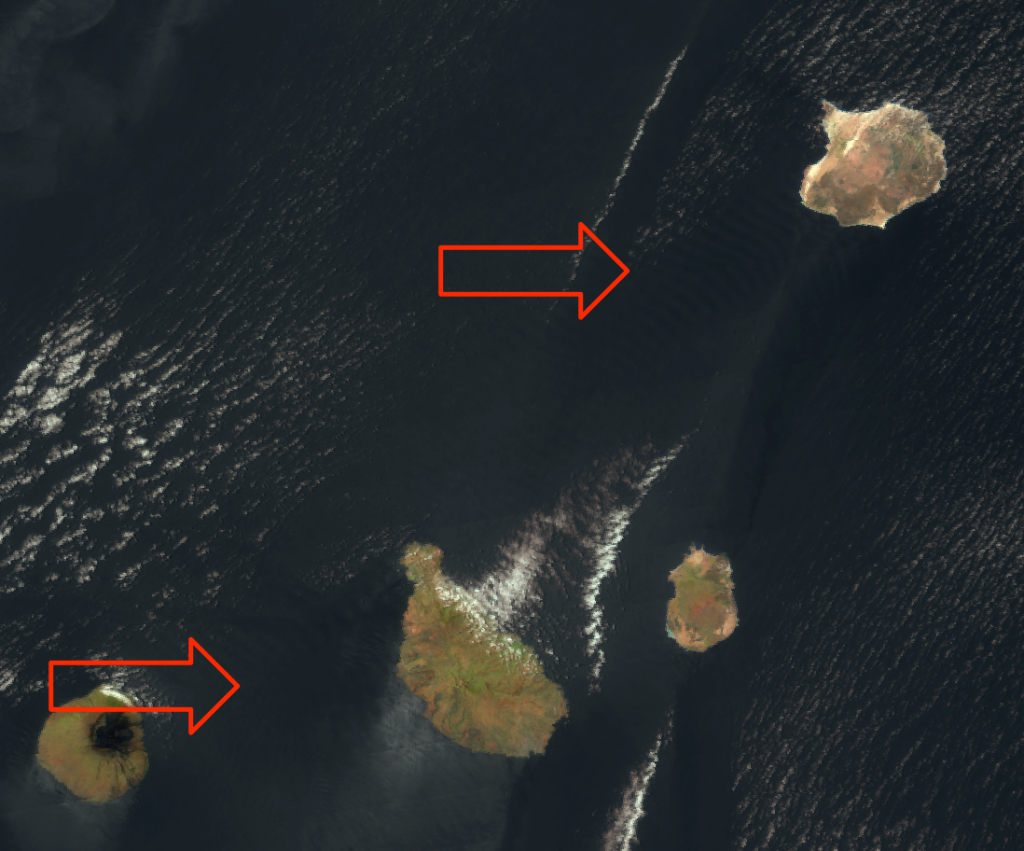
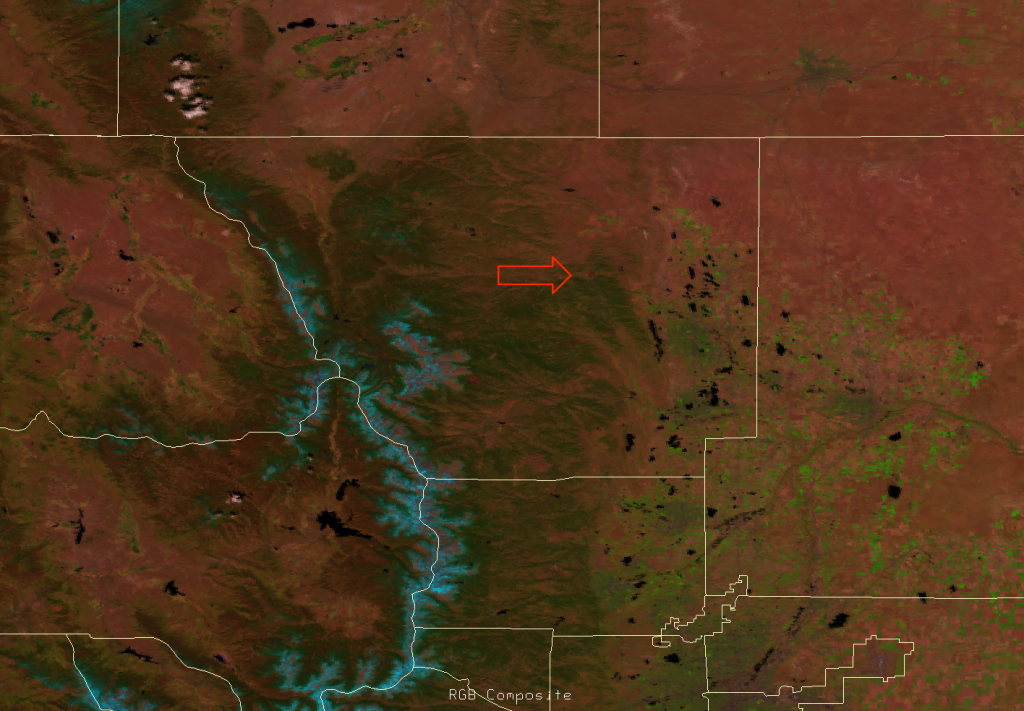
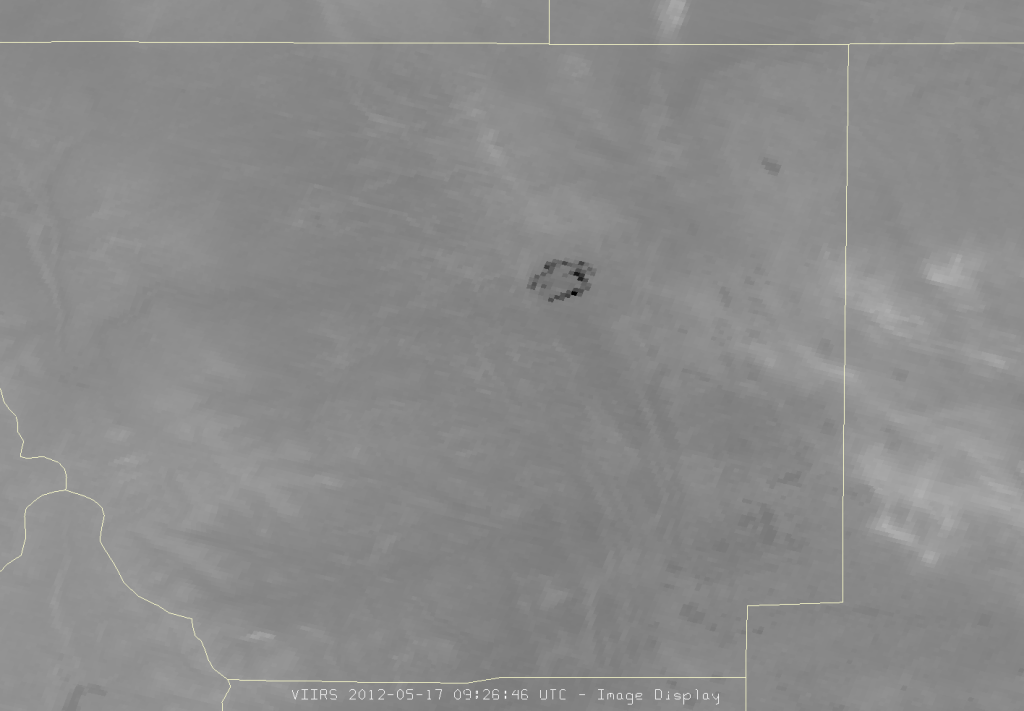
    The highest brightness temperature in the burn area in this channel at this time was    ~331 K. As we saw before with the Lower North Fork Fire, the high resolution false color composite of channels I-01, I-02 and I-03 is useful in highlighting the burn area:

    False color RGB composite of VIIRS channels I-01 (blue), I-02 (green) and I-03 (red), taken 18:18 UTC 10 June 2012
    False color RGB composite of VIIRS channels I-01 (blue), I-02 (green) and I-03 (red), taken 18:18 UTC 10 June 2012

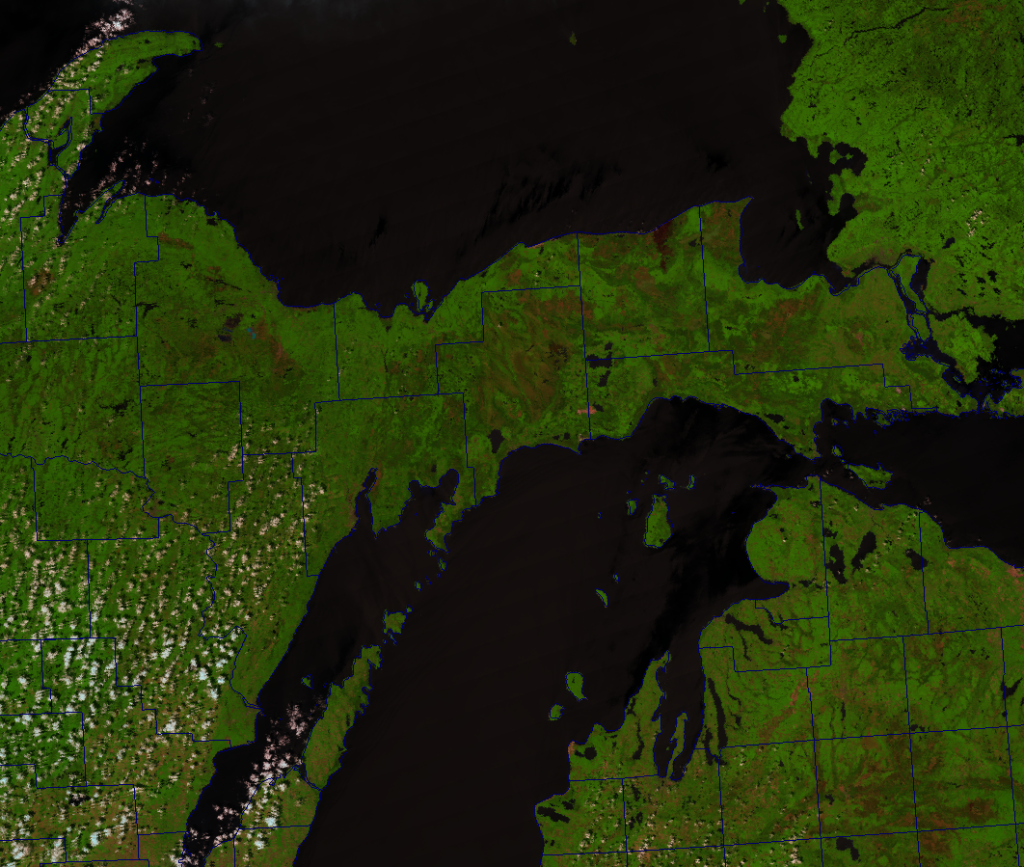
    Notice the large, brown area that coincides with the hot spot in the I-04 image. The combination of wavelengths used in this composite (0.64 µm [blue], 0.865 µm [green] and 1.61 µm [red]) is quite sensitive to the amount (and health) of the vegetation.

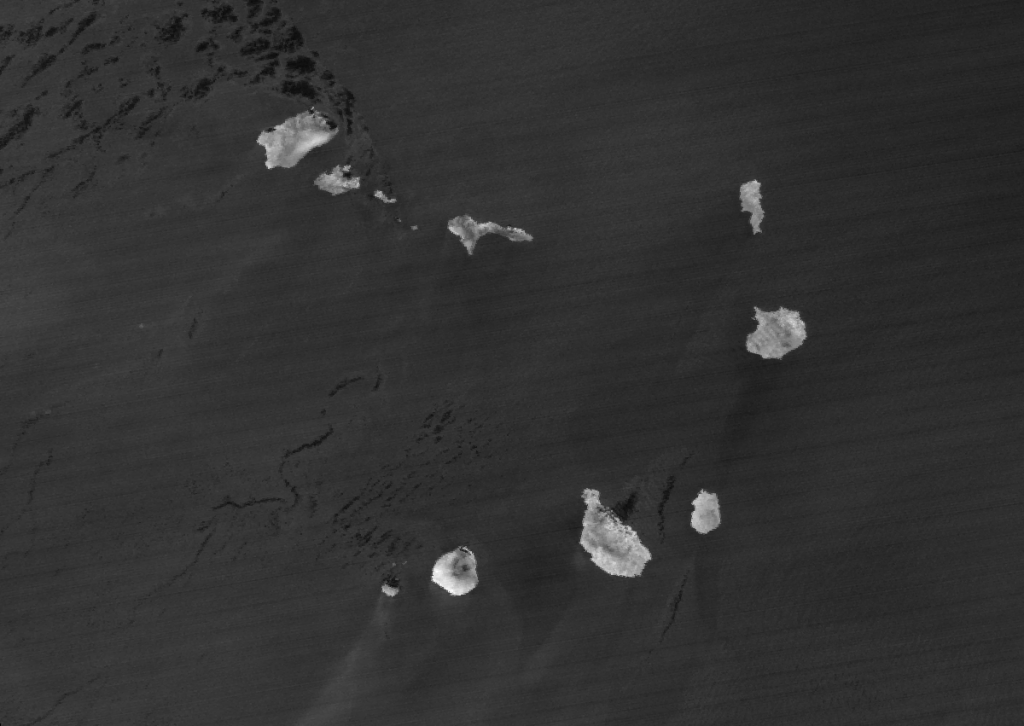
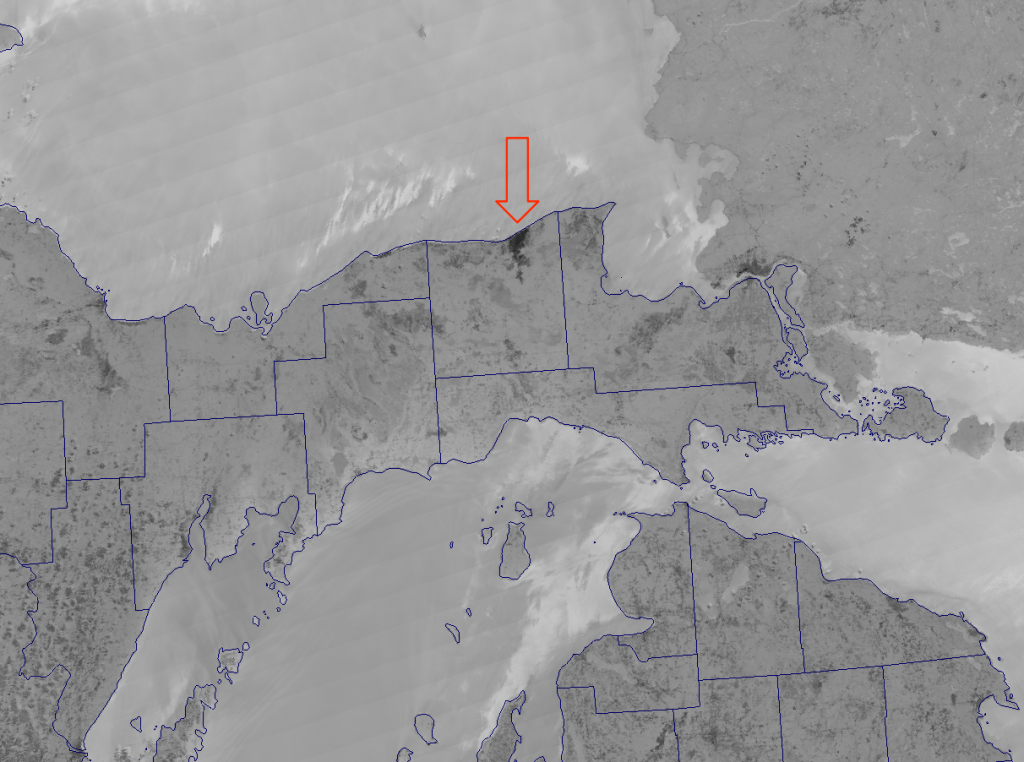
    You might have also noticed several other interesting features in the image that show up better when you zoom in:

    False color composite of VIIRS channels I-01, I-02, and I-03 from 18:18 UTC 10 June 2012
    False color composite of VIIRS channels I-01, I-02, and I-03 from 18:18 UTC 10 June 2012

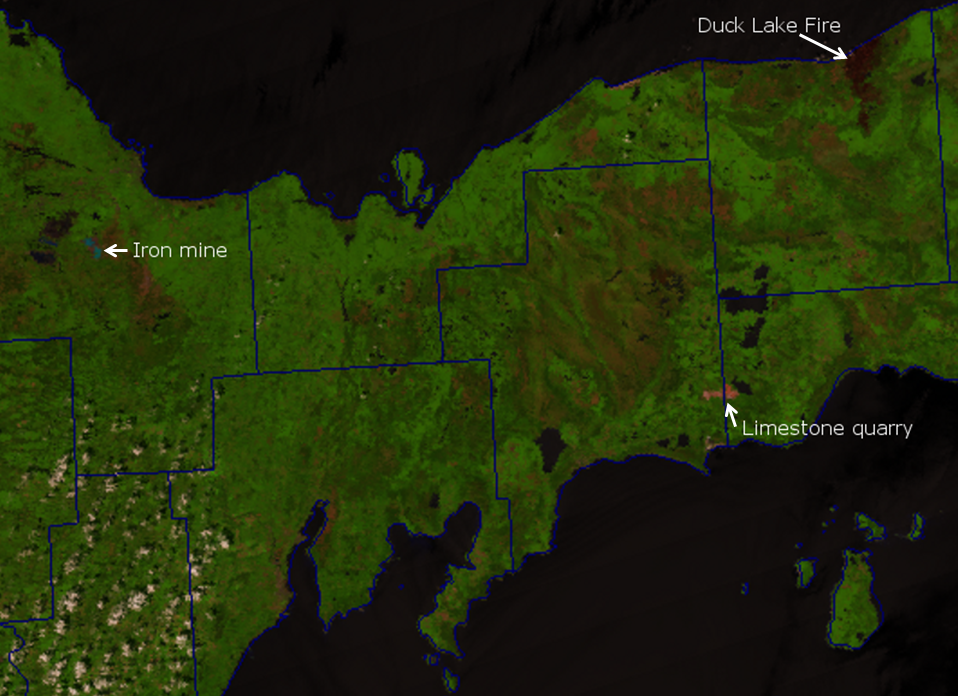
    The Upper Peninsula of Michigan was based on mining for most of its history, and several large mines and quarries still exist, which VIIRS can easily see.

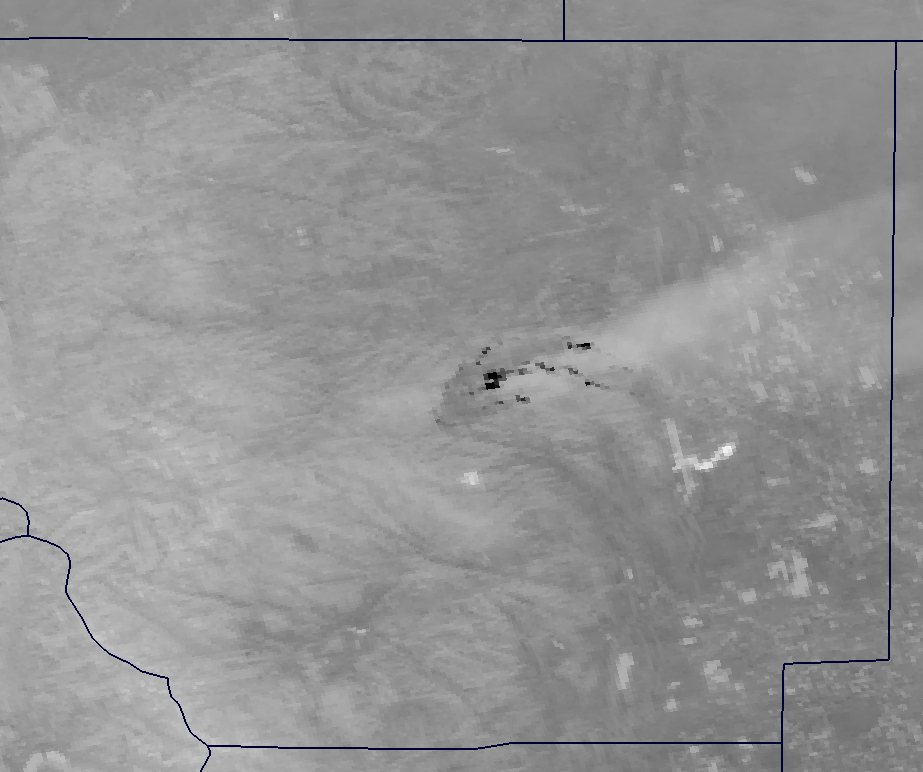
    If you didn’t know any better, you might confuse the iron mine southwest of Marquette, Michigan with a frozen lake, or miraculously un-melted snow leftover from winter, since that is just what snow and ice look like in this kind of RGB composite. Compare that with the true color view of the same area:

    True color RGB composite of VIIRS channels M-3, M-4 and M-5, taken 18:18 UTC 10 June 2012
    True color RGB composite of VIIRS channels M-3, M-4 and M-5, taken 18:18 UTC 10 June 2012

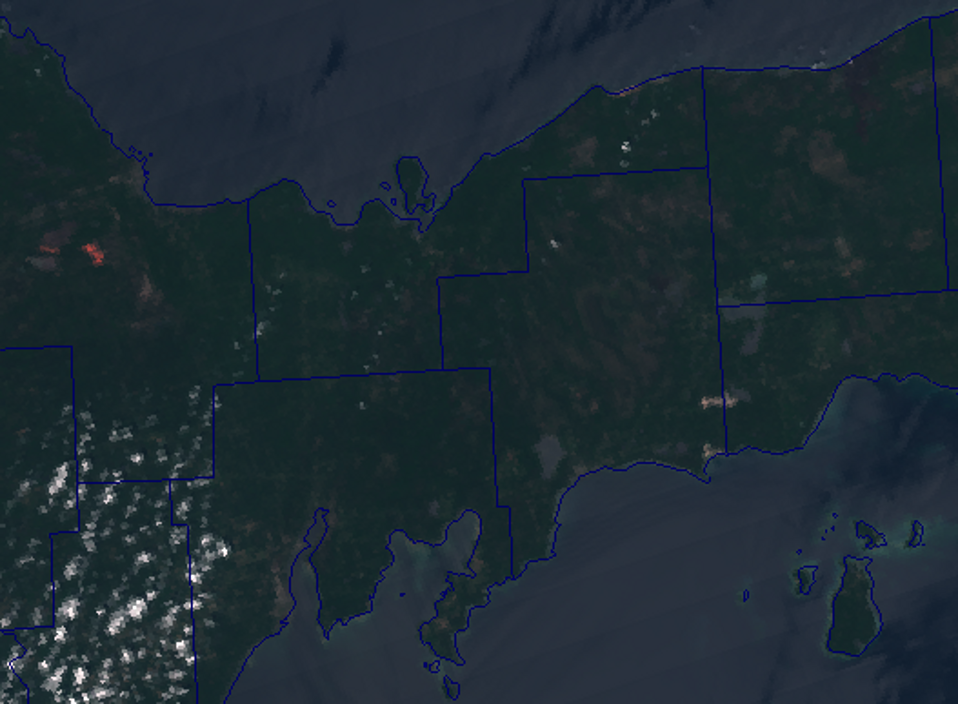
    In this case, the iron mine stands out as a bright red. Why?

    The true color composite uses wavelengths at 0.48 µm (blue), 0.55 µm (green) and 0.67 µm (red). The red channel in the true color composite is actually in the red portion of the visible spectrum. The blue channel in the false color composite (0.64 µm) is also in the red portion of the visible spectrum.

    This example shows that the iron oxide (rust) produced at the iron mine is highly reflective in the red portion of the visible spectrum. That’s what gives it the characteristic rust color. Iron oxide is not nearly as reflective at shorter or longer wavelengths, so it shows up blue when red wavelengths are used as the blue channel (as in the false color composite) and red when they are used as the red channel (as in the true color composite).

    Let this be a lesson to anyone who uses the false color composite as part of a snow and ice detection algorithm. Snow and ice are not the only things to show up that color. You may be looking at a really large iron mine.

  • A Wild Week of Wildfires

    The last few weeks have been filled with lightning-ignited wildfires across the United States. The County Line Fire, along the Florida-Georgia border was caused by lightning on 5 April 2012 and burned ~35,000 acres. The Whitewater-Baldy Complex (began 16 May 2012) – the largest wildfire in New Mexico history – started as two different fires (both caused by lightning) that merged together. It’s over 280,000 acres (that’s not a typo) and continues to burn (as of 13 June 2012). The Duck Lake Fire (began 24 May 2012) burned 21,000 acres of Michigan’s Upper Peninsula and was caused by lightning. The Little Bear Fire (began 4 June 2012), also in New Mexico, was caused by lightning and has burned ~37,000 acres.  Much closer to home, the High Park Fire (began 9 June 2012) is already the largest wildfire in Larimer County history and the third largest fire in Colorado history. It has burned ~46,000 acres and I bet you can guess what caused it.

    It’s not clear who is to blame here – there is a long list of suspects – but I bet it was Thor. Even though the U.S. is generally the domain of the Thunderbird, Thor has a mountain-crushing hammer called Mjöllnir, which makes him as good a suspect as any. He may have been in cahoots with Indra or Marduk who are the bringers of rain, and have been holding back on us. Look at how dry it has been across the majority of the country.

    With all of these fires, it’s hard to know where to begin. We’re going to ignore the County Line Fire as it was put out over a month ago. We’re also going to ignore the Whitewater-Baldy Complex, as it is so big, it can be seen by GOES. (Kidding! We kid because we love.) Plus, it’s been done before. The VIIRS view of the High Park Fire has also been looked at by CIMSS, with an interesting comparison between VIIRS and MODIS.

    What we are going to do is show off interesting features of some of these fires that haven’t been shown or discussed before (as far as we know). We begin with “saturation”. Both the High Park Fire and Little Bear Fire saturated the VIIRS 3.7 µm channels (I-04 and M-12):

    Channel I-04 image of the Little Bear Fire from VIIRS taken 20:16 UTC 9 June 2012
    Channel I-04 (3.7 µm) image of the Little Bear Fire from VIIRS taken 20:16 UTC 9 June 2012
    Channel M-12 image of the Little Bear Fire from VIIRS taken 20:16 UTC 9 June 2012
    Channel M-12 (3.7 µm) image of the Little Bear Fire from VIIRS taken 20:16 UTC 9 June 2012
    Channel I-04 image of the High Park Fire from VIIRS taken 19:59 UTC 10 June 2012
    Channel I-04 (3.7 µm) image of the High Park Fire from VIIRS taken 19:59 UTC 10 June 2012
    Channel M-12 image of the High Park Fire from VIIRS taken 19:59 UTC 10 June 2012
    Channel M-12 (3.7 µm) image of the High Park Fire from VIIRS taken 19:59 UTC 10 June 2012

    The top two images are of the Little Bear Fire, which formed near the border of Lincoln and Otero counties in New Mexico. The bottom two images are of the High Park Fire in Larimer County, Colorado. For each fire, the high resolution 3.7 µm channel (I-04) is compared with the moderate resolution 3.7 µm channel (M-12). The colors range from white (cold) to black (hot). But, wait a minute! If white is cold, why are there white pixels mixed in with the black ones that indicate the hot spots? That’s because these channels are saturating and experiencing “fold-over”. The peak brightness temperatures these channels can measure is ~ 367 – 368 K. Anything warmer than that won’t be detected, so the channel is said to be saturated. When it really gets above that limit you can have “fold-over”, where not only are you not observing the higher, correct temperature, the detectors actually report a lower temperature or radiance. In these fires, the fold-over is resulting in brightness temperatures down to 203 K for M-12 and 208 K for I-04, which is about 90-100 K colder than even the area surrounding the fires!

    Luckily, VIIRS has a 4.0 µm channel (M-13) that was designed to not saturate at the temperature of typical wildfires. Compare the hottest pixels in the M-13 images below with the fold-over pixels from M-12 and I-04 above:

    Channel M-13 image of the Little Bear Fire from VIIRS taken 20:16 UTC 9 June 2012
    Channel M-13 (4.0 µm) image of the Little Bear Fire from VIIRS taken 20:16 UTC 9 June 2012
    Channel M-13 image of the High Park Fire from VIIRS taken 19:59 UTC 10 June 2012
    Channel M-13 (4.0 µm) image of the High Park Fire from VIIRS taken 19:59 UTC 10 June 2012

    The hottest pixel in M-13 reached a temperature of 588 K for the Little Bear Fire and 570 K for the High Park Fire – over 200 K warmer than the saturation points of M-12 and I-04!

    These fires were so hot, they appeared in channels that don’t usually show a fire signal. Limiting our attention to the High Park Fire (which was almost literally in our back yard), here’s the I-05 (11.5 µm) image from 10 June 2012:

    Channel I-05 image of the High Park Fire from VIIRS taken 19:59 UTC 10 June 2012
    Channel I-05 (11.5 µm) image of the High Park Fire from VIIRS taken 19:59 UTC 10 June 2012

    The highest temperature observed in I-05 was 380 K. Longer wavelength channels, such as in I-05 are less sensitive to sub-pixel hot spots than channels in the 3.7 – 4.0 µm range, so fires don’t often show up. For pixels to have a 380 K brightness temperature in I-05, it means that the average temperature over the entire pixel had to be above +100 °C – hot enough to boil water!

    Fires don’t often show up at shorter wavelengths, either, because the amount of solar radiation usually dwarfs any signal from the Earth’s surface. But, the High Park Fire did reach saturation at 2.25 µm (M-11):

    Channel M-11 image of the High Park Fire from VIIRS taken 19:59 UTC 10 June 2012
    Channel M-11 (2.25 µm) image of the High Park Fire from VIIRS taken 19:59 UTC 10 June 2012

    The color scale has been reversed so that it is more inline with visible imagery. The white pixels represent saturation in M-11 at a radiance of 38 W m-2 µm-1 sr-1. The reflectance of these pixels saturated at a value of 1.6, which means that the amount of radiation detected in this channel was more than 1.6 times the amount you would expect to see if the surface was a perfect mirror reflecting all the solar radiation back to the satellite. Thus, the fire’s contribution to the total radiance was significant in this channel.

    The contribution from the surface (i.e., the fire) was also visible in the 1.6 µm channel (M-10), but it isn’t exciting enough to show. One channel shorter down on VIIRS (M-9, 1.38 µm) and the signal disappears against the high reflectivity of the smoke plume.

    It’s impossible to leave out the Day/Night Band, which shows just how large and how close the High Park Fire got to Fort Collins:

    Day/Night Band image of the High Park Fire from VIIRS taken 09:58 UTC 11 June 2012
    Day/Night Band image of the High Park Fire from VIIRS taken 09:58 UTC 11 June 2012. Image courtesy Dan Lindsey.

    The smoke plume, while not exactly visible, is affecting the view of the east side of the fire and Fort Collins, making them appear more blurry than they would if the sky were completely clear. You can also see that, overnight on 11 June 2012, the fire covered an area larger than any of the cities visible in the image (except for Denver, which is mostly cropped off the bottom of the image).

    Hopefully, Marduk will start doing his job and bring us some rain and these will be the last fires for a while.

  • Cape Verde Waves and Plumes

    Cape Verde is an island nation off the west coast of Africa, located in the North Atlantic. The islands are a popular initiation point for tropical storms. The original capital of the 10-island archipelago was sacked twice by Sir Francis Drake, the same one who, in his later years, would fail to sack the villages along Lake Maracaibo in Venezuela due to Catatumbo lightning. That guy really got around, and I mean that literally: he circumnavigated the globe between 1577 and 1580, sacking nearly every village and boat he came across. But, this isn’t about Francis Drake – it’s about the Cape Verde islands and the amazing view of them captured by VIIRS.

    False color RGB composite of VIIRS channels I-1, I-2 and I-3 taken 14:41 UTC 6 June 2012

    Can you see the 10 major islands? One of them (Santa Luzia) is almost obscured by clouds. If you click on the image, you’ll see each of the major islands identified. Go ahead and click on it. It will help for later.

    The image above was made from the RGB composite of VIIRS high-resolution imagery channels I-01, I-02 and I-03. While it technically is a false color image (uses reflectance at 0.64 µm [blue],  0.865 µm [green] and 1.61 µm [red]), it looks realistic in many situations, so that we refer to it as “pseudo-true color”. Snow and ice show up as an unrealistic blue, however, which is the main difference between it and a “true color” image. You might also notice a few more differences between the “pseudo-true color” image above and the “true color” image below.

    True color RGB composite of VIIRS channels M-3, M-4 and M-5 taken 14:41 UTC 6 June 2012

    The true color image uses moderate resolution channels M-3 (0.48 µm, blue), M-4 (0.55 µm, green) and M-5 (0.67 µm, red), which actually observe radiation in the blue, green and red portions of the visible spectrum. Apart from differences in resolution, the vegetation on the islands shows up a bit better in the “pseudo-true color” image. The islands just look brown in the true color image.

    What is particularly interesting about these images are the visible effect that the islands have on the local atmosphere. Downwind (southwest, or to the lower left) of Sal, Boa Vista, and Maio, you can see singular cloud streets, much like the flow of water around a rock. In the photograph in that link, you can see how the water dips downward on both sides of the center line downstream of the rock, and upward in the middle (along the center line). The islands are acting like rocks in the atmosphere, causing upward motion behind them, and this lift was enough to form cloud streets. On either side of these cloud streets there is downward motion and, as a result, clear skies.

    Downwind of São Nicolau, São Vicente and Santo Antão, the cloud streets highlight von Kármán vortices and vortex shedding, which you can see in more-controlled lab conditions here on YouTube and in this YouTube video.

    Many of the islands appear to be producing their own aerosol plumes (i.e. dust), and if you zoom in on the area between Boa Vista and Santiago, you can see gravity waves present in some of the plumes (highlighted by the arrows in the image below).

    False color RGB composite of VIIRS channels I-1, I-2 and I-3 taken 14:41 UTC 5 June 2012

    A common way to detect dust is the “split-window difference”: the difference in brightness temperature between the 11 µm channel and the 12 µm channel. On VIIRS, this means subtracting M-16 from M-15 which, when you do that, gives you this image:

    Split-window difference from VIIRS (M15 minus M16) from 14:41 UTC 5 June 2012

    The color scale goes from -0.16 K (black) to +4.0 K (white). For some reason, the dust or aerosol plumes don’t produce a strong signal here. It may be that the dust is too low in the atmosphere and the lack of temperature contrast with the surface prevents a strong signal. Maybe water vapor absorption effects in M16 are washing out the signal. Or, there could be some other explanation waiting to be discovered.

    The plumes are highly reflective in the 3.7 µm channel (M-12), as are the clouds, which show up as warm spots in the image below (not as warm as the islands, however):

    Moderate resolution 3.7 µm image (M-12) from VIIRS, taken 14:14 UTC 5 June 2012

    Here, just to throw you off, the color scale has been reversed so that dark colors mean higher values. The scale ranges from 295 K (white) to 330 K (black). When you take the difference of this image and the 10.6 µm brightness temperature (M-15), the clouds and aerosol plumes really show up, along with the gravity waves and vortices:

    Brightness temperature difference between VIIRS channels M-12 and M-15 from 14:14 UTC 5 June 2012

    In this case, the M-12 brightness temperatures are always greater than the M-15 brightness temperatures (due to the combination of Earth’s emission and solar reflection in M-12 as opposed to just surface emission in M-15), so the scale varies from +5 K (black) to +30 K (white). Higher (brighter) values on this scale show off where the most solar reflection occurs at 3.7 µm – the liquid clouds and aerosol plumes.

    There are much more sophisticated ways of identifying dust and aerosol plumes. To find out more, check out this article from nrl.navy.mil written by one of our resident experts, Steve Miller, who is currently working on applying dust detection algorithms to VIIRS.

    If you are more interested in the von Kármán vortices, NASA has put together a great page that you can visit here. If you take the original image in this post, zoom out and rotate it a little bit, you can get a sense of just how far the vortices extend from their parent islands:

    False color RGB composite of VIIRS channels I-1, I-2 and I-3 taken 14:41 UTC 5 June 2012

    Coincidentally, this image has been cropped to a size that makes it suitable for use as a desktop wallpaper, should you happen to have a 16:9-ratio monitor and a desire to stare at this image all day. (You have to click on the image, then click on the “1920 x 1080” link below the header to get the full resolution image.)

  • Catatumbo Lightning in the Day/Night Band

    You may have noticed that many of the recent posts have featured imagery from the VIIRS Day/Night Band (DNB). That’s because the nighttime imagery produced by the DNB is so awesome! The DNB has seen clouds at night, auroras, forest fires, oil and gas flares, and even volcanic eruptions. Many of the previous images shown have included high resolution views of city (and even small town) lights. This post shows another interesting facet of DNB imagery: lightning. More specifically, Catatumbo lightning.

    For those of you who don’t know (and didn’t click on that last link), Catatumbo lightning is one of the world’s most frequent lightning displays, with thunderstorms forming over the Catatumbo River in Venezuela an average of 160 nights per year. The lightning displays last up to 9 hours, beginning shortly after dusk. The lightning is nearly continuous and so vivid and reliable that it has been called the “Lighthouse of Maracaibo” or the “Catatumbo Lighthouse”, as fisherman and sailors have historically used it as a navigation aid. It is said that the locals were saved from an invasion by Sir Francis Drake in 1595, as the invading navy could not covertly enter Lake Maracaibo at night due to all the bright lightning. There is even a campaign to make Catatumbo lightning a UNESCO world heritage site. The lightning is so prominent, the state of Zulia in Venezuela has included it in their flag and coat of arms. Two years ago, the storms suddenly stopped for several months, causing mass panic in the streets- I mean, on the river- I mean… um, actually the villagers in this video don’t seem to care all that much.

    Earlier this month, when the moon was about 80% full, Suomi NPP passed over Lake Maracaibo at night and, sure enough, a thunderstorm was present right over the mouth of the Catatumbo River.

    VIIRS I-05 image of thunderstorms near Lake Maracaibo, Venezuela taken 06:44 UTC 10 May 2012
    VIIRS I-05 image of thunderstorms near Lake Maracaibo, Venezuela taken 06:44 UTC 10 May 2012

    This image, taken from the high resolution imagery IR-window channel (I-05, 11.45 µm) on 10 May 2012, shows the deep convection over Venezuela and Colombia. The largest thunderstorm near the center of the image formed along the shore of Lake Maracaibo, near the mouth of the Catatumbo River. Here’s what the DNB saw at the same time:

    VIIRS Day/Night Band image of thunderstorms near Lake Maracaibo, Venezuela taken 06:44 UTC 10 May 2012
    VIIRS Day/Night Band image of thunderstorms near Lake Maracaibo, Venezuela taken 06:44 UTC 10 May 2012

    The bright, almost rectangular streaks in the image are lightning strikes. The red arrow points out a lightning strike from the Catatumbo storm – a “Catatumbo lightning” strike, if you will.

    The blocky appearance of lightning is due to the fact that VIIRS is a scanning radiometer. As the instrument scans the swath of the Earth that it sees, a bright, transient flash (such as from lightning) will show up in the along-scan direction as an individual streak of light in each sensor. The DNB has 16 different sensors that scan the swath simultaneously, and since lightning typically stretches over a large enough area to be detected by all of them, you get 16 different streaks all lined up next to each other. By the time the sensors have rotated back around for the next scan, the lightning flash has ended, producing abrupt edges in the direction along the satellite track. Compare this with the DMSP Operational Linescan System, which produces much more “streaky” lightning.

    In addition to the “Catatumbo lightning”, you can see several other lightning flashes in the two deepest thunderstorms over Colombia. These are far enough away from Lake Maracaibo that they probably don’t count as Catatumbo lightning.

    Other interesting features can be seen in these images as well. The moon was bright enough to cast shadows in the DNB image, allowing for the detection of the overshooting tops. These match-up with the coldest brightness temperatures in the I-05 image (which show up as dark blue to pure white in this color scale). A few pixels in the largest storm over Colombia (the one with two visible lightning flashes) have managed to make it to pure white on the color scale, indicating temperatures below 190 K (-83 °C). The dark blue pixels indicate brightness temperatures between 196 and 190 K (-77 to -83 °C). Brrr.

    Overshooting tops exist when the convection is so vigorous, it peaks out above the anvil of the storm and penetrates the stable layer above (which is usually the stratosphere in storms this deep). In addition to acting as an indicator for severe weather, overshooting tops are important for energy and chemical transport between the troposphere and stratosphere.

    It’s also interesting to see what looks like thin cirrus over the Caribbean Sea near Panama (left center of the image) that show up in the infrared (I-05) image, but not in the DNB. Plus, a number of cold clouds over Venezuela would appear to be optically thick due to their low brightness temperatures in the infrared image (yellow starts at 245 K down to green at 214 K), but they are optically thin enough to see city lights below in the DNB image. Awesome!

  • The Hewlett Fire

    According to reports, a man camping along the Hewlett Gulch trail in Roosevelt National Forest on 14 May 2012 had his camping stove knocked over in a gust of wind. One week (and $2.9 million) later, the Hewlett Fire scorched more than 7600 acres before fire crews could gain the upper hand. At one point 80 homes were evacuated but, thankfully, none of them were damaged. The smoke plume could be seen as far away as Laramie, Wyoming. Less than 20 miles away from the Cooperative Institute for Research in the Atmosphere, our home, it certainly caught our attention.

    VIIRS aboard Suomi NPP monitored the fire day and night. About an hour after the fire was first reported, VIIRS captured the hot spot in channel I-04 (3.7 µm):

    Image of the Hewlett Fire from VIIRS channel I-04, 20:05 UTC 14 May 2012
    Image of the Hewlett Fire from VIIRS channel I-04, 20:05 UTC 14 May 2012

    In the above image, the warmest (darkest) pixel had a brightness temperature of 350 K.  A simple RGB composite of channels I-01 (0.64 µm), I-02 (0.87 µm) and I-03 (1.61 µm), with no other manipulation, from the same time as the I-04 image above, produces a red spot right over the I-04 hot spot:

    False color RGB composite of VIIRS channels I-01, I-02 and I-03, 20:05 UTC 14 May 2012
    False color RGB composite of VIIRS channels I-01, I-02 and I-03, 20:05 UTC 14 May 2012

    Perhaps more amazing (but less useful from a firefighting perspective) is that, if you look closely (and you know the geography of the area), you can make out the locations of the following highways: I-25, I-76 and I-80, plus the main Union Pacific railroad tracks that more-or-less parallel I-80 in southern Wyoming. The high resolution imagery bands on VIIRS have enough resolution to identify interstate highways!

    Suomi NPP passed over the area that night (15 May 2012) and the Day/Night Band (DNB) captured the fire burning brightly:

    Day/Night Band image of the Hewlett Fire, 08:25 UTC 15 May 2012
    Day/Night Band image of the Hewlett Fire, 08:25 UTC 15 May 2012. Image courtesy Dan Lindsey.

    By the time of the 17 May 2012 nighttime overpass – two days later – the fire had grown significantly. With no clouds around, the DNB easily saw the Hewlett Fire, as it was the brightest thing in the area. The image below has been enhanced to make the nearby city lights easier to see relative to the fire.

    Day/Night Band image of the Hewlett Fire, 09:26 UTC 17 May 2012
    Day/Night Band image of the Hewlett Fire, 09:26 UTC 17 May 2012

    In the above image, lights from various cities have been identified. The red arrow indicates the Hewlett Fire, which was bright enough and large enough to be confused for a city. The yellow arrow indicates what might be oil and/or gas flares burning in rural Weld County, which you can also see in the 15 May 2012 DNB image. Weld County is home to a third of all the oil and gas wells in Colorado.

    In this zoomed-in image, you can see that the light from the fire covered an area approximately one third the size of Fort Collins:

    Zoomed Day/Night Band image of the Hewlett Fire, 09:26 UTC 17 May 2012
    Zoomed Day/Night Band image of the Hewlett Fire, 09:26 UTC 17 May 2012. Image courtesy Dan Lindsey.

    This image was taken before the burn area even reached its maximum size. At the same time, channel I-04 also saw this ring of fire (not to be confused with the “ring of fire” caused by the recent annular eclipse):

    VIIRS channel I-04 image of the Hewlett Fire, 09:26 UTC 17 May 2012
    VIIRS channel I-04 image of the Hewlett Fire, 09:26 UTC 17 May 2012

    Once again, darker colors indicate higher brightness temperatures. The peak temperature in channel I-04 at this time was 356 K.

    Even though it caused no damage to homes or structures, it was a little too close for comfort for many people.

    As a final note, our partners up the hill in the Department of Atmospheric Science have taken an interest in the Hewlett Fire. If you are interested in the non-satellite side of the research into this fire, research groups led by Professors Rutledge, Kreidenweis and Collett have collected radar observations and in situ aerosol samples of the smoke plume. Contact them for more information.