• Popocatépetl, the Smoking Mountain

    According to legend, Popocatépetl was a great warrior whose girlfriend, Iztaccíhuatl, died because her father was a jerk who lied. (An alternate story is that it was a rival warrior who was a jerk who lied.) Either way, Iztaccíhuatl was erroneously told that Popocatépetl died in battle, which caused her to die of grief. When Popoca, as he was known to his buddies, returned to find out that she was dead, he was very sad. Reports on what followed differ, but Popoca either died of grief himself, or committed suicide at the thought of living without Iztaccíhuatl. To commemorate these events, the gods turned them both into mountains. To this day, the mountain Popocatépetl spews out rock and ash and fire either because he’s still mad at what happened, or because it is his way of looking out for his girlfriend.

    The name Iztaccíhuatl literally means “White Woman,” and is the name of the snow-covered mountain ~40 miles southeast of Mexico City. Popocatépetl literally means “Smoking Mountain,” and is the name given to the volcano just to the south of Iztaccíhuatl. It is one of Mexico’s most active volcanoes.  Ole’ Popoca has recently begun to remind us that he is mad (or eternally vigilant).

    The alert level was raised in mid-April after the volcano was heard rumbling and once again began spewing ash over the region. If you clicked on that link, you might have noticed this sentence:

    “The joint NOAA-NASA Suomi NPP satellite snapped a picture of the ash cloud coming from Popocatépetl on April 16.”

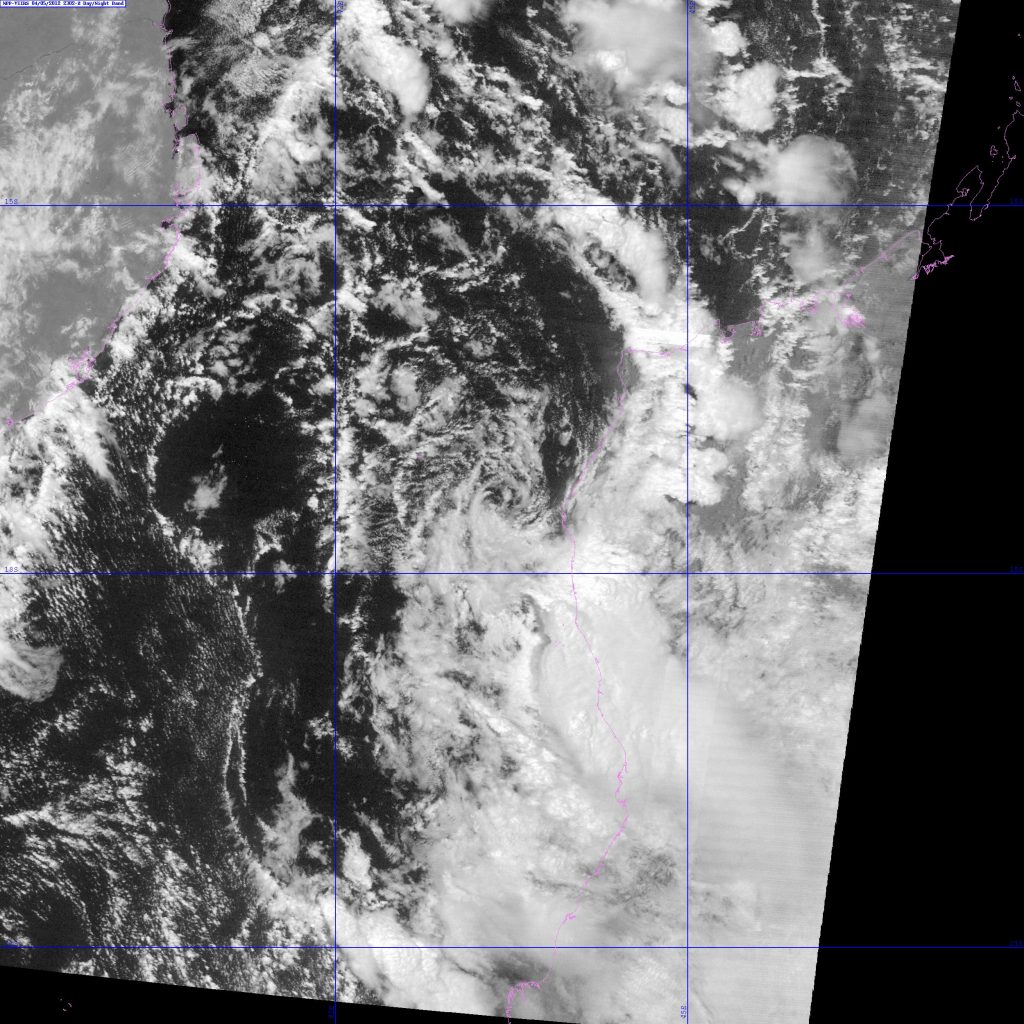
    Although they forgot to include the picture in the article, VIIRS on board Suomi NPP did see the ash cloud. Here’s an image of the I-01 reflectance (white = 1, black = 0) taken by VIIRS on 16 April 2012 at 20:25 UTC:

    Image of Popocatépetl's ash plume from VIIRS channel I-01, 20:25 UTC 16 April 2012
    Image of Popocatepetl's ash plume from VIIRS channel I-01, 20:25 UTC 16 April 2012

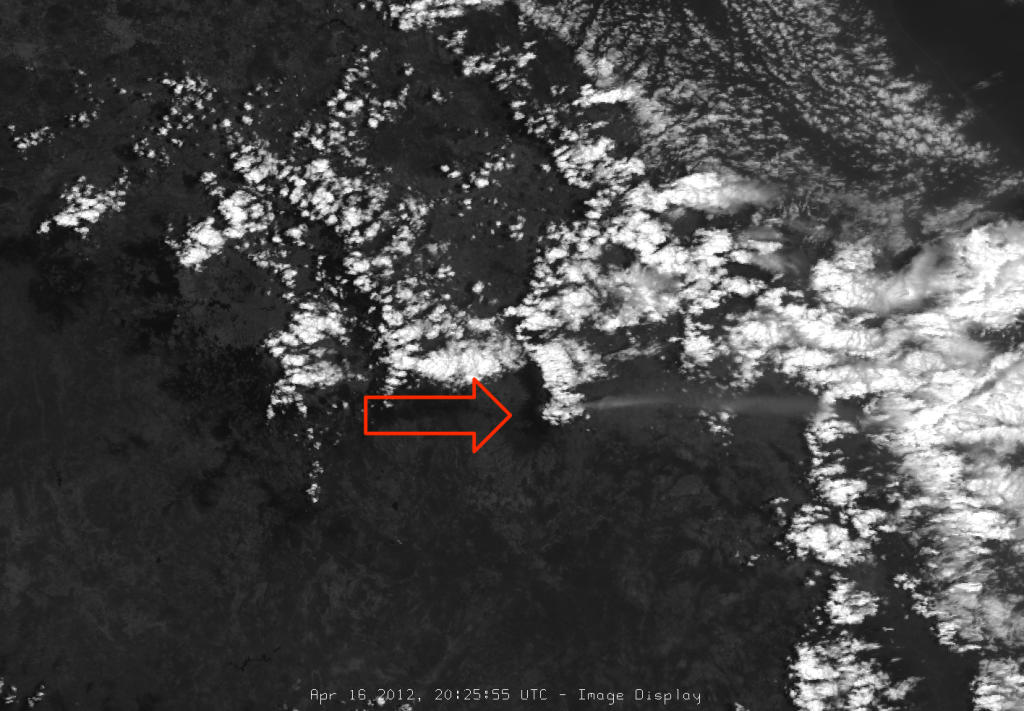
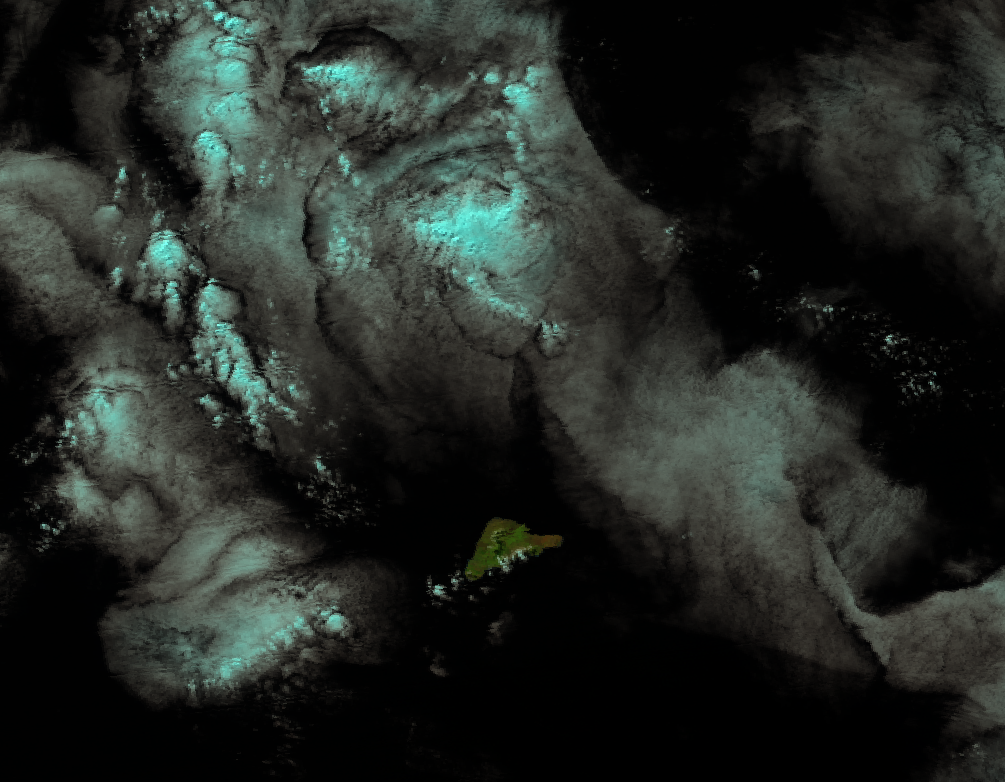
    The ash plume is pushed to the east by the winds surrounding the cloud-covered volcano (where the arrow is pointing). On a clearer day, you can see Popocatépetl, Iztaccíhuatl, Matlacuéyatl, and the tallest volcano in Mexico, Pico de Orizaba:

    False-color RGB composite (I-01, I-02 and I-03) from VIIRS taken at 19:53 UTC 23 May 2012
    False-color RGB composite (I-01, I-02 and I-03) from VIIRS taken at 19:53 UTC 23 April 2012

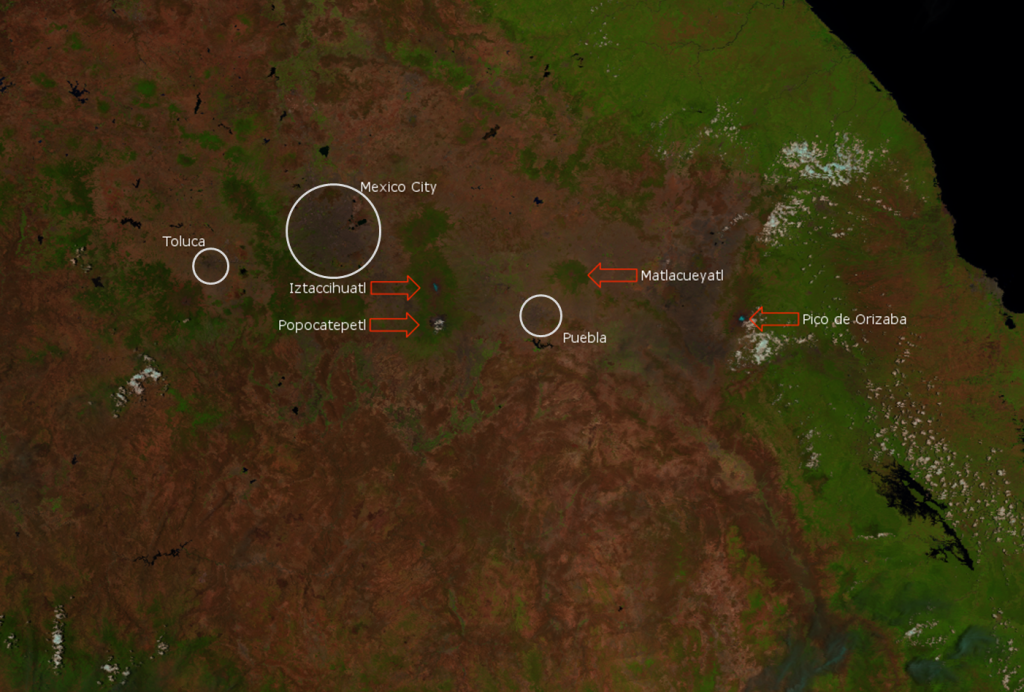
    The above image is a false-color RGB composite of VIIRS channels I-01, I-02 and I-03 taken at 19:53 on 23 April 2012. The volcanoes and nearby urban centers have been identified and labelled. Pico de Orizaba, Popocatépetl, and Iztaccíhuatl are the first, second and third tallest mountains in Mexico, respectively, and are normally the only mountains in Mexico to be snow-covered year-round. The snow on top of Pico de Orizaba and Iztaccíhuatl is clearly visible in the image. Popocatépetl lost its snow during the 1990s when it became more active. But, you can see the cloud of ash and steam from the volcano in the image, which is not being blown around in the wind as much on this day. In fact, you can watch a time-lapse video of the steam and ash cloud from a Mexican government webcam from around the time of the Suomi-NPP overpass where you can see the clouds produced/influenced by The Smoking Mountain.

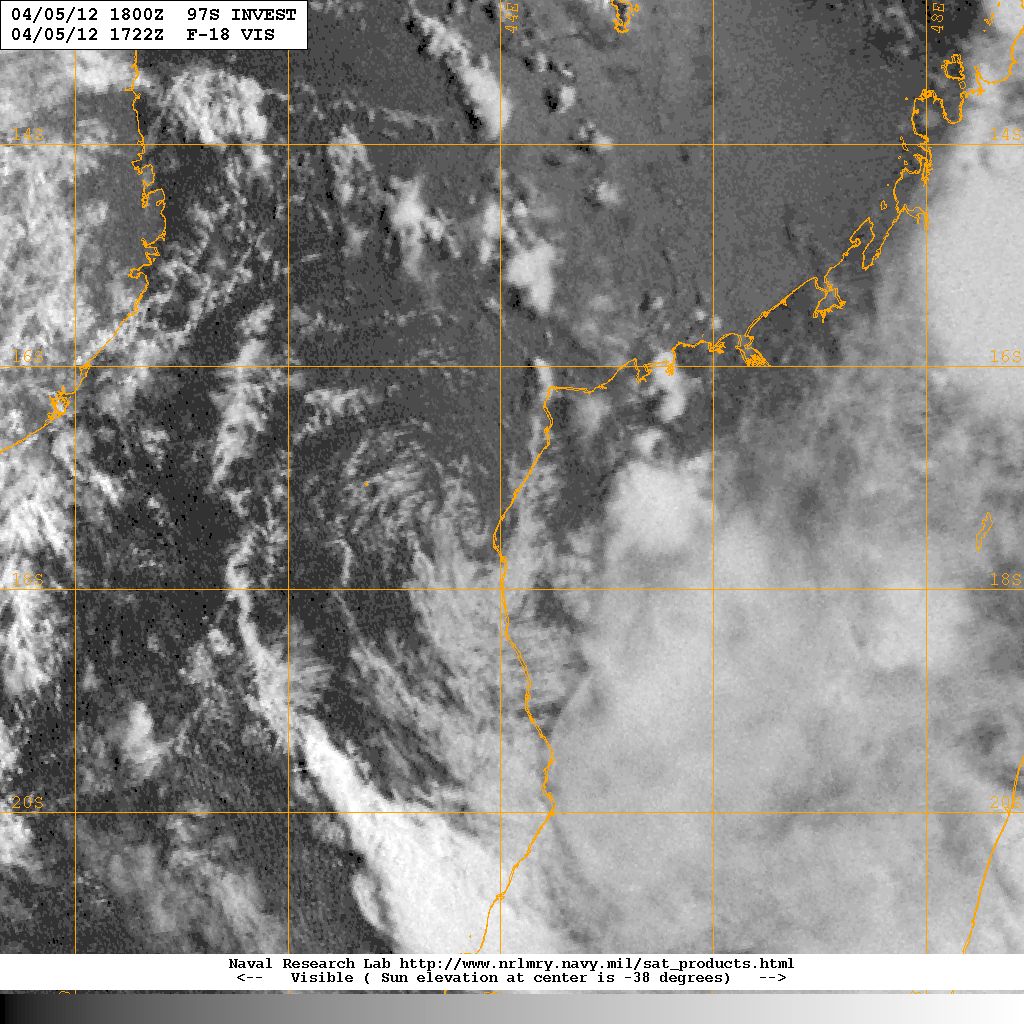
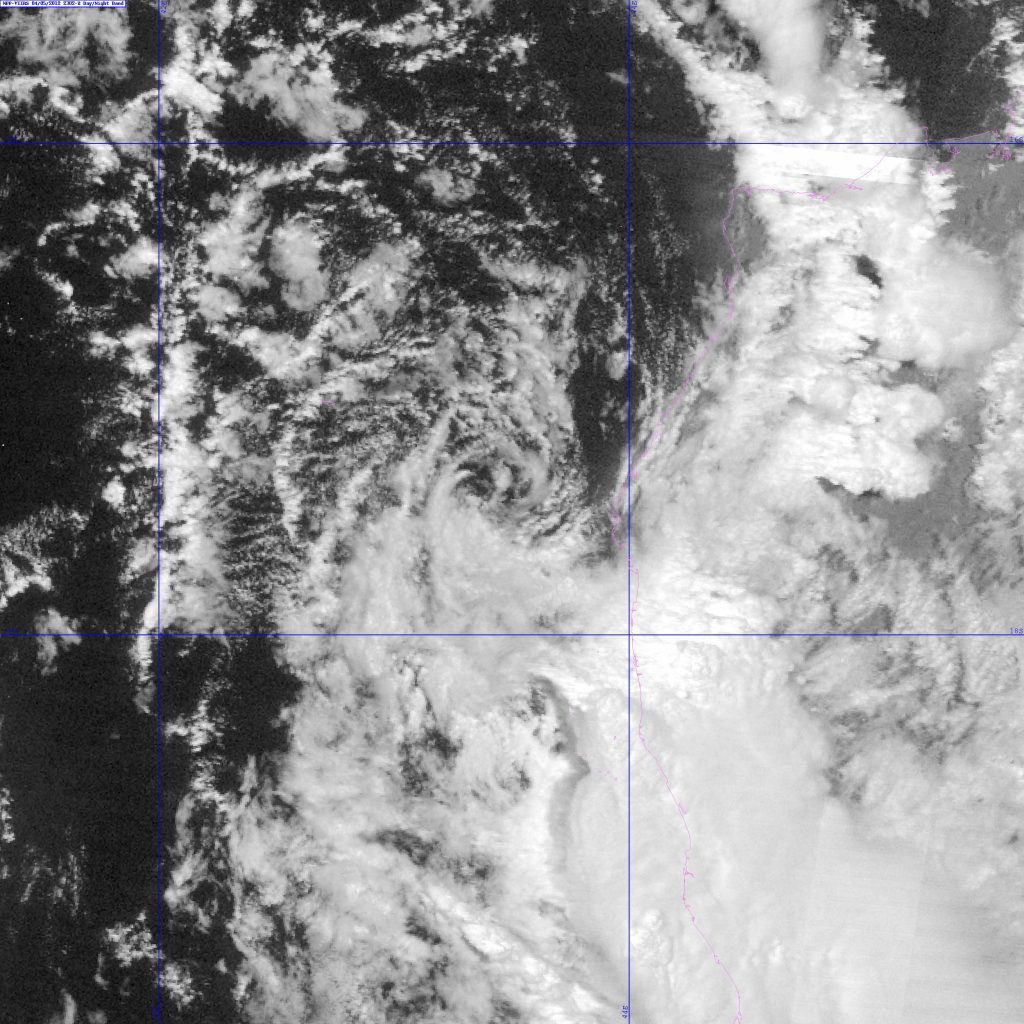
    On 20 April 2012, a photographer captured this amazing image of Popocatépetl’s eruption of lava at night. Being near a new moon (which occurred on 21 April), the Day/Night Band (DNB) was able to see this lava eruption:

    VIIRS Day/Night Band image of the Popocatépetl eruption from 07:58 UTC 20 April 2012
    VIIRS Day/Night Band image of the Popocatepetl eruption from 07:58 UTC 20 April 2012
    VIIRS I-01 image of Popocatépetl taken at 19:53 UTC 23 April 2012
    VIIRS I-01 image of Popocatepetl taken at 19:53 UTC 23 April 2012

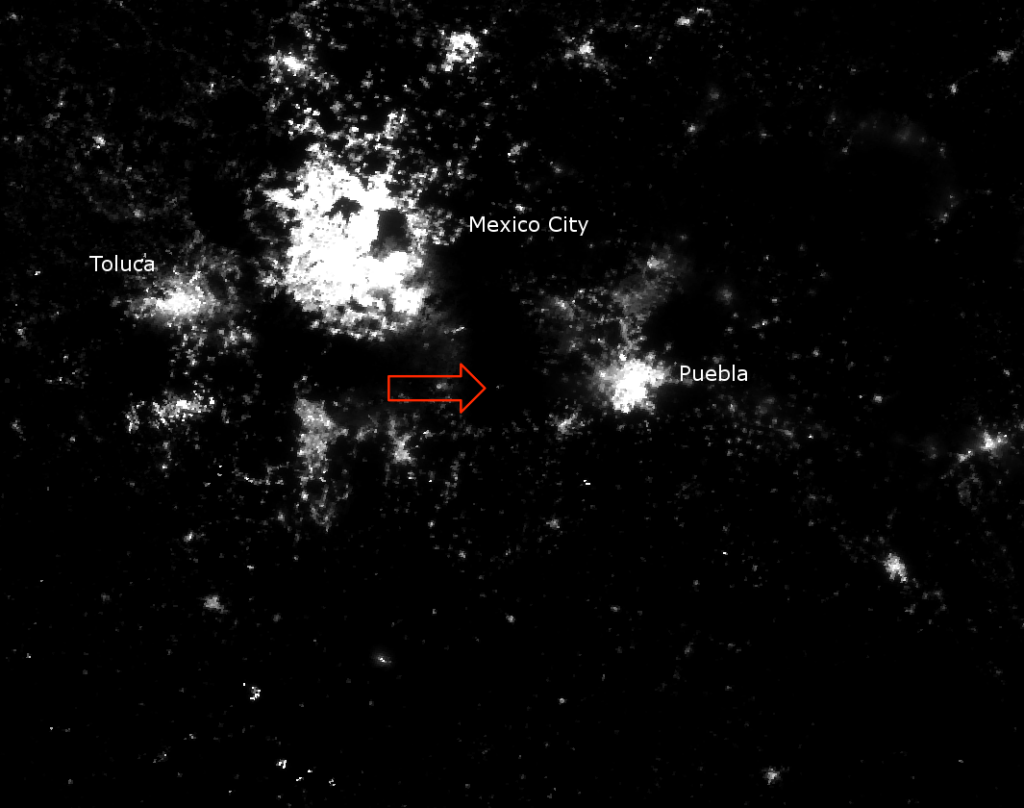
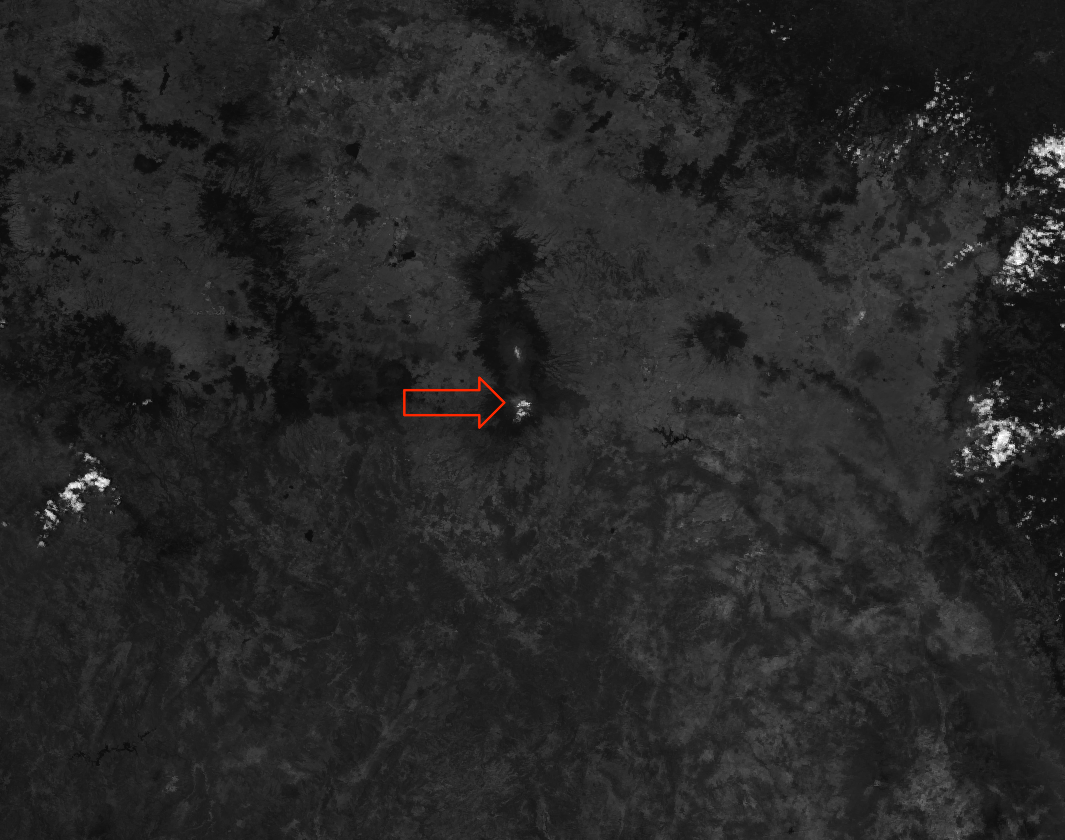
    In the above images, the red arrows are pointing to the same spot – the top of Popocatépetl. The upper image is from the DNB at 07:58 UTC on 20 April 2012, the lower image is from I-01 at 19:53 UTC on 23 April 2012 (the same time as the RGB composite). If you were to overlay the images on top of each other, you would see that the light source visible in the DNB image is right at the top of the volcano. Since there are no towns up there, and people surrounding the volcano have been evacuated, the light is coming from the erupting lava.

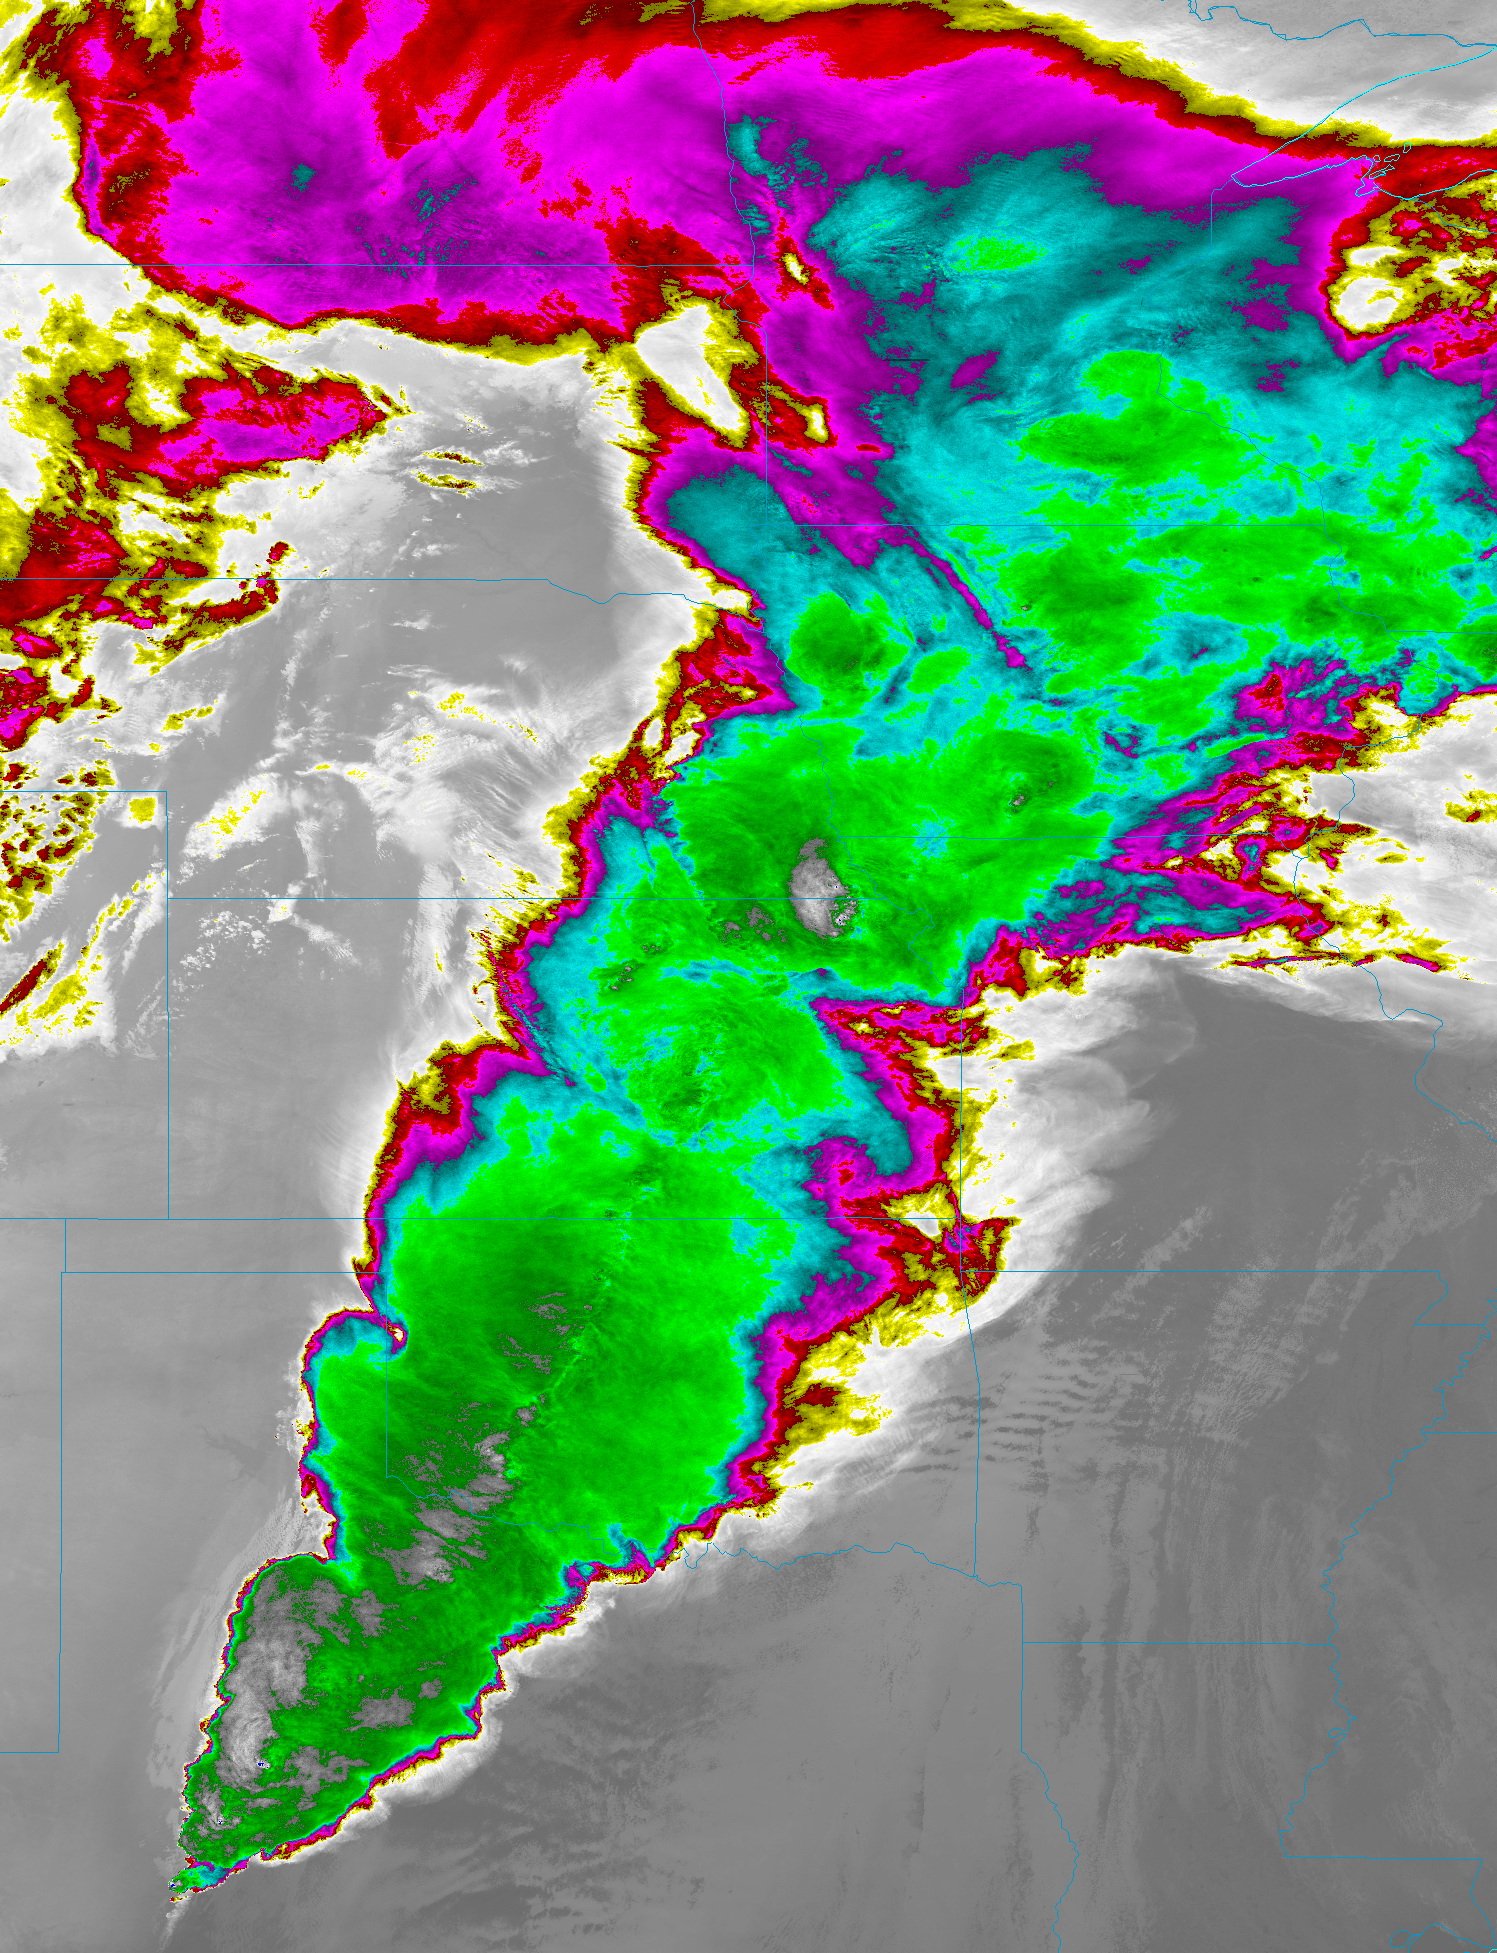
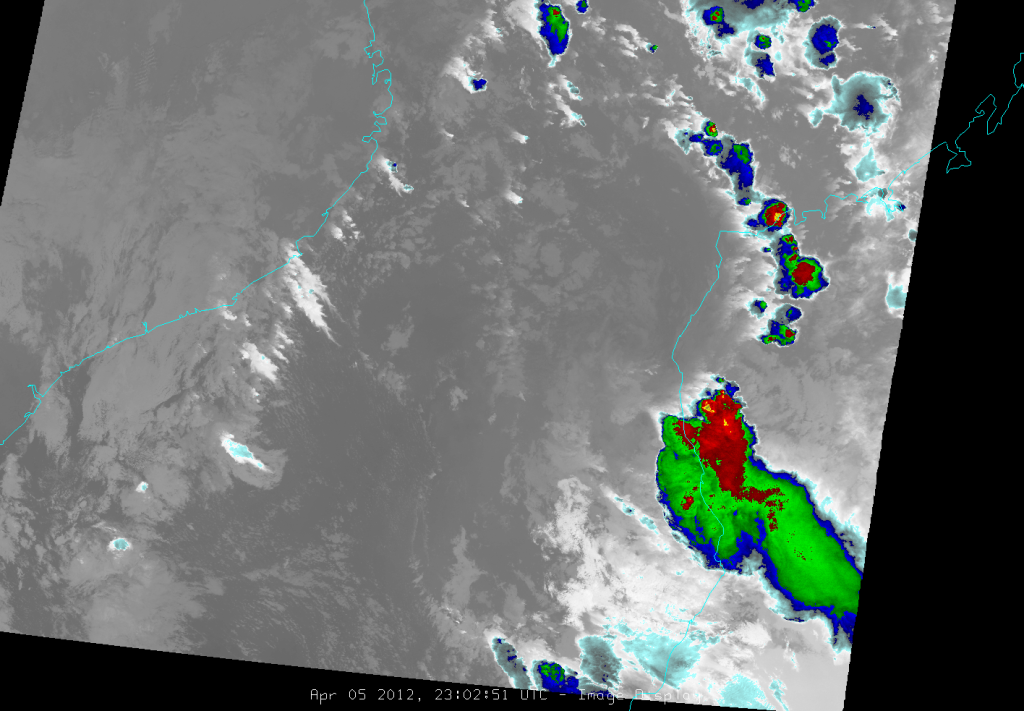
    CIMSS provided these images of the volcano and ash plume at night (the same time as the DNB image above), which were visible in channels I-04 and I-05:

    Image of Popocatépetl from VIIRS channel I-04, 07:58 UTC 20 April 2012
    Image of Popocatépetl from VIIRS channel I-04, 07:58 UTC 20 April 2012 (courtesy William Straka, III / CIMSS)
    Image of Popocatépetl from VIIRS channel I-05, 07:58 UTC 20 April 2012
    Image of Popocatépetl from VIIRS channel I-05, 07:58 UTC 20 April 2012 (courtesy William Straka, III / CIMSS)

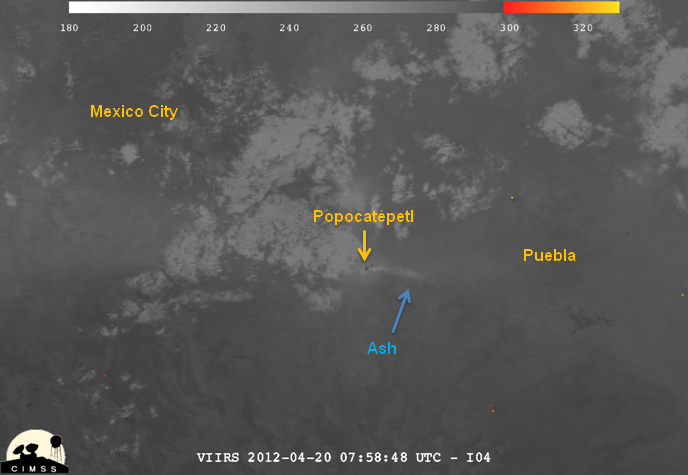
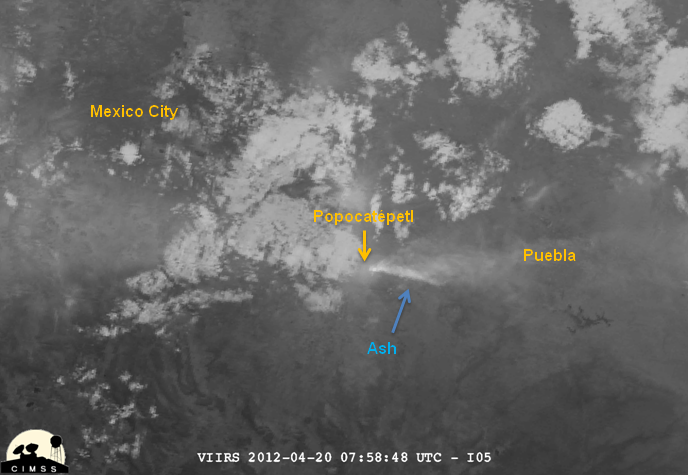
    The upper image is the I-04 image. Channel I-04, at 3.74 µm, is very sensitive to hot spots such as wildfires or, in this case, volcanic eruptions. The dark (warm) spot identified is the heat signature of the molten rock that is erupting from the volcano. The cooler (brighter) ash cloud is visible in the I-04 image, but it shows up more clearly in the I-05 (11.45 µm) image underneath it.

    Someone compiled a time-lapse series of images (14 April – 22 April) of Popocatépetl from a “NASA satellite” (presumably GOES-13) and posted the video to YouTube, which you can watch here.

    Given its proximity to Mexico City, Popocatépetl is on the list of dangerous volcanoes to watch out for. The folks at WIRED are keeping their eye on it. Hopefully, Ole’ Popoca is just letting off a little steam, and not planning to get real violent. His girlfriend died a long time ago – it’s time to just let it go already.

  • Remote Islands, part I: Easter Island

    With the I-bands having ~375 m resolution at nadir, VIIRS is a powerful instrument. We have already seen the detailed imagery it produces of severe thunderstorms and tropical cyclones. But, you might ask (particularly if you’re thinking you need a vacation), what remote islands is it able to see?

    Well, it can see Easter Island. Yes, the one with all the big-headed statues (moai).

    False color RGB composite (I1-I2-I3) image of Easter Island, 20:44 UTC 25 April 2012
    False color RGB composite (I1-I2-I3) image of Easter Island, 20:44 UTC 25 April 2012

    At approximately 24.6 km x 12.3 km, VIIRS has no problem identifying the triangular island, as this false color (I1-I2-I3) RGB composite shows. In this image, taken at 20:44 UTC on 25 April 2012, the 163 km2 island appears to be dwarfed by a thunderstorm just to its north.  If you zoom in, you can see several small cumulus clouds over the island along with their shadows. Unfortunately, it is not quite the resolution needed to see the individual moai.

    As Easter Island is in the southern hemisphere, it is autumn there now. The average high temperature is down to 76 °F (from a summertime peak of 79 °F in February). April and May are listed as the wettest months, so an image of Easter Island not obscured by clouds this time of year may be a rare occurrence.

  • The Last Line of Storms from the 14 April 2012 Tornado Outbreak

    The second major tornado outbreak of the year took place on 14 April 2012 (after the 2 March outbreak that slammed Indiana and Kentucky). At last count, 115 tornadoes were reported from Oklahoma to Iowa. Credit must be given to the Storm Prediction Center, National Weather Service offices, and local TV and other media outlets for accurately predicting the severe weather event and keeping people informed as it happened, and the people of the area for paying attention to the weather. It must be counted as a success on many levels that 115 tornadoes over 4 states only resulted in 6 deaths (and those deaths occurred in the toughest situation to warn people – a rain-wrapped tornado in the middle of the night where the tornado sirens were disabled due to a lightning strike earlier in the day).

    The last bout of severe weather occurred with a squall line that formed in the late evening (~02:30 UTC 15 April 2012) along the dry line in western Texas and quickly expanded into Oklahoma and Kansas. This line produced the deadly tornado in Woodward, OK, along with many reports of 1-2″ diameter hail. Suomi-NPP passed over this line of storms between 07:45 and 07:50 UTC (15 April). The high resolution infrared window band, I-5 (11.45 µm), shows the immense scale of this storm system stretching from Wisconsin and Minnesota to Texas, in great detail. Be sure to click on the image, then on the “1497×1953” link below the banner to see it in full resolution. (The full resolution image is ~2MB in size.)

    View of a squall line over the Central Plains from VIIRS channel I-5, 7:45 UTC 15 April 2012
    View of the squall line over the Central Plains from VIIRS channel I-5, 7:45 UTC 15 April 2012

    The color scale here is the same one used for the 2 March 2012 tornado outbreak image and the 25 January squall line over southeast Texas. The darkest blue pixels visible amongst the white overshooting tops (more easily visible on the southern end of the squall line) have a brightness temperature below -77 C, indicative of very strong convection.

  • VIIRS view of Invest 97S at night

    On 5 April 2012, the Joint Typhoon Warning Center was watching an area of the Mozambique Channel for possible development of a tropical cyclone. This area was named Invest 97S. As 6 April 2012 was a full moon, this is a good case to test the capabilities of low-light visible imagery channels for detection of tropical cyclone development at night.

    The Operational Linescan System (OLS) aboard the Defense Meteorological Satellite Program (DMSP) satellite F-18 has a low-light visible channel (that inspired the development of the Day-Night Band (DNB) for VIIRS). The image below is from this channel on F-18, taken at 17:22 UTC, 5 April 2012 (courtesy the Naval Research Laboratory).

    DMSP OLS low-light visible image of Invest 97S, taken at 17:22 UTC, 5 April 2012
    DMSP OLS low-light visible image of Invest 97S, taken at 17:22 UTC, 5 April 2012. Image courtesy Naval Research Laboratory.

    The landmass on the right of the image is Madagascar with Mozambique on the left side of the image. A low-level circulation is visible in the clouds just off the coast of Madagascar in the center of the image.

    Suomi-NPP passed over the area at 23:02 UTC. The images below are taken from the VIIRS DNB, which is a low-light visible channel (centered at 0.7 µm) with higher radiometric resolution, a higher signal-to-noise ratio and higher spatial resolution. The second image is a zoomed-in version of the first.

    VIIRS DNB image of Invest 97S taken at 23:02 UTC, 5 April 2012
    VIIRS DNB image of Invest 97S taken at 23:02 UTC, 5 April 2012. Image courtesy Dan Lindsey and Steve Miller.
    Zoomed-in image of Invest 97S from the VIIRS DNB taken at 23:02 UTC, 5 April 2012
    Zoomed-in image of Invest 97S from the VIIRS DNB taken at 23:02 UTC, 5 April 2012. Image courtesy Dan Lindsey and Steve Miller.

    In the nearly six hours that elapsed between the DMSP OLS image and the VIIRS DNB image, you can see that the line of deeper convection to the southwest of the circulation center has moved further south away from the center of the circulation and outflow from these storms has cleared out the low level clouds from where the storms used to be.

    Compare these images with the high-resolution infrared window channel (11.45 µm), I-5, from VIIRS, seen below.

    VIIRS channel I-5 image of Invest 97S, taken at 23:02 UTC, 5 April 2012
    VIIRS channel I-5 image of Invest 97S, taken at 23:02 UTC, 5 April 2012.

    The low level circulation is difficult to distinguish, given that there is no significant temperature contrast between the low level clouds and the background (ocean) surface. The deeper convective clouds are easy to spot in I-5, however.

    The information provided by the VIIRS DNB near full moon events would be a great help to tropical cyclone forecasting in cases such as this where, typically, only IR data is available at night. Assuming latency issues with VIIRS can be solved, of course.

    In the end, Invest 97S failed to develop into a tropical cyclone, which spared Madagascar and Mozambique – both of which had been affected by the cyclones Giovanna and Funso earlier this year.

  • Time-lapse of the Lower North Fork Fire

    On 26 March 2012, strong winds, high temperatures and low humidities re-ignited embers from a controlled burn that took place the previous week near Conifer, CO. The Lower North Fork fire quickly spread in the high winds, eventually burning more than 4000 acres and damaging or destroying 27 homes. Three people were killed, presumably because they were unable to evacuate before their homes were engulfed in flame. One family’s daring escape from the fire was caught on a cell phone camera and made national news (CAUTION: strong language has not been edited out). Many interesting pictures of the fire may be found here, here, and here.

    Channel I-4 of VIIRS (centered at 3.74 µm) captured the hot spot from the Lower North Fork fire on each of Suomi-NPP’s afternoon (ascending) overpasses last week. These images make up the loop shown below.

    5-day loop of I-4 images of the Lower North Fork fire
    5-day loop of afternoon I-4 images of the Lower North Fork fire

    In this image loop, the color scale represents observed brightness temperature such that warmer pixels appear darker and cooler pixels appear lighter. Pixels warmer than 330 K appear black, and pixels colder than 250 K appear white. The time between each image in the loop is approximately 24 hours.

    The first image in the loop, taken at 20:24 UTC on the 26th, captured the hot spot shortly after the fire was first reported. The hot spot as seen by I-4 expanded significantly during the first 24 hours, before lighter winds and firefighting efforts greatly limited the growth of the fire. Over the last three frames, the hot spot can be seen to cool and shrink slightly.

    Low (liquid) clouds can be seen as dark splotches on the images from the 28th and 29th of March, which should not be confused with fires. This is due to the fact that liquid clouds are highly reflective at 3.7 µm, and the reflection of solar radiation during the day increases the observed brightness temperature, so they appear darker. The persistently bright sideways “C” shape to the northeast of the fire is Chatfield Reservoir, which has a low brightness temperature due to the low water temperature in the reservoir and the relatively low emissivity of liquid water at this wavelength. Cherry Creek Reservoir (to the northeast of Chatfield Reservoir) and Marston Lake (to the north of Chatfield Reservoir) can also be seen.

    With clear skies, the burn area shows up quite clearly in the I-band false color RGB composite of I-1, I-2 and I-3, taken at 20:06 UTC 27 March 2012 – the same time as the second frame of the loop above.

    RGB composite of VIIRS channels I-1, I-2 and I-3 of the Lower North Fork fire, 20:06 UTC 27 March 2012
    RGB composite of VIIRS channels I-1, I-2 and I-3 of the Lower North Fork fire, 20:06 UTC 27 March 2012

    The burn area shows up as a sizeable dark brown spot in the forests (which show up as green) southwest of Denver.

    After the driest and warmest March on record in Denver, hopefully this is not the start of a long, devastating fire season (link goes to PDF file).