• I- and M- Band Views of the Heartstrong Fire

    The Heartstrong Fire in Yuma County, Colorado, 18 March 2012
    The Heartstrong Fire in Yuma County, Colorado, 18 March 2012 (uncredited photo)

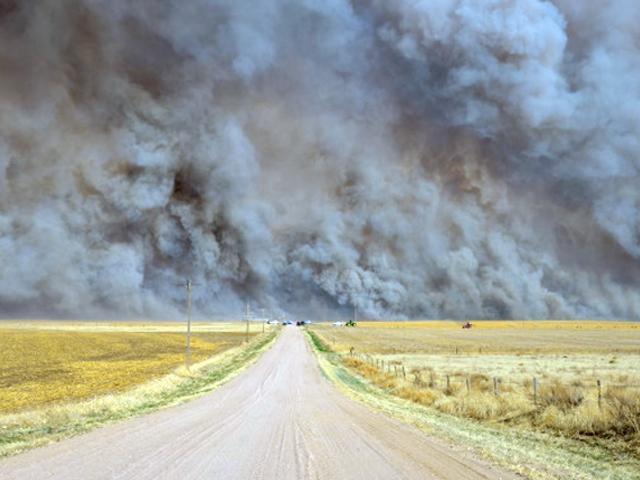
    On 18 March 2012, very warm, very dry and very windy conditions existed throughout eastern Colorado. Surface observations showed temperatures in the 70s and 80s, dew points in the teens and 20s, and sustained winds at 20-30 knots (gusting over 40 knots). Wind gusts up to 60 knots (~70 mph) were reported.

    Surface observations, 19:00 UTC 18 March 2012
    Surface observations, 19:00 UTC 18 March 2012 (courtesy UCAR)

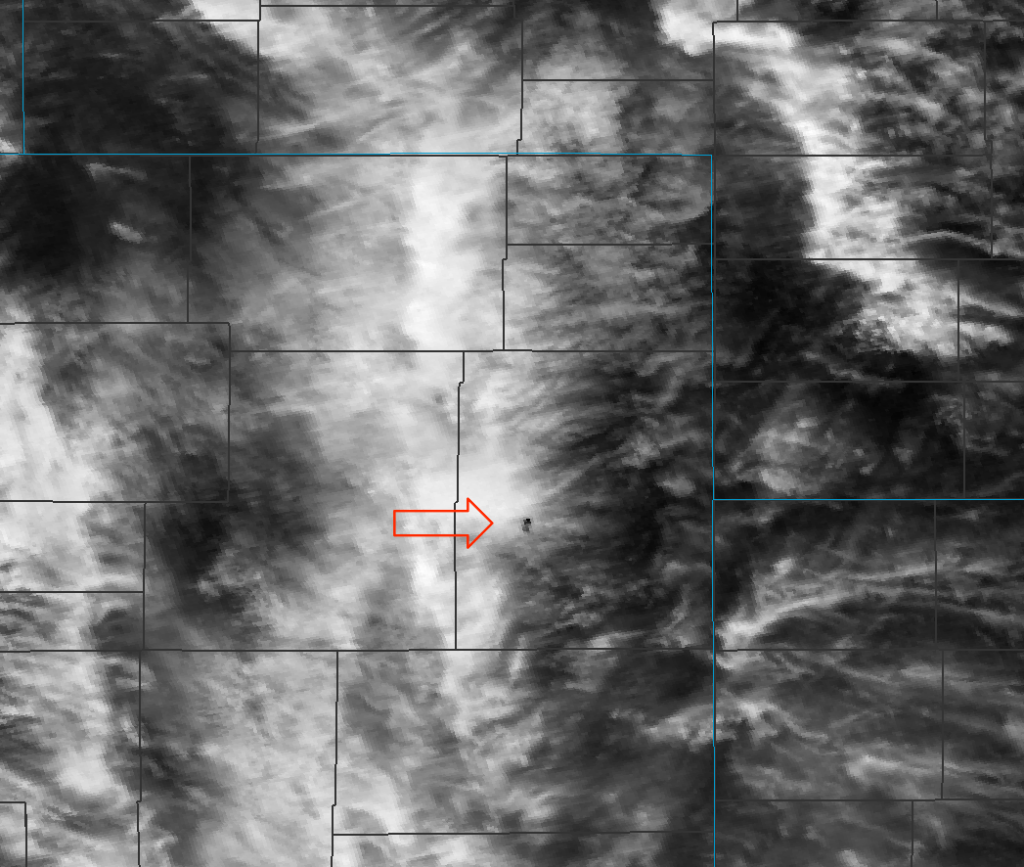
    A red flag warning was issued for nearly all of eastern Colorado. And with good reason! A grass fire started in Yuma County, CO (which borders Nebraska and Kansas) in the early afternoon, and quickly grew out of control. The media dubbed it the Heartstrong Fire. An area 14 x 16 miles had to be evacuated, although only 2400 acres actually burned. The smoke plume was easily visible from the Goodland, KS, National Weather Service radar. Two homes were destroyed, and three firefighters were injured battling the blaze.

    Radar image of smoke from the Heartstrong Fire, 21:17 UTC 18 March 2012
    Radar image of smoke from the Heartstrong Fire seen by the Goodland, KS, NWS radar, 21:17 UTC 18 March 2012 (courtesy UCAR)
    "True Color" image of the Heartstrong Fire, 19:34 UTC 18 March 2012
    "True Color" image (RGB composite of VIIRS channels M3, M4 and M5) of the Heartstrong Fire, 19:34 UTC 18 March 2012

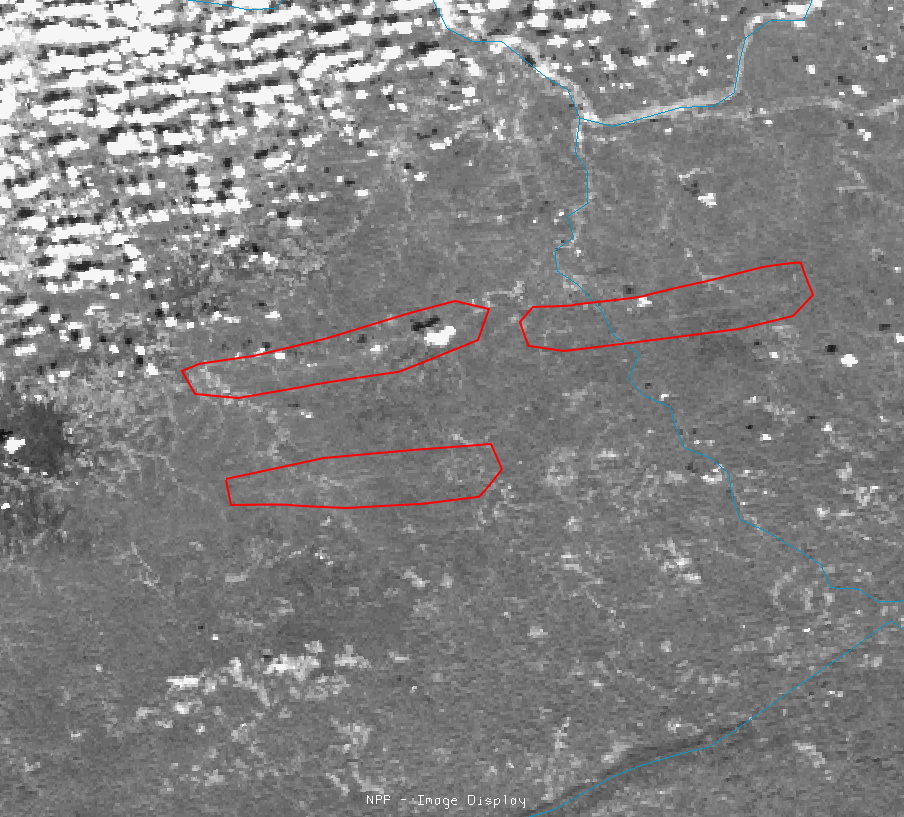
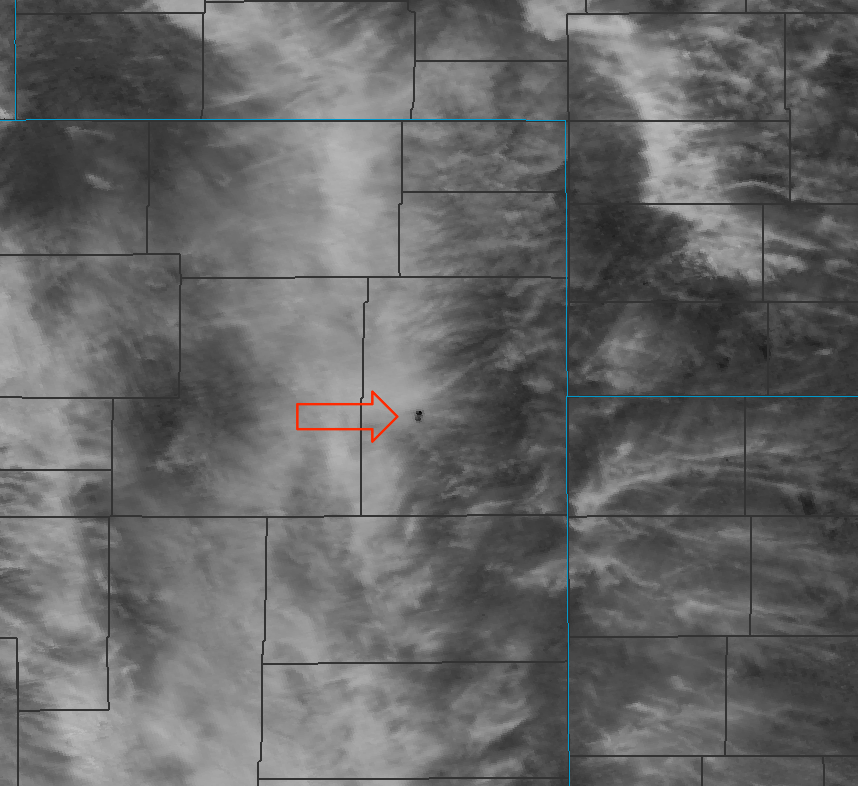
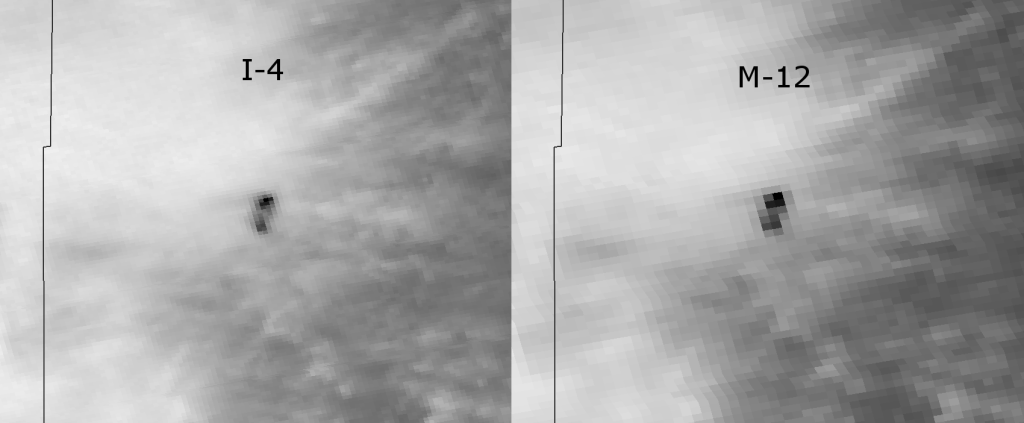
    Even though cirrus clouds covered the area (as seen in the true color image above), VIIRS observed the fire in its two 3.7 µm channels. The VIIRS images shown here, from 19:34 UTC, were taken roughly 20 minutes after the fire was first reported. The moderate resolution band M-12 (centered at 3.7 µm) identifies a hot spot (which shows up as black in the image below) that is approximately 6 pixels by 3 pixels. With ~750 m resolution at nadir in this band, that corresponds to a total area of 10.2 km² of pixels that contain a fire signal.

    Image of the Heartstrong Fire from VIIRS channel M-12, 19:34 UTC 18 March 2012
    Image of the Heartstrong Fire from VIIRS channel M-12, 19:34 UTC 18 March 2012

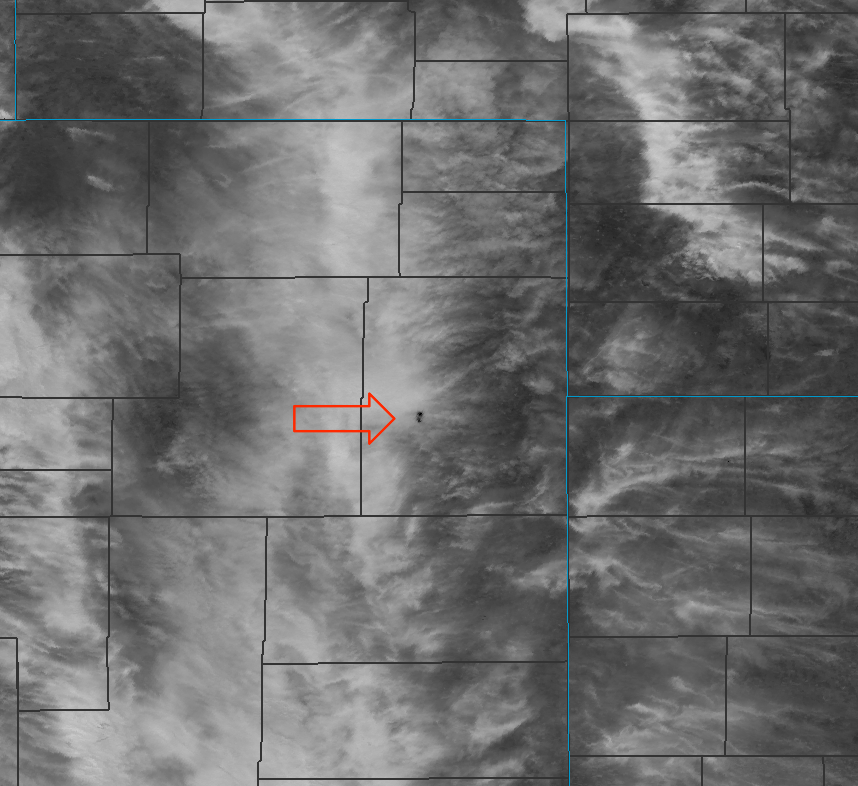
    The high resolution imagery band I-4 (centered at 3.74 µm) also identifies the hot spot. In this case it is approximately 11 pixels by 5 pixels in size. At ~375 m resolution at nadir, this corresponds to an area of 7.7 km² of pixels that contain a fire signal.

    Image of the Heartstrong Fire  from VIIRS channel I-4, 19:34 UTC 18 March 2012
    Image of the Heartstrong Fire (indicated by the red arrow) from VIIRS channel I-4, 19:34 UTC 18 March 2012

    Thus, the difference in resolution between these two channels leads to a difference in the apparent size of the hot spot as seen by satellites. However, it should be noted that this apparent size is only an estimate of the size of the hot spot visible in the satellite image, not the actual size of the fire. Fires move in narrow flame fronts that cover only a small percentage of the pixel area. From a firefighting perspective, detecting which pixels actually contain fire and where the actual burning occurs within those pixels are two different things.

    Of additional interest is the difference in observed brightness temperatures between these two channels. The warmest pixel in M-12 was 327 K, while the warmest pixel in I-4 was 342 K. As the observed brightness temperature is related to the fraction of each pixel covered by fire, the higher resolution images produce higher brightness temperatures in the hot spot.

    This means that, to a human observer, the hot spot appears larger in the M-band image, while, from an automated algorithm point-of-view, the I-band image has a larger number of pixels within the hot spot, and higher brightness temperatures. The difference in the appearance of the hot spot between these channels is more clearly seen in the figure below. Be sure to click on the image, and then look for the “1700×702” link above the image title and click on that to see the comparison in its highest quality.

    Comparison between the I-4 and M-12 views of the Heartstrong Fire
    Comparison between the I-4 and M-12 views of the Heartstrong Fire. The previous I-4 and M-12 images (taken at 19:34 UTC, 18 March 2012) have been zoomed in for additional clarity.

    As an additional note, band M-13 (centered at 4.05 µm) is the primary band used in active fire detection. This band was designed specifically to measure the radiative signal of hot spots without sensor saturation. The M-13 image of the fire is shown below.

    Image of the Heartstrong Fire taken by VIIRS band M-13, 19:34 UTC 18 March 2012
    Image of the Heartstrong Fire from VIIRS channel M-13, 19:34 UTC 18 March 2012

    There is a dedicated team of researchers actively exploring fire detection from VIIRS. You can learn more about fire detection and the status of their current fire detection products by visiting viirsfire.geog.umd.edu.

  • Aurora Borealis from the Day-Night Band

    On 6 March 2012, a massive solar flare erupted and an associated coronal mass ejection was launched toward Earth. Video of the solar flare from NASA’s Solar Dynamics Observatory can be viewed here. NOAA’s Space Weather Center forecast the coronal mass ejection to reach Earth on 8 March 2012, which you can view here. In another video, Joe Kunchas of the Space Weather Prediction Center talks about the solar flare, coronal mass ejection and possible impacts of the these events – including re-routing of aircraft, the effect on electric power grids and the best conditions to view the aurora. ABC News made it sound like the world was going to end.

    Fortunately, the world did not come to an end and Suomi NPP sufferend no significant ill effects from the solar activity. In fact, the Day/Night band on VIIRS caught the aurora borealis, even in the presence of a full moon.

    VIIRS DNB image, 9:16 UTC 9 March 2012
    VIIRS Day/Night band image of the aurora over Saskatchewan and Manitoba, 9 March 2012

    The Day/Night band (DNB) is a visible-wavelength band, centered at 0.7 µm, that is highly sensitive to low levels of light, so that it behaves like a visible channel even at night when the moon is out. As seen in the image, the DNB clearly shows the location of towns and cities at night. Since 8 March 2012 was a full moon, clouds, snow and ice (particularly over Lake Winnipeg) are also visible. The brightest swirl, extending from north of Saskatoon, over Reindeer Lake and into northwestern Manitoba is the aurora borealis.

    On its previous orbit, the DNB captured the aurora over Ontario and Quebec, although it is more difficult to distinguish from the underlying clouds.

    VIIRS DNB image taken at 7:35 UTC, 9 March 2012
    A VIIRS Day/Night band image taken at 7:35 UTC, 9 March 2012

    In this image, the bright swirls extending from north-central Ontario, over James Bay and into northern Quebec are elements of the aurora. It is expected that auroras would be more visible in the DNB during new moon events, where the aurora would be the only light source (apart from cities, towns and other point-source human activity).

    Many amateur and professional photographers got a good look at the auroras, including this video taken from the shores of Lake Superior and this one taken near Wasilla, Alaska. Imagine if we had two more DNB channels at shorter wavelengths, so that we could capture the amazing colors of the aurora that these videos show.

  • VIIRS View of March 2 Tornadic Storms

    NPP/VIIRS passed over Southern Indiana on March 2 about thirty minutes before the most devastating tornadoes struck the towns of New Pekin and Henryville (among others).  At 1935 UTC, a pair of rotating thunderstorms, also known as supercells, were advancing eastward across Indiana.  The easternmost storm spawned the most damaging tornadoes.  Below is a VIIRS true color image from the NPP pass at 1935 UTC.

    VIIRS True Color image of the severe storms on 2 March 2012 at 1935 UTC.
    VIIRS True Color image of the severe storms on 2 March 2012 at 1935 UTC.

    A zoomed-in visible view of the storms is below.

    VIIRS I-band 1 (375-m resolution) from 2 March 2012 at 1935 UTC
    VIIRS I-band 1 (375-m resolution) from 2 March 2012 at 1935 UTC

    The infrared (I-band 5) image is below, along with some annotations pointing out the two active supercells discussed above.  Note that the brightness temperatures associated with the overshooting top (OST) of the westernmost storm are colder than the easternmost storm, although both storms were quite strong at the time and the eastern storm ended up producing the deadlier tornadoes.  OSTs are transitory, so it’s possible that a new cold OST formed with the eastern storm shortly after the NPP pass.  These very high resolution infrared views of tornadic storms are among the first documented, given the recent launch of NPP.

    VIIRS I-band 5 Infrared view from 2 March 2012 at 1935 UTC

    VIIRS I-band 5 Infrared view from 2 March 2012 at 1935 UTC

    To illustrate the effect of high resolution in the IR, below is a GOES-13 10.7 micrometer IR image from 1932 UTC, which has 4-km resolution at nadir.  The coldest brightness temperature in the westernmost storm in southern Indiana from GOES is 206.6 K, but with VIIRS it’s 195 K.

    GOES-13 4-km IR Image from 1932 UTC on 2 March. Compare this image to the 375-m VIIRS image above to see the improvement provided by VIIRS over GOES.
    GOES-13 4-km IR Image from 1932 UTC on 2 March. Compare this image to the 375-m VIIRS image above to see the improvement provided by VIIRS over GOES.

    The day after the tornadoes, relatively cloud-free skies in eastern Kentucky allowed VIIRS to see some of the tornado tracks.  In the image below, the faint white lines circled in red in Kentucky and West Virginia denote the new tornado damage paths.  When green vegetation is disrupted/destroyed, the result is typically a brighter scene at visible wavelengths.

    VIIRS I-band 1 from 3 March 2012 over eastern KY and western WV. The tornado tracks are circled and show up as faint white lines
    VIIRS I-band 1 from 3 March 2012 over eastern KY and western WV. The tornado tracks are circled and show up as faint white lines


  • A Tropical Winter Wonderland

    It’s not every day the official National Weather Service forecast from Honolulu, HI calls for freezing rain and snow in parts of Hawaii, but that’s what happened 19 February 2012 for the Big Island. Mauna Loa and Mauna Kea both received snow over the last 24 hours, and VIIRS shows both volcanoes are covered with the white stuff.

    True color image of the island of Hawaii from VIIRS, taken at 23:16 UTC, 19 Febraury 2012
    True color image of the island of Hawaii from VIIRS, taken at 23:16 UTC, 19 Febraury 2012

    A false color image of the island of Hawaii taken from VIIRS at 23:16 UTC, 19 February 2012
    False color (or "pseudo-true color") image of the island of Hawaii from VIIRS at 23:16 UTC, 19 February 2012

    The top image is an RGB composite of moderate resolution channels M3 (blue), M4 (green) and M5 (red). As these channels observe radiances in the blue (0.488 μm), green (0.555 μm) and red (0.865 μm) portions of the visible spectrum, respectively, the image represents what the human eye sees, and is thus a “true color” representation.

    The bottom image is an RGB composite of high resolution channels I-1 (blue), I-2 (green) and I-3 (red). These channels observe radiances centered on 0.64, 0.86 and 1.61 μm, respectively. As a result, differences in the optical properties of liquid droplets and ice particles at these wavelengths allow liquid and ice clouds (and snow) to be distinguished more easily. Liquid clouds appear white (or a dirty, brownish-white), while ice clouds appear blue. The snow on top of Mauna Loa and Mauna Kea stands out as a deeper blue. Vegetation still shows up as green, and barren ground as brown, producing an image that may be called “pseudo-true color”.

    Both peaks, which are more than 13,600 ft above sea level, receive snow during most winters. The Mauna Loa observatory, at 11,100 ft above sea level, averages 3.7 inches of snowfall each year. While there are many observatories on Mauna Kea with weather stations, none of them seem to collect routine snowfall information. You can find the latest webcam imagery of Mauna Kea by clicking here to find out how much snow there is in the tropical paradise now. Aloha!

  • Tropical Cyclone Giovanna

    Back in January, Madagascar was brushed by tropical cyclone Funso, which caused periods of heavy rain, but was a bigger deal for neighboring Mozambique. This time around, Madagascar took a direct hit from tropical cyclone Giovanna, which reached “Super Cyclone” status as category 4 storm just prior to making landfall.

    VIIRS got a great look at Giovanna while it was a category 4 storm.

    Visible image of Super Cyclone Giovanna
    A visible image of Super Cyclone Giovanna from VIIRS channel I-1 taken at 09:47 UTC, 13 February 2012 (Thanks to Dan Lindsey)

    IR-window image of Super Cyclone Giovanna
    IR-window image of Super Cyclone Giovanna taken by VIIRS channel I-5 at 09:47 UTC, 13 February 2012 (Thanks to Dan Lindsey)

    Fortunately, Giovanna weakened rapidly upon making landfall. Moving east to west across the center of the island and over the mountains of central Madagascar, Giovanna could not maintain its Super Cyclone status. At the time of this post, Giovanna was located over the west coast of Madagascar and down to sustained winds of 35 knots, making it a weak tropical storm. Early reports suggest between 2 and 5 people were killed, and some towns on the east coast had 60% or more of their buildings damaged or destroyed.

    All things considered, the situation could have been much worse, considering residents were only given a half a day’s warning, and the primary method for disseminating weather warnings is through the use of town criers.