Quick: what was the name of that Icelandic volcano that caused such a stir a few years ago? Oh, that’s right. You don’t remember. No one remembers. (Unless you live outside the U.S. in a place where you might have actually heard someone say the name correctly.) To Americans, it will forever be known as “That Icelandic Volcano” or “The Volcano That Nobody Can Pronounce” – even though it is possible to pronounce the name. Say it with me: Eye-a-Fiat-la-yo-could (Eyjafjallajökull).
Well, back at the end of August 2014 another volcano erupted in Iceland, and there is no excuse for not being able to pronounce this name correctly: Bárðarbunga. (OK, you have one excuse: use of the letter ð is uncommon outside of Iceland. In linguistics, ð is a “voiced dental fricative” which, in English, is a voiced “th”. “The” has a voiced “th”. “Theme” has an un-voiced “th” or, rather, “voiceless dental non-sibilant fricative“.) Look, you don’t want to offend any Icelanders, so say it right:
“Bowr-thar-Bunga.” See, it’s easy to say. (You may see people who are afraid of the letter ð refer to the recent eruption as Holuhraun [pronounced “Ho-lu-roin”], because Bárðarbunga is part of the Holuhraun lava field. So be aware of that.)
I know what you’re going to ask: “What is so special about this volcano? I haven’t heard anything about it up to this point, so why should I care?” You haven’t heard anything about it because you don’t live in Iceland or in Europe, which is downwind of Iceland. And, why should you care? Let me count the ways in the rest of this blog post.
You probably have heard of Kīlauea (and have no trouble pronouncing that name) and the lava flow that inched its way towards the town of Pahoa. Kīlauea has been continuously erupting since 1983. Bárðarbunga erupted on 29 August 2014 and has been spewing lava ever since, which at this point, is over 100 days of non-stop erupting. It’s Iceland’s version of Kīlauea. (Hopefully, it won’t continue to erupt for another 30 years.)
Just like Kīlauea, Bárðarbunga is attracting tourists from all over the world. It seems every wannabe photographer and videographer has gone (or wants to go) to Iceland to try to come up with the next viral video showing the breathtaking lava flows. Seriously, do a search for Bardarbunga or Holuhraun on YouTube or vimeo and see how many results show up. Here’s a pretty typical example (filmed by someone from Iceland):
Want to join in the fun? Just grab your camera, head to Iceland, hire an airplane or helicopter pilot, and find the most dramatic music you can think of to go along with your footage. Watch out, though – the airspace around the volcano can be rather crowded. As this video shows, it can be hard to film the volcano without other aircraft getting in the way.
If photography is more your thing, here are the latest images of the eruption on Twitter. (Look for the pictures of Beyonce and Jay-Z. If Twitter is correct, they flew over the volcano for his birthday. Viewing the eruption has gone mainstream! You’re too late, hipsters! Good luck getting to the next volcanic eruption before it becomes cool.)
Back to the matter at hand: why you should care about Bárðarbunga. After its first 100 days of erupting, it has created a field of new lava (76 km2) that is larger than the island of Manhattan (59 km2). The volcano has been creating a toxic plume of SO2 for the last 100 days that is making it difficult to breathe. (Here are some of the known health effects of breathing SO2.) SO2 can ultimately be converted into sulfuric acid (acid rain), depending on the chemistry in the air around the volcano. And while it may not be producing as much ash as Eyjafjallajökull did, VIIRS imagery shows it is producing ash, which is a threat to aircraft.
If you follow this blog, you know the best RGB composite for detecting ash is the True Color composite. This is because the visible wavelength channels that make the composite are sensitive to the scattering of light by small particles, like dust, smoke and ash. Iceland is a pretty cloudy place, so it’s not always easy to spot the ash plume, so here it is at its most visible:
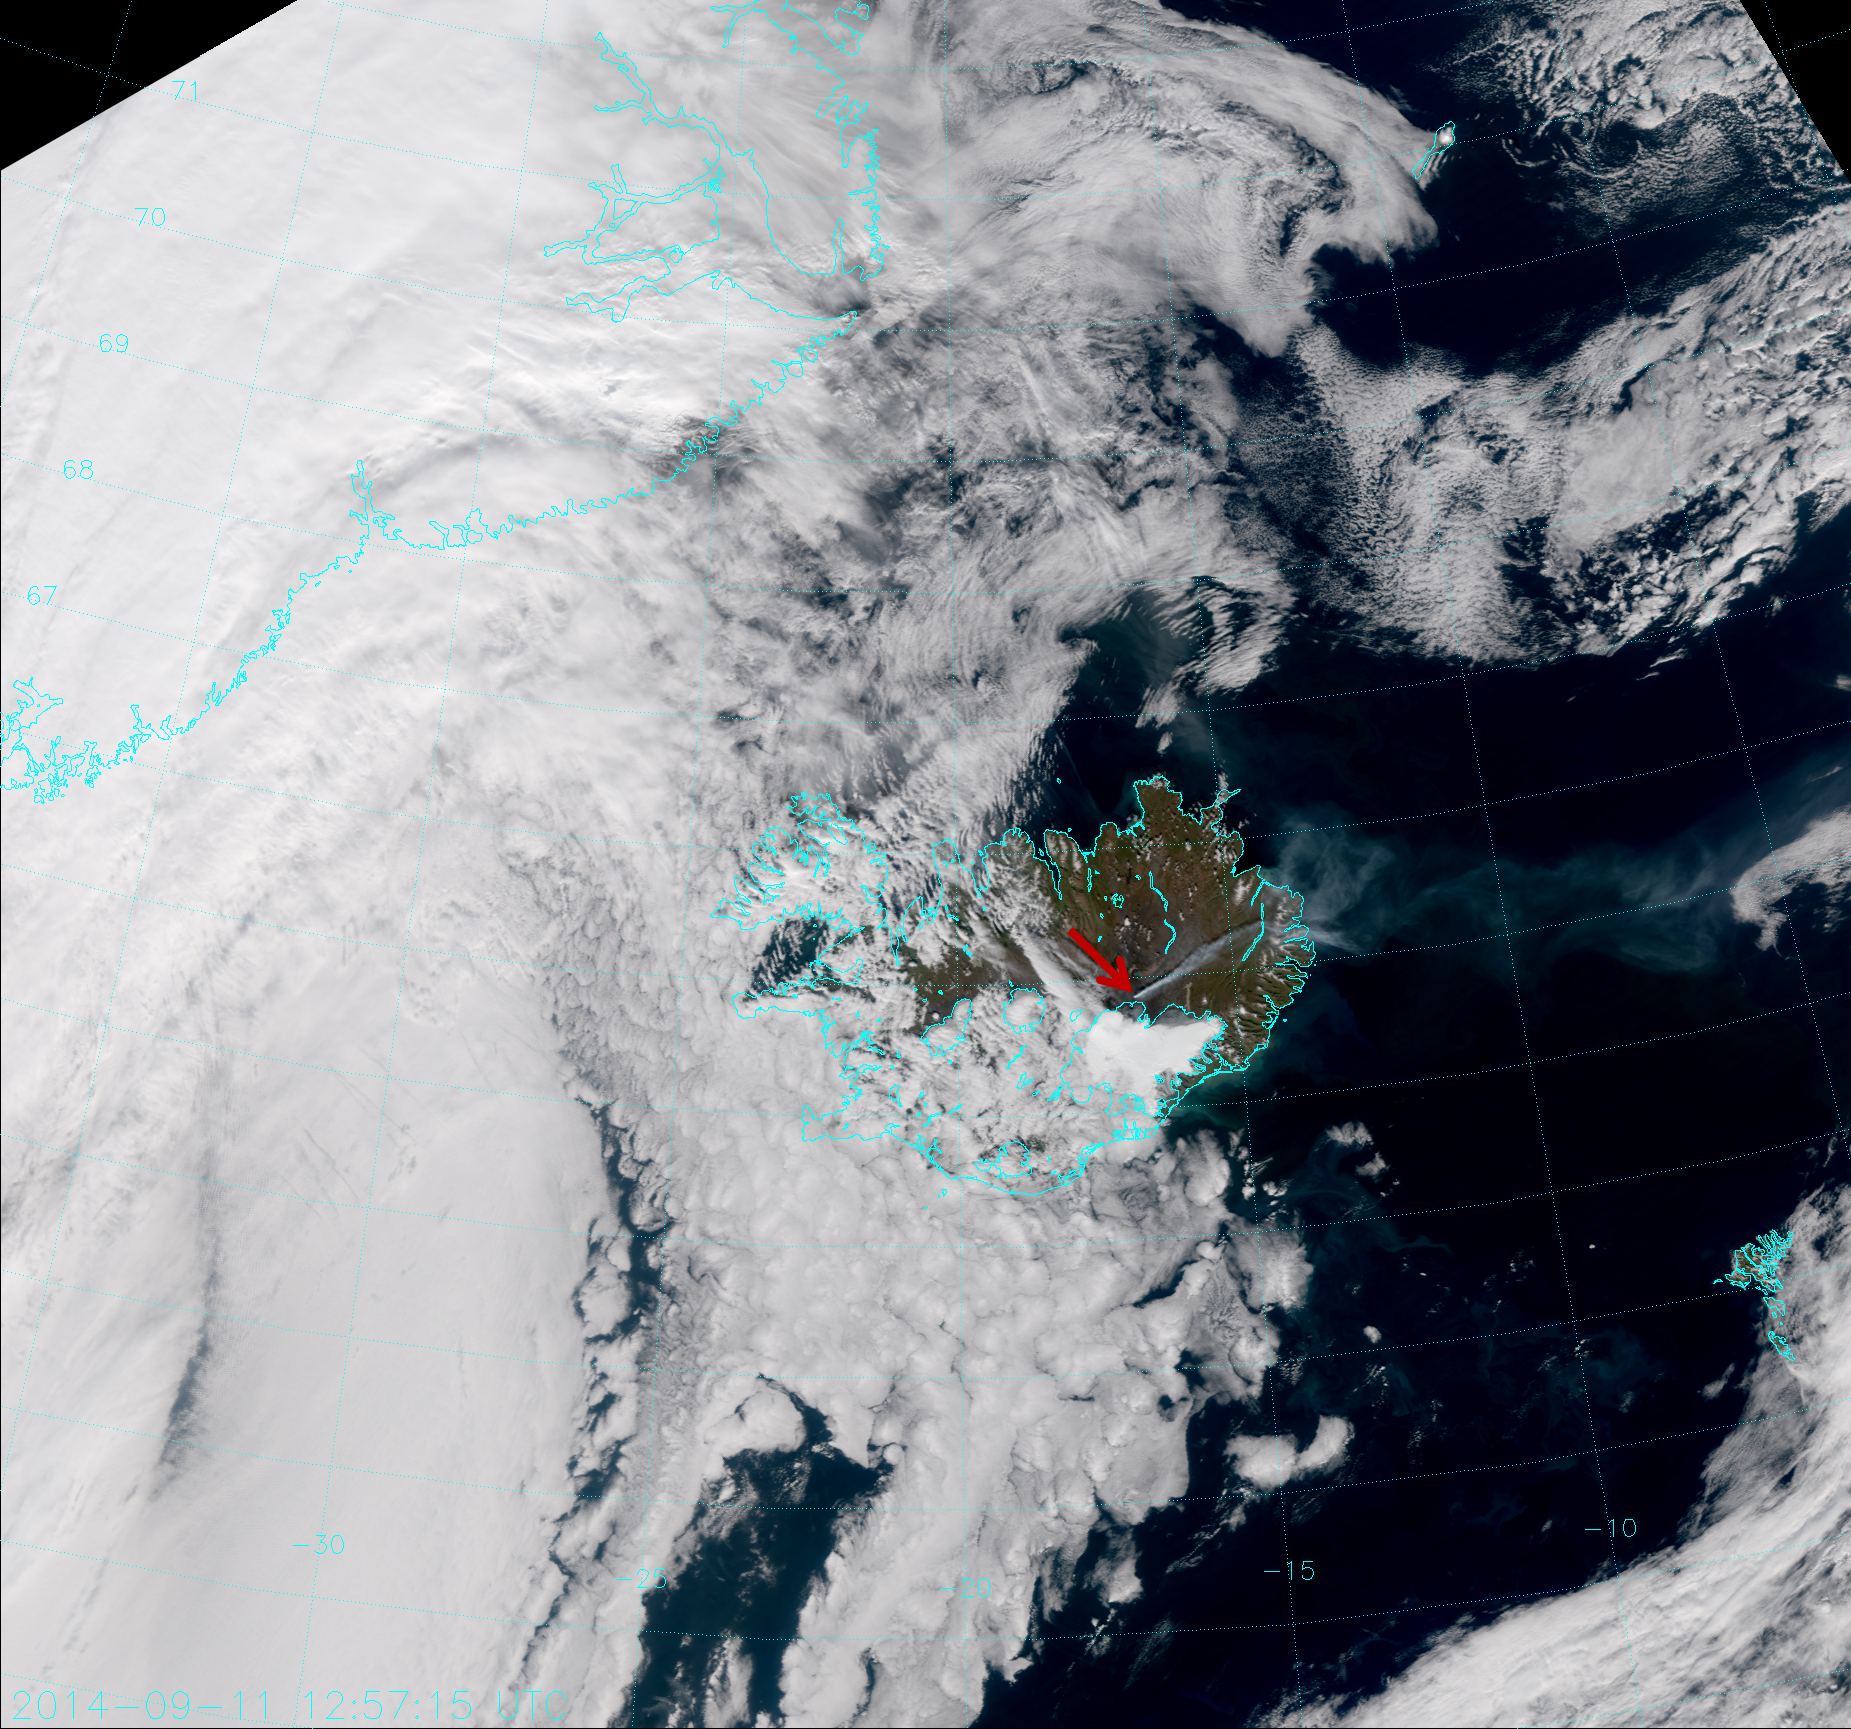
Click on the image (or any other image) to see the full resolution version. The red arrow shows the location of Bárðarbunga. In case you’re wondering, the borders drawn inside the island are IDL’s knowledge of the boundaries of lakes and glaciers (jökull in Icelandic). The big one just south of the red arrow is Vatnajökull – the largest glacier in Europe and one of three national parks in Iceland. (If you want to go there, be aware of closures due to volcanic activity.)
See the ash plume extending from the red arrow to the east-northeast out over the Atlantic Ocean? Now, try to find the ash plume in this animation of True Color images from 29 August to 14 October 2014:

As with most of my animations, I have selectively removed images where it was too cloudy to see anything. Sometimes, the steam from the volcano mixes with the ash to make its own clouds, much like a pyrocumulus. Watch for the ash to get blown to the northwest and then southwest in early October. In case you can’t see it, here’s a static example:
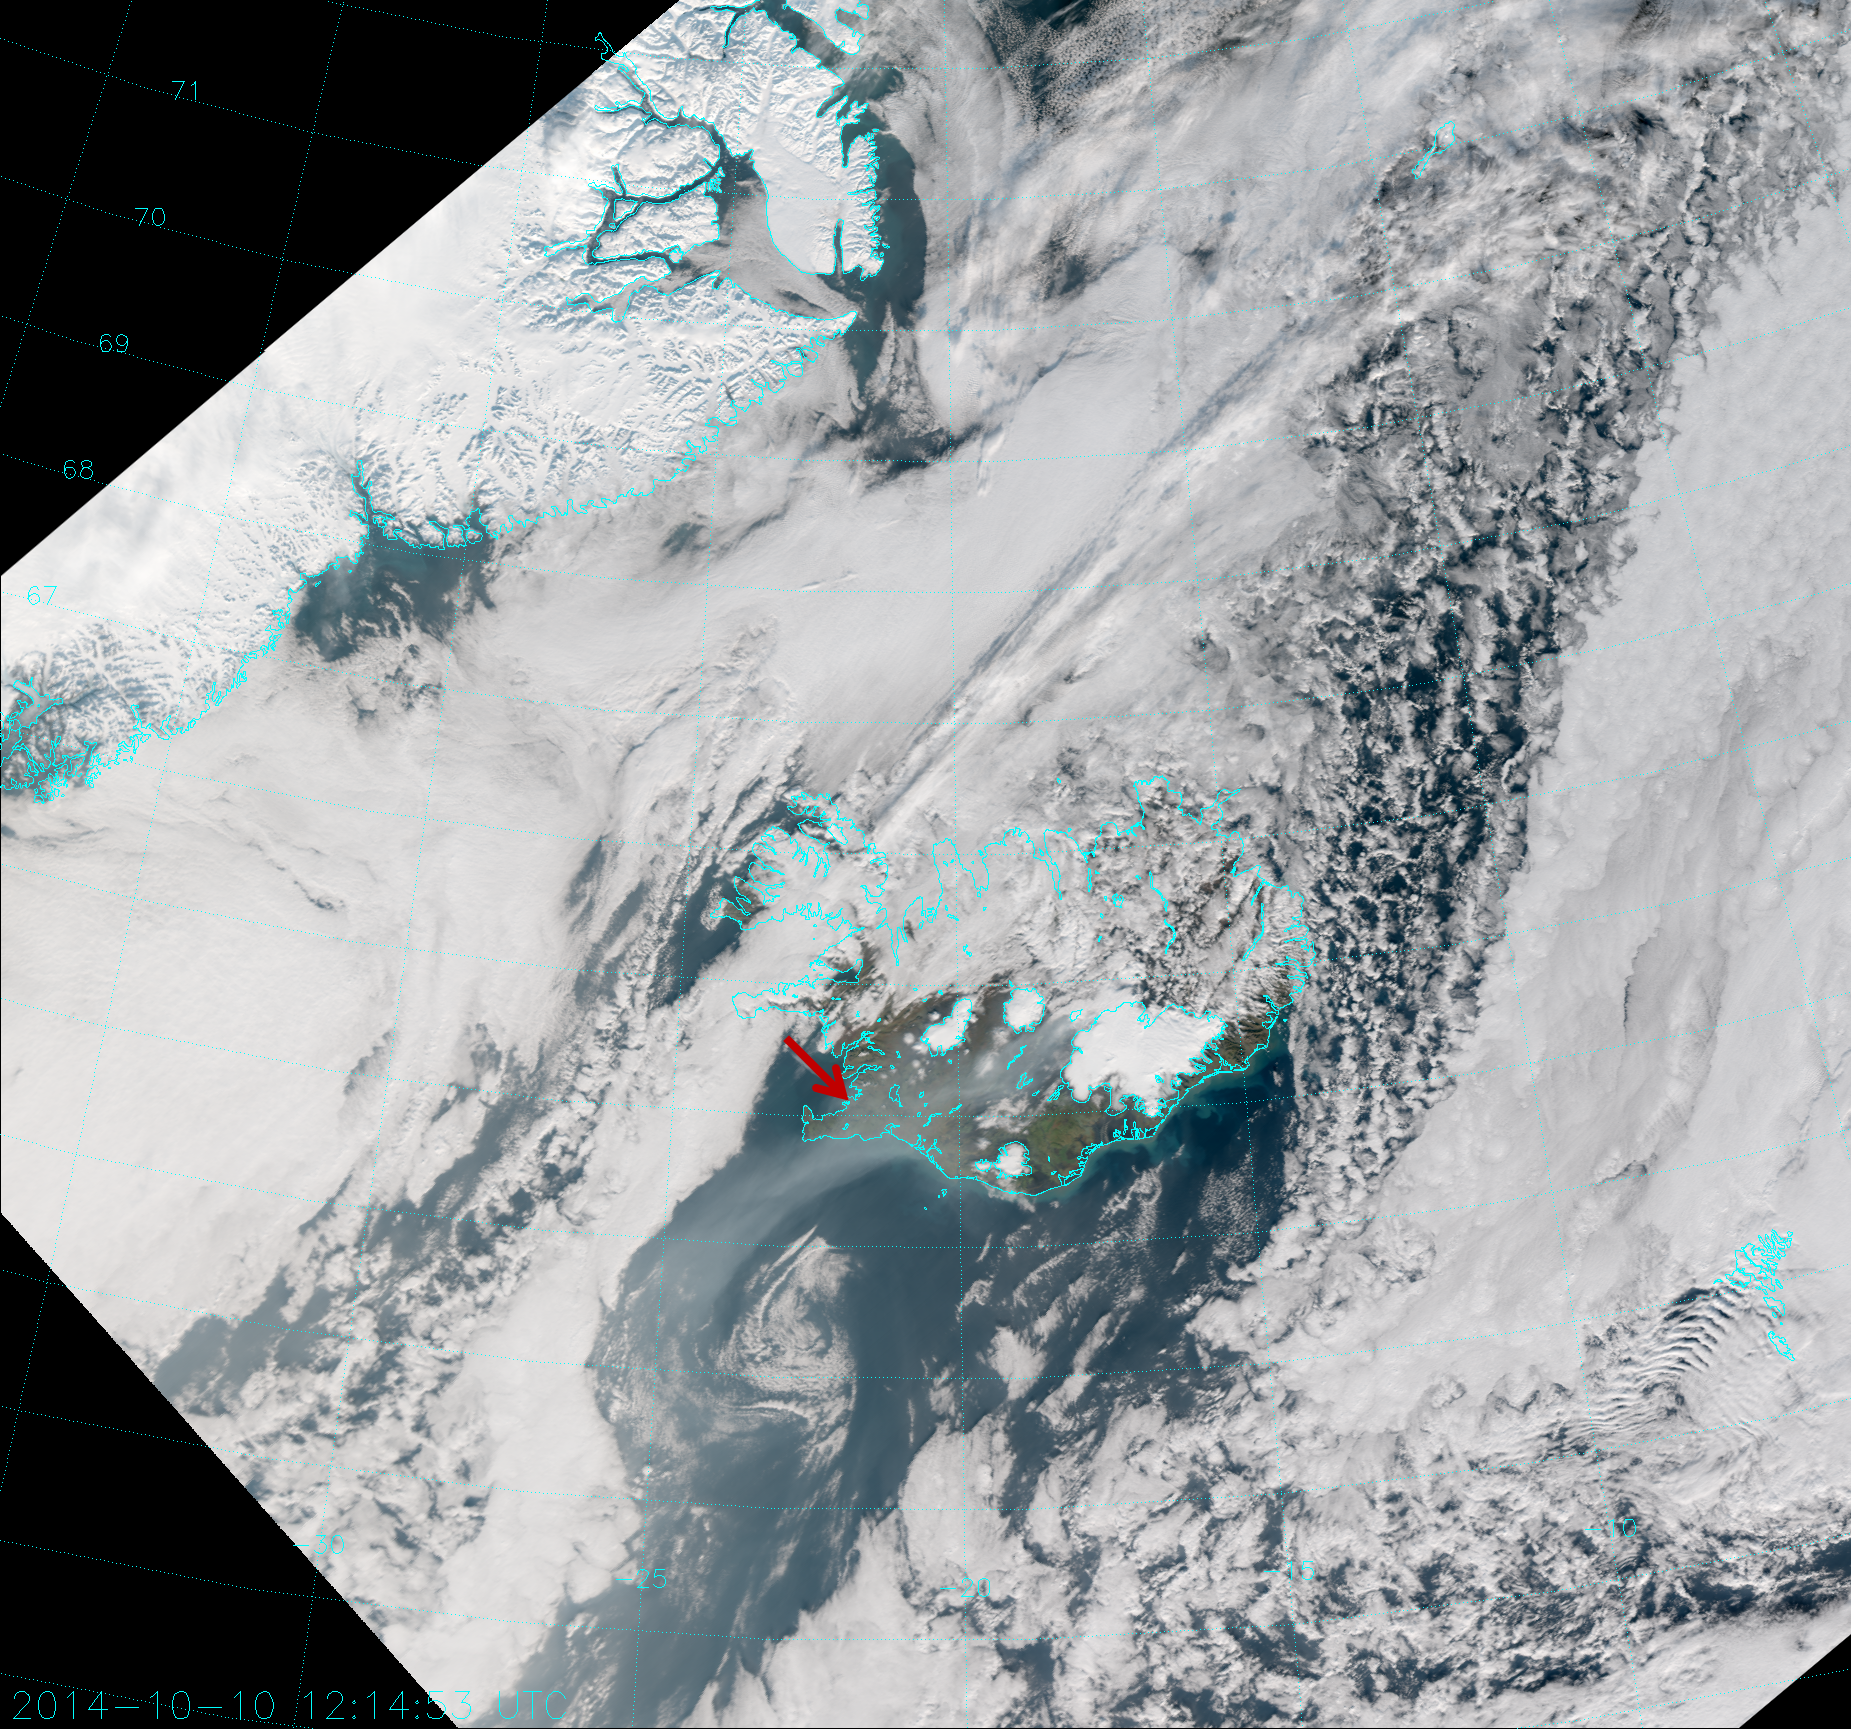
This time, the red arrow shows Reykjavik, the nation’s capitol and likely only city in Iceland you’ve heard of. The ash plume is pretty much right over Reykjavik!
Over the course of the first 100 days, no place in Iceland has been kept safe from the ash plume. But, that’s not the only threat from Bárðarbunga: I also mentioned SO2. If you recall from our look at Copahue (Co-pa-hway – say it right!) the EUMETSAT Dust algorithm is sensitive to SO2. So, can we detect the toxic sulfur dioxide plume from Bárðarbunga? Of course! But, it does depend on cloudiness and just how much (and how high) SO2 is being pumped into the atmosphere.
If you read my post on Copahue, you should have no trouble picking out the sulfur dioxide plume in this image of Bárðarbunga:
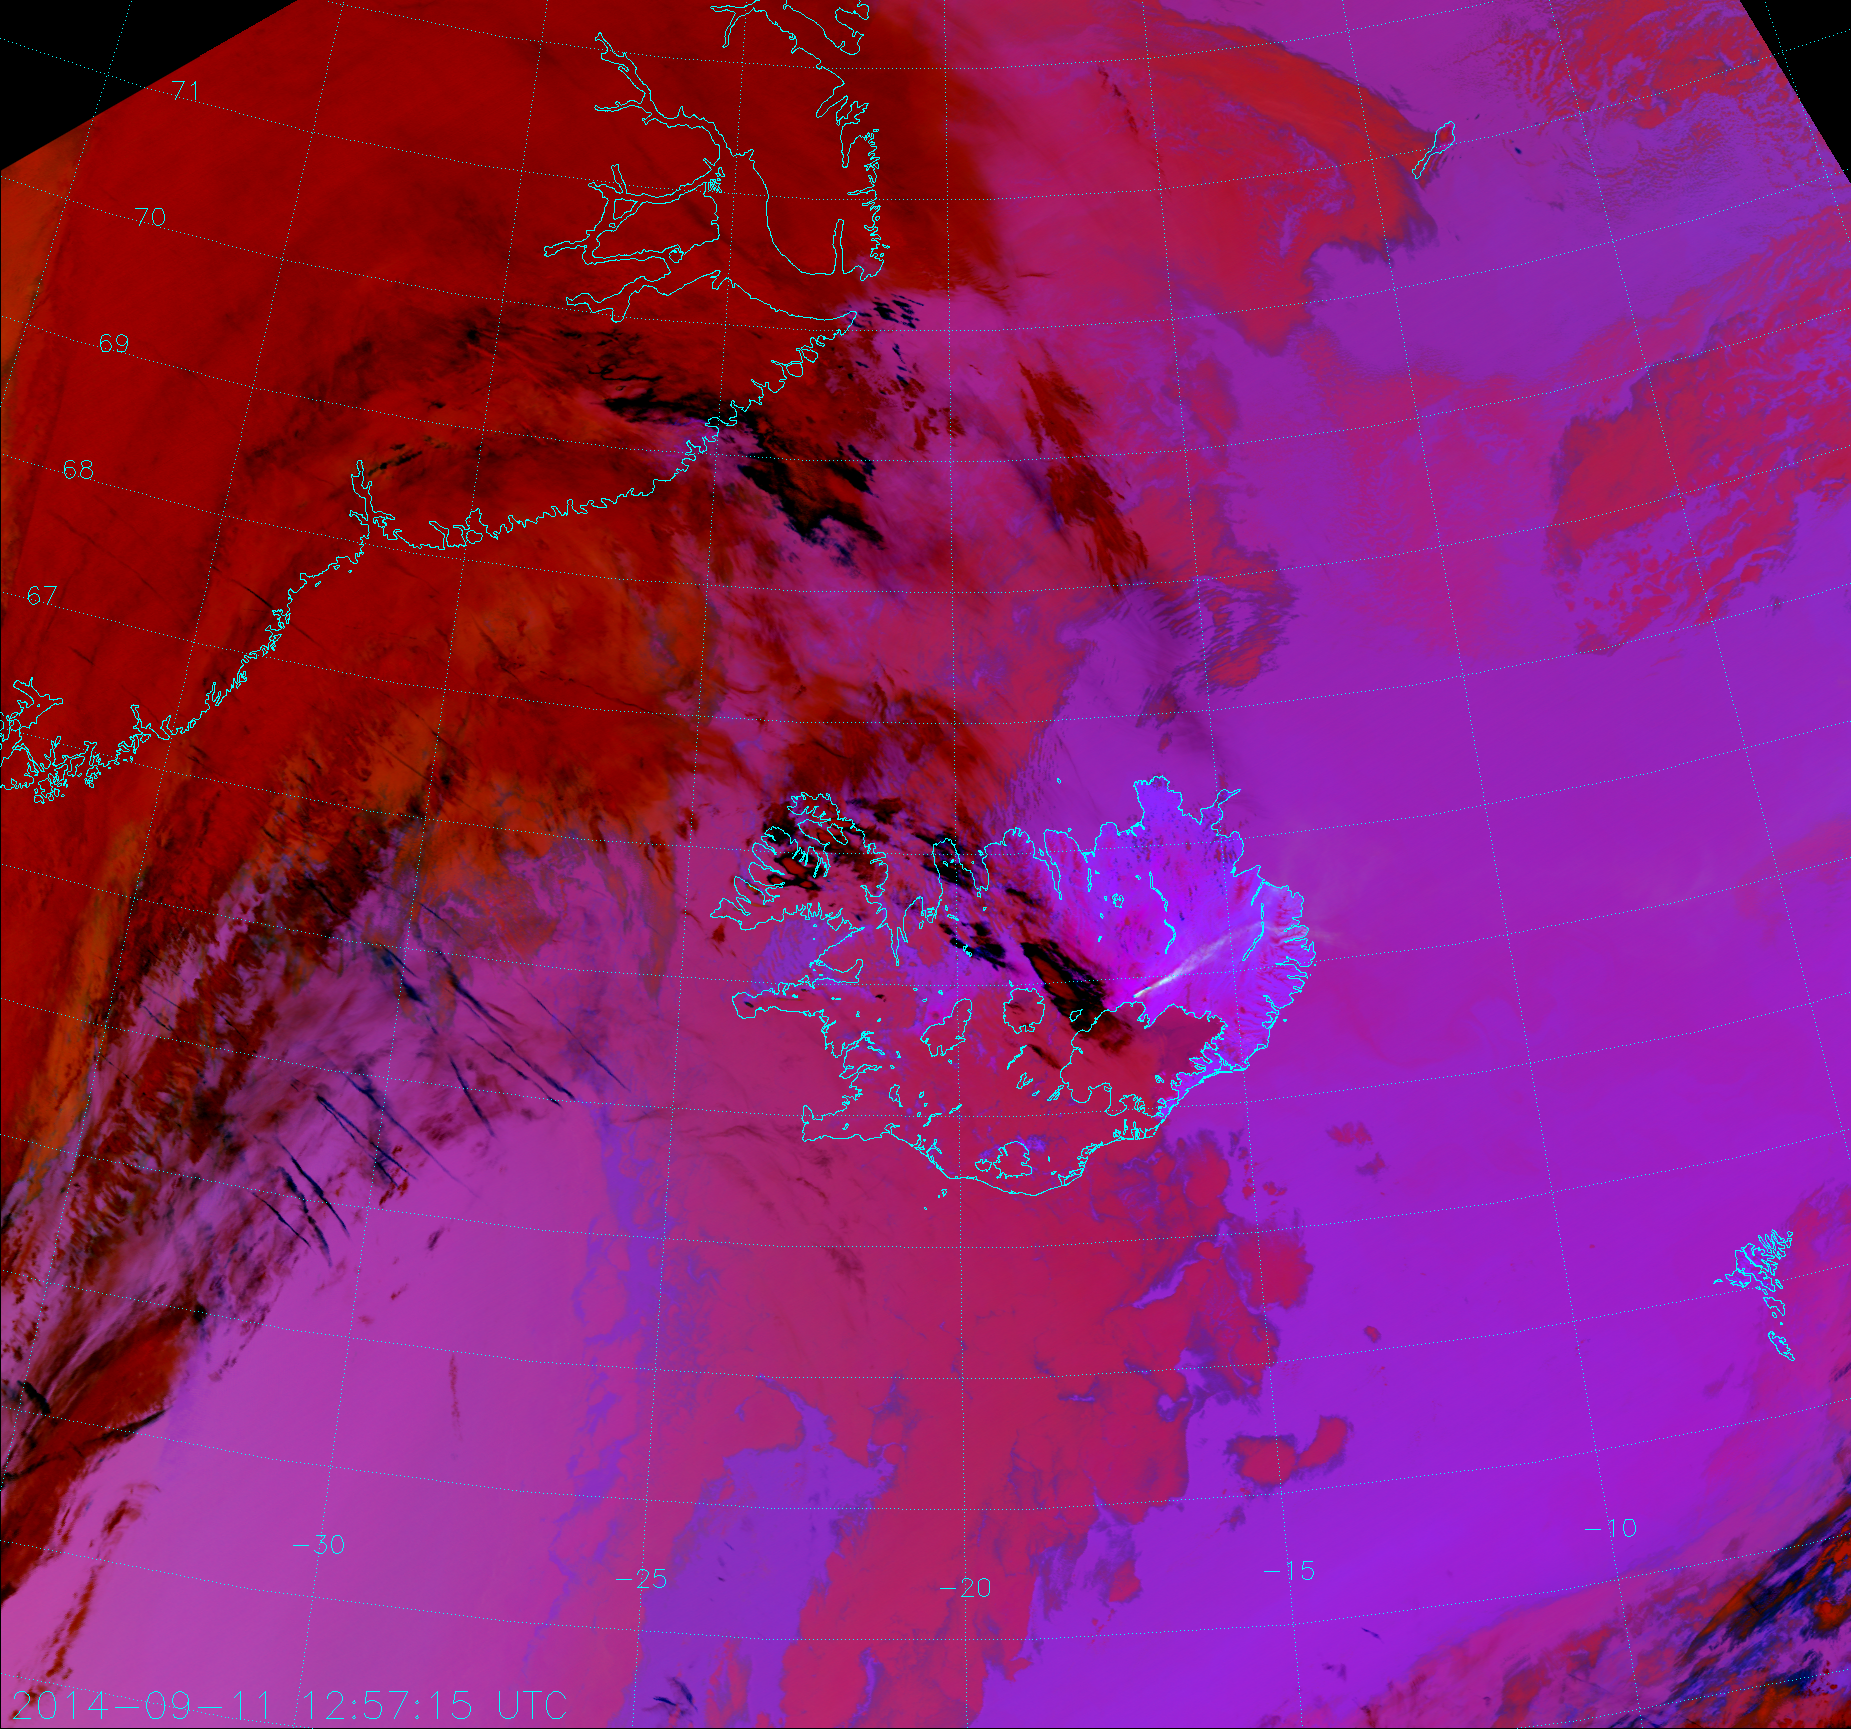
This image is from the same time as the first True Color image above, when the plume was very easy to see. Also note the large quantity of contrails (aka “chemtrails” to the easily misled). Those are the linear black streaks west of Iceland. If you’re confident in your ability to see the sulfur dioxide, see how often you can pick it out in this animation:
Some detail is lost because an RGB composite may contain as many as 16 million colors, while the .gif image standard only allows 256. But, you can still see the pastel-colored SO2 plume, which almost looks greenish under certain conditions due to interactions with clouds. Also note the volcano itself appears cyan – the hottest part of the image has a cool color! Unusual in a composite that makes almost everything appear red or pink.
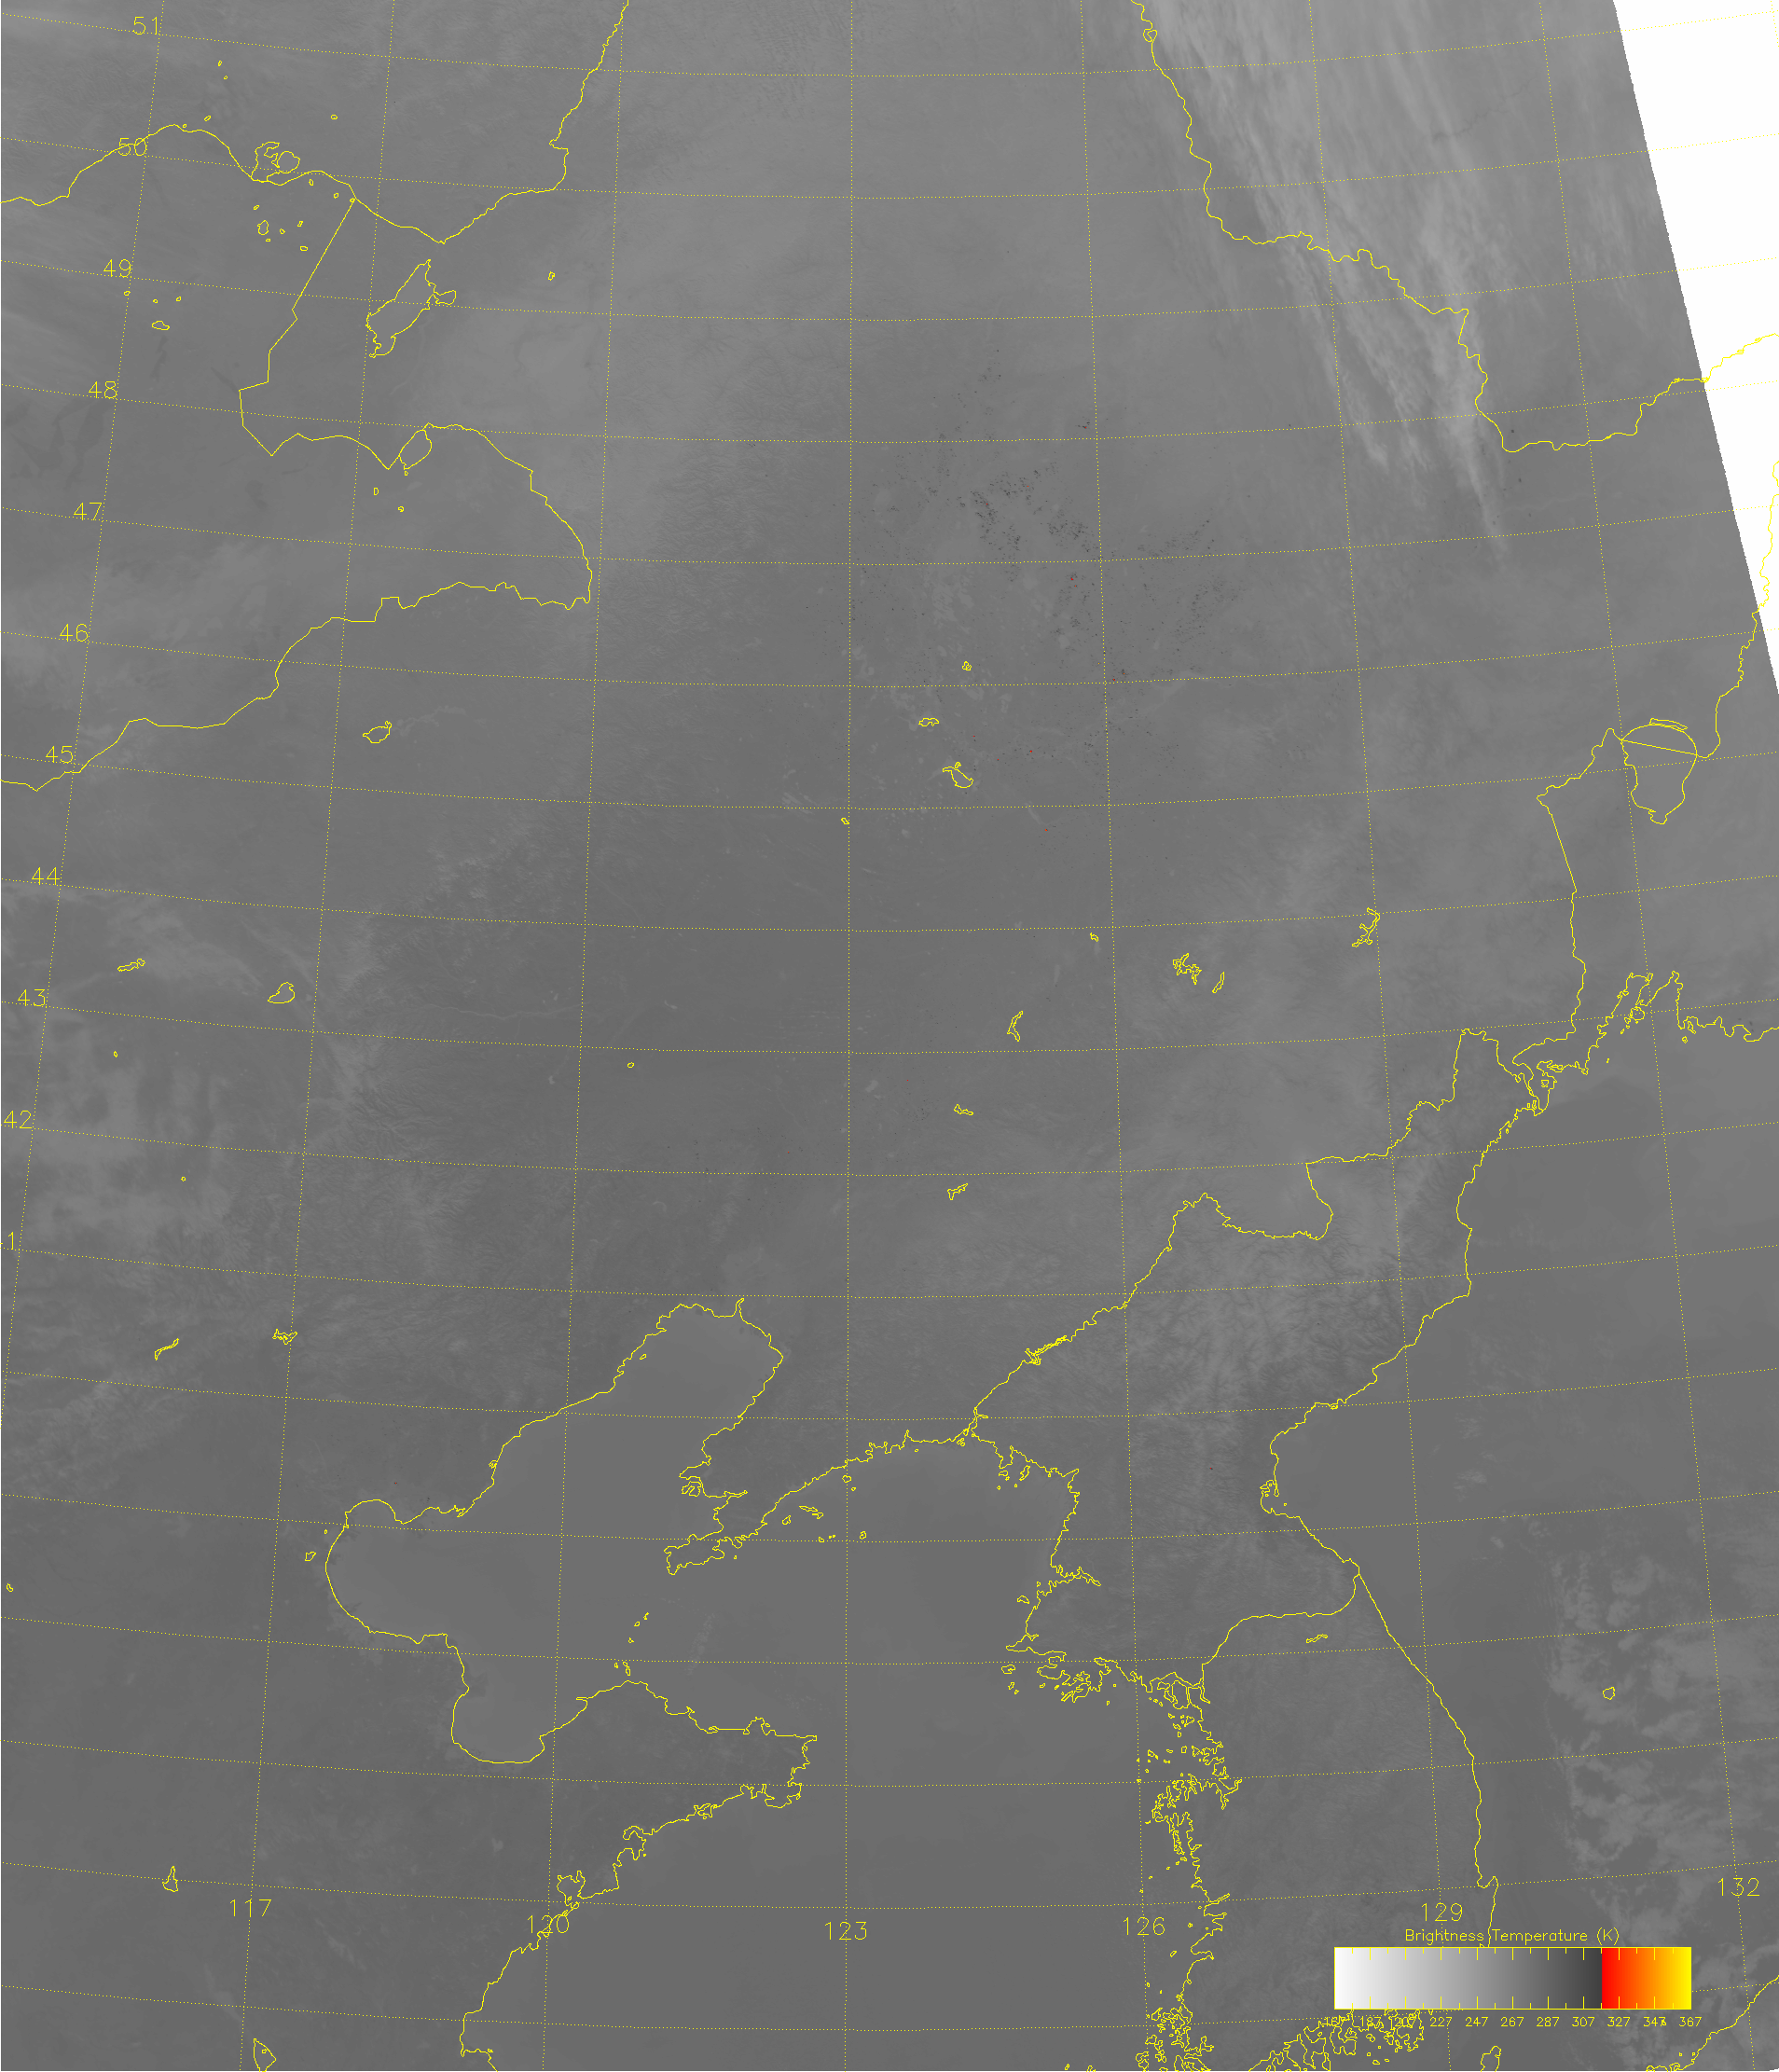
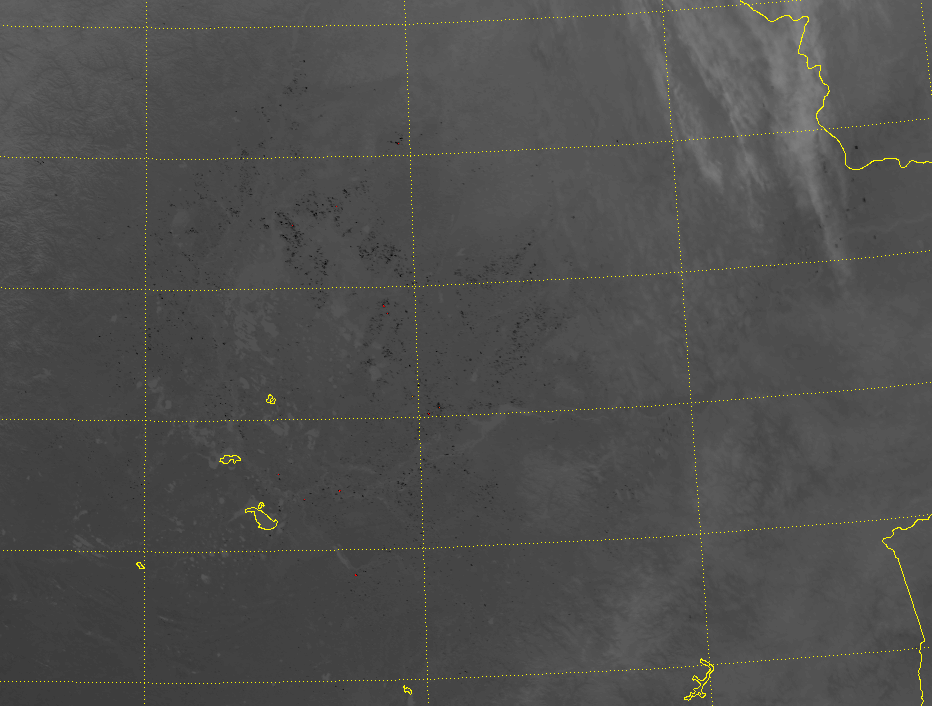
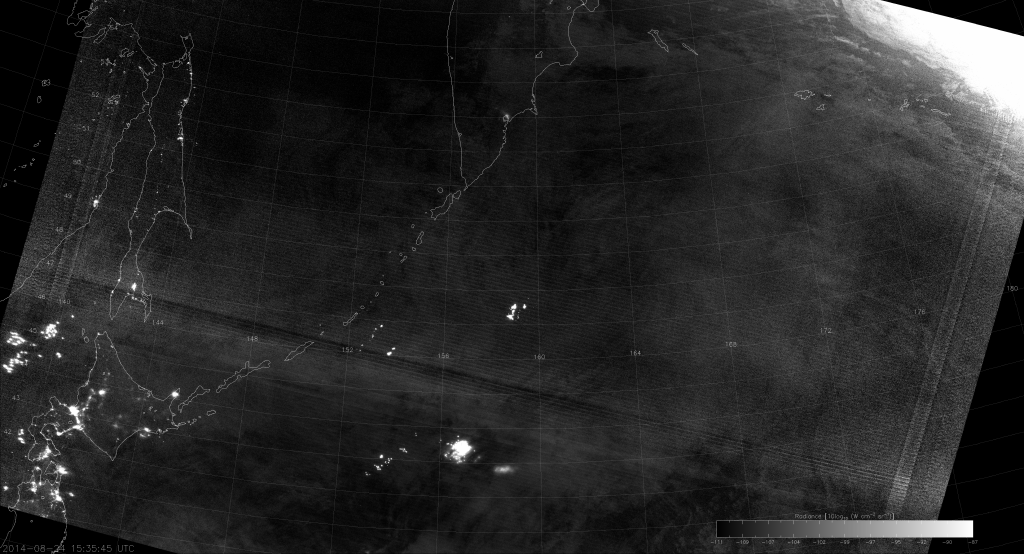
If you want to see the volcano look more like a hot spot, here are animations of the shortwave IR (M-13, 4.0 µm) and the Fire Temperature RGB composite (which I promote whenever I can). I should preface these animations by saying I have not removed excessively cloudy images but, at least 80% of the days have two VIIRS afternoon overpasses and, to reduce filesizes, I have kept only one image per day:
The Fire Temperature RGB is made up of M-10 (1.6 µm; blue), M-11 (2.25 µm; green) and M-12 (3.7 µm; red):
No surprise, molten rock is quite hot! That area of lava has saturated my color table for M-13 and it saturated the Fire Temperature RGB. As I’ve said before, only the hottest fires show up white in the Fire Temperature RGB and lava is among the hottest things you’ll see with VIIRS. Sometimes, you can see the heat from the volcano through clouds (and certainly through the ash plume)! It’s also neat to watch the river of lava extend out to the northeast and then cool.
To quantify it a bit more, the first day VIIRS was able to see the hot spot of Bárðarbunga (31 August 2014), the M-13 brightness temperature was the highest I’ve seen yet: 631.99 K. The other midwave-IR channels (M-12 and I-4; 3.7 and 3.74 µm, respectively) saturate at 368 K. The Little Bear Fire (2012) peaked at 588 K and that fire was hot enough to show up in M-10 (1.6 µm) during the day, so it’s no wonder that we’ve saturated the Fire Temperature RGB.
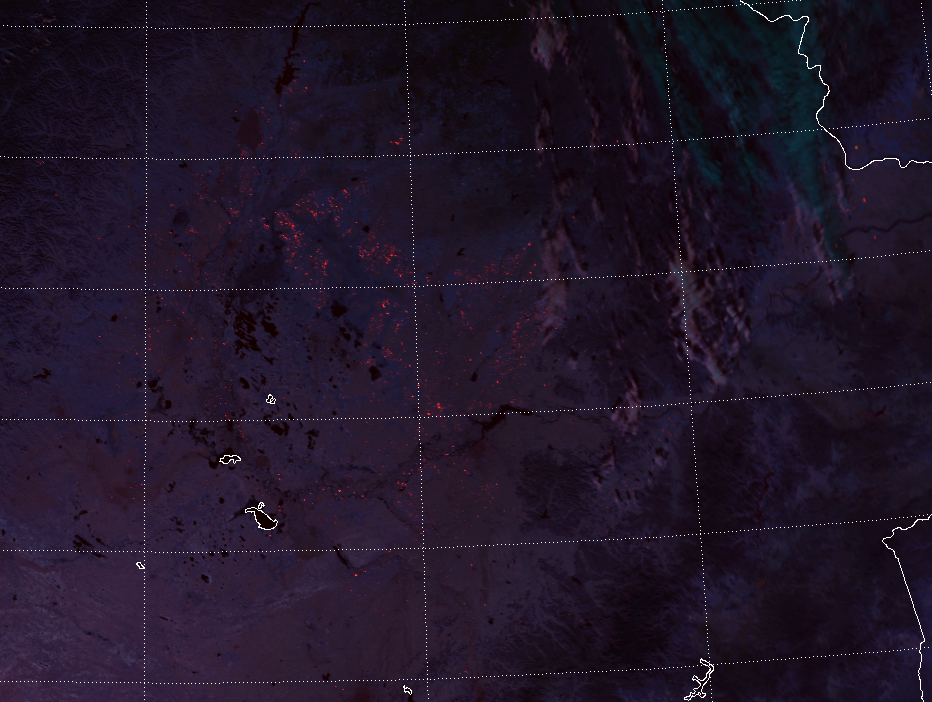
There’s one more interesting way to look at Bárðarbunga using a new RGB composite. When I was first tipped to this event, I saw this image from NASA, which you can read more about here. That image was taken by the Operational Land Imager (OLI) from Landsat-8 and is a combination of “green, near-infrared and shortwave infrared” channels. Applying this to VIIRS, that combination becomes M-4 (0.55 µm), M-7 (0.87 µm) and M-11 (2.25 µm), which is similar to the Natural Color composite (M-5, 0.64 µm; M-7, 0.87 µm; M-10, 1.61 µm) except for a few notable differences. M-4 is more sensitive to smoke and ash and vegetation than M-5. And M-11 is more sensitive to fires and other hotspots than M-10.
The differences are subtle, but you can see them in this direct comparison:
NASA calls this RGB composite “False Color with Shortwave Infrared,” although I’m sure there has to be a better name. Any suggestions?
Most of my images and loops have come from the first 45 days after eruption. This was a very active period for the volcano, and is where most of the previously mentioned videos came from. (And trust me, you and your browser couldn’t handle the massive animations that would have resulted from using all 100+ days of images.) To prove Bárðarbunga has gone on beyond that, here’s one of the new RGB composites from 17 November 2014:

This image really makes Iceland look like a land of fire and ice, which is exactly what it is!