Hot, Cold, Moist, Dry…
Jeff Braun
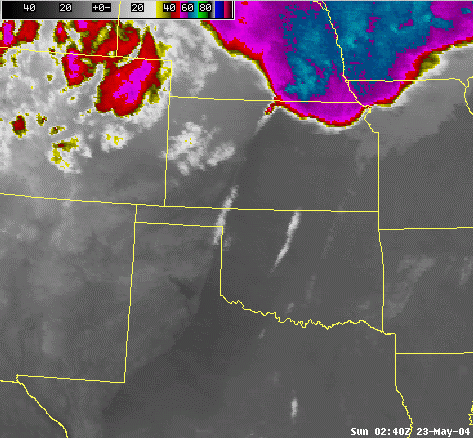
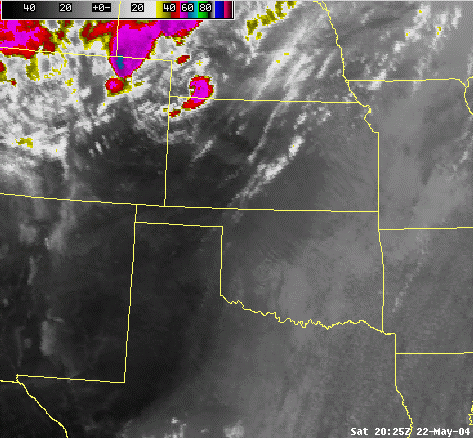
Just how many “words” is a picture worth anyway. With only the one image to work with (and very minimal, but important text) see if you can figure out the following.
In the above 10.7 um IR image, what is the “prominent” feature that shows itself from central Kansas south through the western portion of Texas? Can you locate (infer) and define the surface (low level) boundaries present in this image?
Using the same image below, where are surface (low level) temperatures most likely the warmest and coldest? (A, B, C, D, or E) Where is the surface (low level) moisture most likely the highest? The lowest? (A, B, C, D, or E)
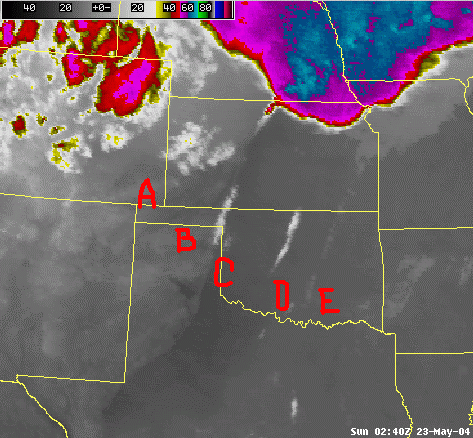
At which position (above) is there most likely more moisture near the surface (low levels)and why? (D or E)
Below is an IR image taken earlier in the day. Same region and enhancement as the previous image, however, the prominent “feature” that we have been taking about is now “colored” differently on either side of the boundary…i.e. the apparent temperature on both sides of the feature have been “reversed”. Why? What’s going on here?
 �
�
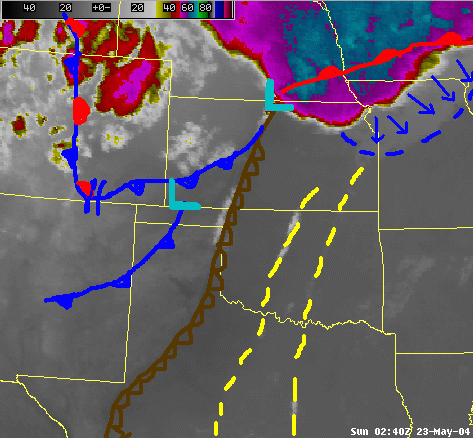
The point of this little excercise was to show the utility of using even a single image (IR in the case) to gather as much relative information as possible concerning the location of boundaries, then by noting the time of year (climatology) and the time of day (note: this is right at sunset for western Oklahoma), and piecing together the synoptic/mesoscale picture. (Below)I have drawn in the synoptic/mesoscale analysis. The prominent “feature” was the dryline. Note that (nearly) all the fronts, troughs, drylines, outflow boundaries can be clearly identified with some close (practiced) scrutiny of the image. In practice, you would (probably) never use only satellite data to analyze the situation, however, this method also points out the importance of satellite imagery to “fill in” both the temporal and spacial gaps that you get from using only ground based observations. Interesting side note – the outflow boundary depeicted moving southeast into northern Missouri provided focus for strong/severe storms the following day over the southern half of Missouri.
Just so you know, for all the reference points (A, B, C, D, E) there were clear sky conditions reported at this time (whereas earlier in the day, there were scattered to broken skies from D eastward). Clouds were present from the extreme eastern Oklahoma area (very near the border with Arkansas) and to points east. Surface elevations would have been nice to have been known, however, once again this excercise was to show just what could be gleaened from limited data and a single picture…and an assumption can be made that in the imdediate vicinity of each boundary, that the elevation change is negligable (except for the Cap Rock region of the Texas panhandle and Rocky Mountains of course). In this case, the dryline has pushed back (west) along the Cap Rock over the southern half of the panhandle (south of Lubbock), but is still east of the canyon region north of Lubbock.
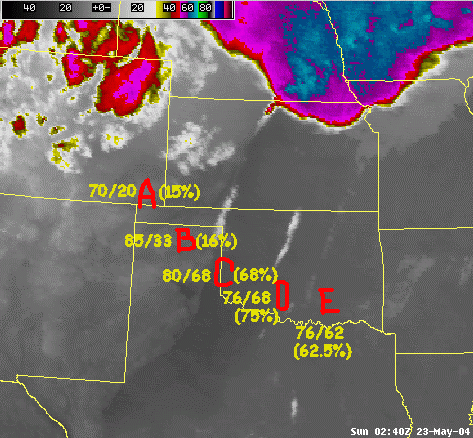
Obviously, now that we have mapped the synoptic/mesoscale features Iabove), it becomes a lot easier to answer the temperature/moisture questions. So, concerning temperature and moisture…(below) I have added the temperatures/dew points and (relative humidity) for each section. Note the apparent differences in the “color temperature” across the boundaries. While this makes it easy to identify the boundaries separating those different air masses, it doesn’t necessarily tell us why…or does it? The cold front across kansas and to some extent over the panhandles of Oklahoma and Texas are no-brainers. We would expect to “see” cooler (and relatively drier) temperatures here. However, at “B”, we have the warmest temperature in the region (85degF), yet the “apparent” (relative) temperature is showing it to be cool compared to “C” (80degF). This condition is largely due to the presence (absence) of moisture and the depth of the moisture (where elevation info would have been helpful). At “B” (west of the dryline) there is a dew point depression of 52degF (15% RH and a gain in elevation) telling us that it’s easier to radiate out heat when it’s dry and what moisture there is, is relatively shallow. At “C” it “looks” warmer (even though it’s some 5degF cooler), however, dew point depressions are only running about 12degF (68% RH). There is also an increase in depth of the water vapor with a nearly saturated layer running up to around 850mb. This tells us that moist air loses energy much more slowly than does dry air (and it also gains energy more slowly) (see the differences in heat capacity/specific heat of dry air vs. moist). Behind the cold front is obvious, however the differences between “C”, “D”, and “E” are not so apparent. “C” has the warmest surface temperature (80degF), but the same dew point as “D” and both “D” and “E” have the same surface temperatures, but different dew points (68degF at “D” vs 62degF at “E”). RH values for “C”, “D”, and “E” are 68%, 75%, and 62.5% respectively. The difference, if you largely ignore elevation changes from “C” to “E” and remember that this is just right at (or slightly after) sunset , in the apparent “cooling” from west to east is most likely due to the depth of the moisture being greatest at “C”… with moisture depth falling of as you head eastward (from around 850mb to just under 900mb – from soundings). Again, those areas with the greatest moisture (depth) will cool off more slowly than those with less moisture (depth).
As for the third image and the reason that it has a different “look” to it (i.e. the warm cold regions have been “reversed”): Notice the time of day…right during the mid/late afternoon and max heating time. For reasons that we have already covered concerning the way the dry air (shallow moisture) heats up differently than moist (deeper) air…it takes more energy (longer time period) to heat up moist air than dry. Therefore the “warmest” areas appear west of the dryline and in the dry air (duh)…with cooler areas east ofthe dryline boundary. Note: There are also clouds present (cumulus cloud streets and strato-culmulus) over most of eastern Oklahoma at this time. �

