Forecasting Convective Downburst Potential – by Ken Pryor (NESDIS)
The VISIT lesson “Forecasting Convective Downburst Potential Using GOES Sounder Derived Products” presents current applications of a suite of GOES sounder-derived products. A recent concern pertaining to the GOES sounder products is the current temporal and spatial resolution (60 minutes, 10 km). The GOES-R Advanced Baseline Imager (ABI) has promising capability as a sounder with greatly improved temporal and spatial resolution as compared to the existing GOES (8-P) sounders. However, until GOES-R soundings and associated derived products are operational, a need has been established for a higher resolution GOES-derived microburst risk product. Accordingly, a multispectral GOES imager product has been developed and experimentally implemented to assess downburst potential over the western United States with improved temporal and spatial resolution. The availability of the split-window channel in the GOES-11 imager allows for the inference of boundary layer moisture content. The experimental product is available on the web:
http://www.star.nesdis.noaa.gov/smcd/opdb/kpryor/mburst/mbimg.html.
The GOES-West (GOES-11) imager microburst algorithm employs brightness temperature differences (BTD) between band 3 (upper level water vapor, 6.7um), band 4 (longwave infrared window, 10.7?m), and split window band 5 (12um). A study of the relationship of water vapor radiance and layer-average relative humidity has found a strong negative correlation between 6.7um brightness temperature and layer-averaged relative humidity between the 200 and 500-mb levels. Thus, large BTD between bands 3 and 5 imply a large relative humidity gradient between the mid-troposphere and the surface, a condition favorable for strong convective downdraft generation due to evaporational cooling in the sub-cloud layer. This product provides a higher spatial (4 km) and temporal (30 minutes) resolution than is currently offered by the GOES sounder microburst products (10 km, 60 minutes) and thus, provides useful information to supplement the sounder products in the convective storm nowcasting process.

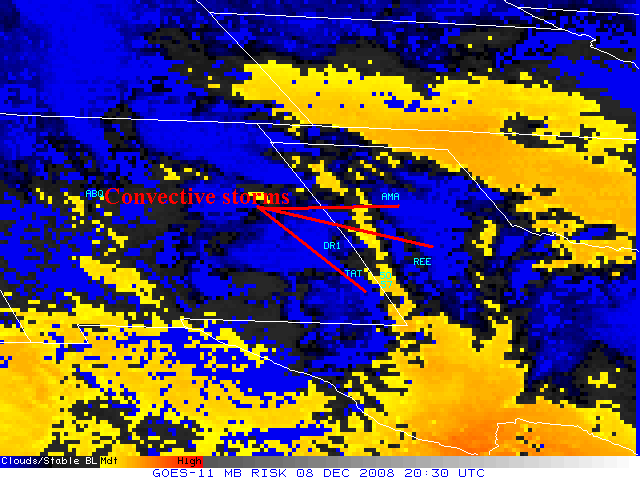
The image above is a recent example of the GOES-11 imager microburst risk product at 2030 UTC 8 December 2008. Apparent in the product image is clusters of convective storms over the western Texas Panhandle and over eastern New Mexico that would track eastward over western Texas during the following three hours. Associated with the convective storm cluster near the New Mexico border were downburst wind gusts of 50 and
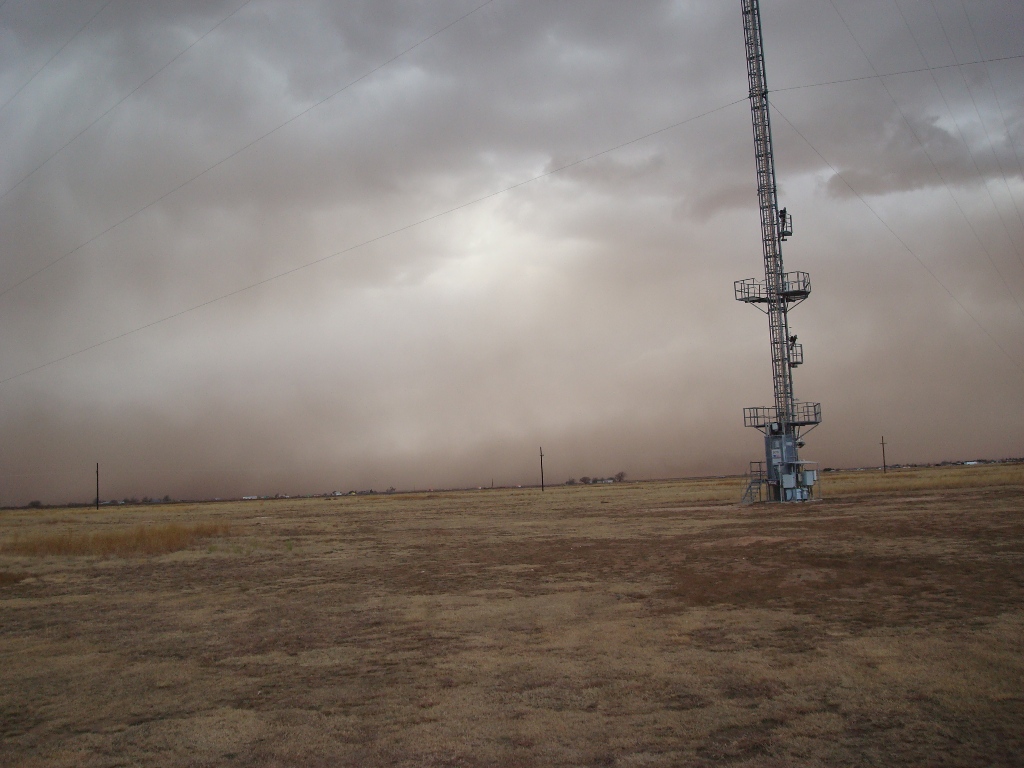
57 knots (plotted in image near the New Mexico border) that were recorded by Plains and Denver City (West Texas) mesonet stations at 2115 UTC. Note that the downbursts occurred in close proximity to elevated imager microburst risk values. The downbursts resulted in the generation of a dust storm over western Texas that affected the Lubbock area (see below).

(Photo: Texas Tech University – West Texas Mesonet) For more click here.
For more information about the GOES imager microburst product, please review the paper published in the preprints of the 16th Conference on Satellite Meteorology and Oceanography:http://ams.confex.com/ams/89annual/techprogram/paper_147786.htm.
