Forecasting Convective Downburst Potential: Update
Ken Pryor (NESDIS)
The VISIT lesson “Forecasting Convective Downburst Potential Using GOES Sounder Derived Products” presents current applications of a suite of GOES sounder-derived products. The lesson has been recently revised to include updated imagery examples, and new case studies of downburst events that occurred over the United States Great Plains during June and August 2009. The cases demonstrated the effectiveness of coordinated use of the GOES Microburst products in evolving convective storm environments. The objective of the lesson is to provide better understanding of techniques for predicting the risk of convective downbursts utilizing GOES sounder derived data. The guide for the lesson is available at the following web address: http://www.cira.colostate.edu/ramm/visit/downburst.html . Also revised is the audio playback version of the lesson, also available on the student guide page. An example of one of the case studies of a significant downburst event is summarized below.
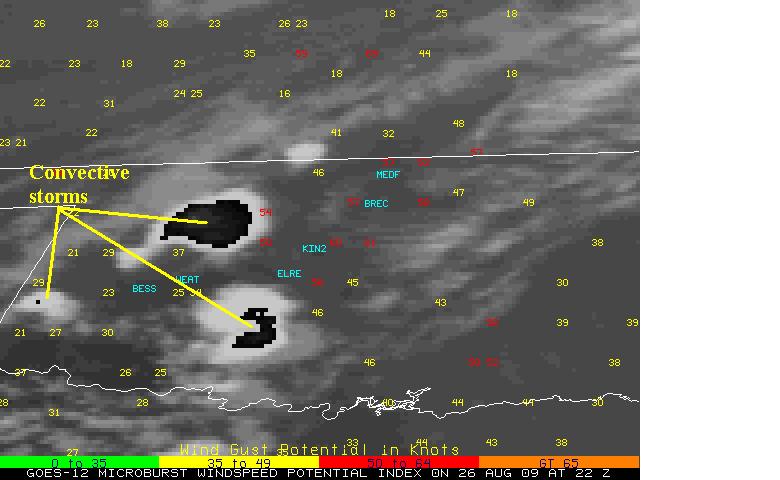
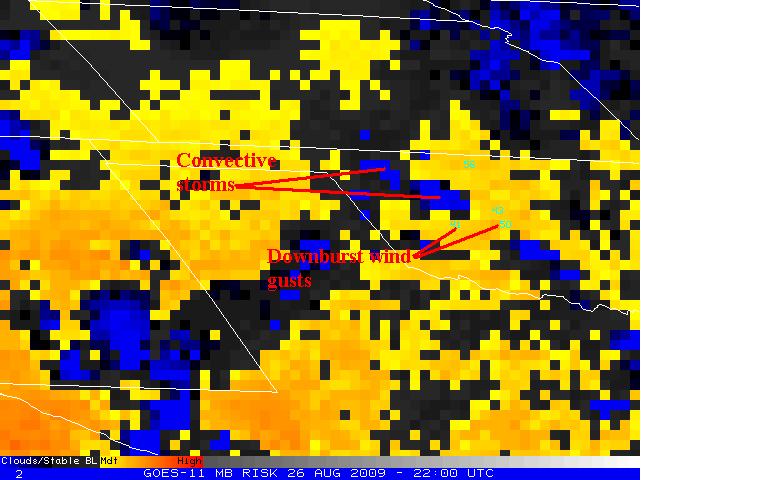
During the afternoon of 26 August 2009, strong convective storms developed along a weak, slow-moving cold front as it was tracking eastward over Oklahoma. Although there was very little temperature contrast across the front, the front acted as a convergence zone and a trigger for deep, moist convection. The pre-convective environment downstream of the cold front over western Oklahoma was dominated by vertical mixing that fostered the development and evolution of a convective boundary layer. Elevated Geostationary Operational Environmental Satellite (GOES) imager brightness temperature difference (BTD) values (yellow to orange shading) and Microburst Windspeed Potential Index (MWPI) values in the vicinity of downburst occurrence over western Oklahoma served as evidence of the presence of a well-developed mixed layer. Strong downbursts that were recorded by Oklahoma Mesonet stations between 0000 and 0100 UTC 27 August resulted from a combination of precipitation loading and sub-cloud evaporation of precipitation. These downbursts occurred in proximity to moderate to high microburst risk values as indicated in the 2200 UTC GOES microburst products.

The images above are a Geostationary Operational Environmental Satellite (GOES) imager microburst product at 2200 UTC 26 August 2009(top) and a corresponding GOES sounder Microburst Windspeed Potential Index (MWPI) product (bottom), with the location of Oklahoma mesonet observations (i.e BESS, WEAT, etc.) of downburst wind gusts plotted on the MWPI image. Both product images displayed convective storms developing along the cold front over western Oklahoma. Convective storm activity increased in coverage near the cold front during the following three hours. Downburst wind gusts between 41 and 56 knots were recorded by the Oklahoma Mesonet stations plotted in the MWPI image above between 0000 and 0100 UTC 27 August.
The following are significant downbursts recorded by the Oklahoma Mesonet during this event:
Station – Time (UTC) – Wind Gust (knots)
Bessie – 0005- 50
Kingfisher – 0020 – 43
Weatherford – 0030 – 41
El Reno – 0040 – 50
Medford- 0055 – 56
Also important to note the general increase in MWPI values from southwest (BESS) to northeast (MEDF) associated with a progression from hybrid to stronger wet type downbursts. Downbursts over western Oklahoma were predominantly “hybrid” type, while over north-central Oklahoma (MEDF, BREC), downbursts were “wet” type associated with heavy rainfall.

