Severe thunderstorms over southwest Arkansas on 10 March 2010
Jeff Braun, Louie Grasso and Dan Lindsey
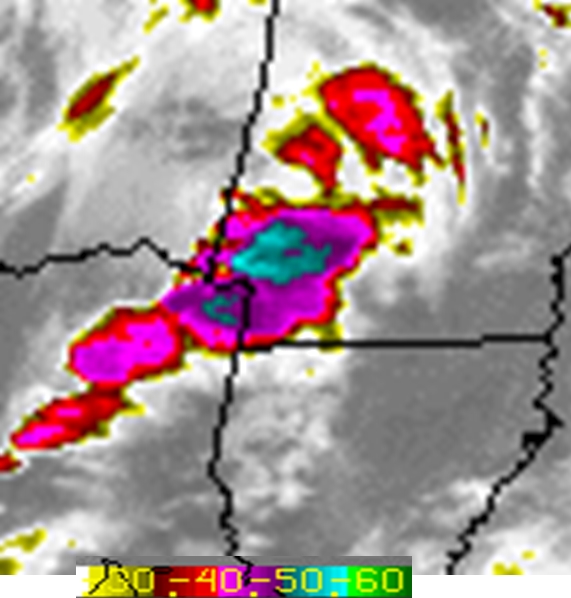
Figure 1: GOES-12 10.7 µm on 10 March 2010 at 2115 UTC. Color table shows enhances temperatures in Celsius.
On the afternoon of 10 March 2010, thunderstorms developed over northeast Texas. These storms moved northeastward into southwest Arkansas. A GOES-12 10.7 µm image at 2115 UTC shows the location of the storms (Figure 1). Note the rather small enhanced V signature over the storm in extreme northeast Texas. Likewise, a larger, although not as pronounced, enhanced V signature was evident over the storm in southwest Arkansas. As seen in the color table in Figure 1, cloud top temperatures were near -50 C in and around the enhanced V signatures.
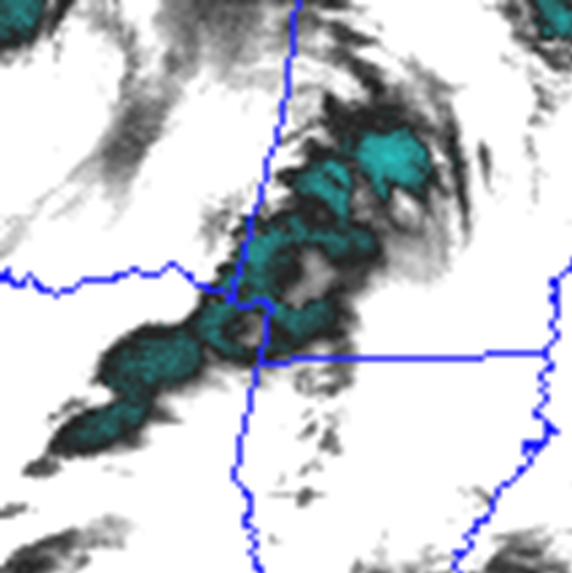
Figure 2: GOES-12 3.9 µm on 10 March 2010 at 2115 UTC.
A different pattern was evident in the 3.9 µm image for the same two storms (Figure 2). The speckled green region in both these storms bounds a grey region. This grey region represents brightness temperatures near -10 C. This suggests that more solar energy at 3.9 µm was reflected back to GOES-12 from the grey region.
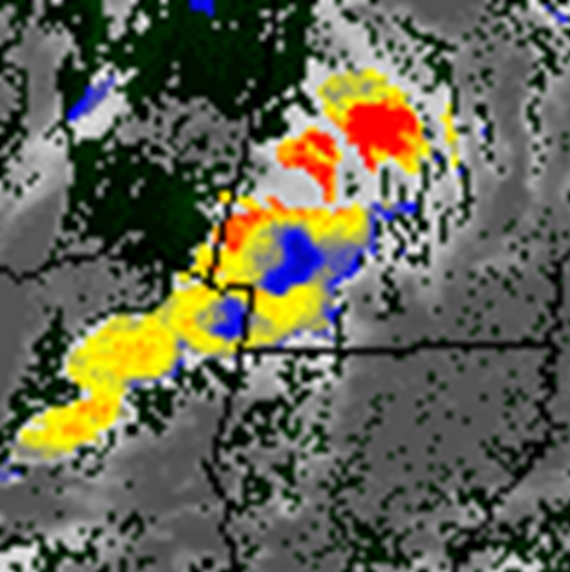
Figure 3: GOES-12 ice particle size on 10 March 2010 at 2115 UTC. Small particles are blue, medium sized are yellow, and large are red.
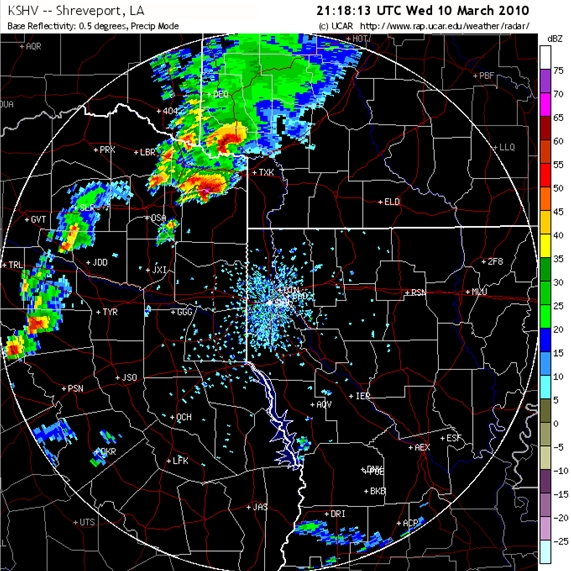
Both the 10.7 and 3.9 images are used to retrieve ice particle size, results are shown in Figure 3. In this figure, the largest particles are represented by red, while the smallest particles are represented by blue. A comparison between Figures 2 and 3 shows that the smallest particles are the most reflective. An open question is, “What can one infer about the behavior of a storm based on the reflective nature of the anvil of the storm?” Figure 4 shows the base reflectivity from Shreveport, LA at approximately the same time as the satellite imagery.
Figure 4: Shreveport, LA radar base reflectivity on 10 March 2010 at 2118 UTC.


