The pre-storm environment for the 27 April 2011 tornado outbreak
Knowledge of various air masses and low-level convergence boundaries in the pre-storm environment is critical for a severe weather event. This blog post will examine the various air masses and boundaries associated with the 27 April 2011 tornado outbreak in the southeast.
First, we will examine the GOES 10.7 um infrared (IR) imagery during the overnight to early morning hours (0545 – 1315 UTC):
http://rammb.cira.colostate.edu/visit/web/27april11/loop_ir_early.asp
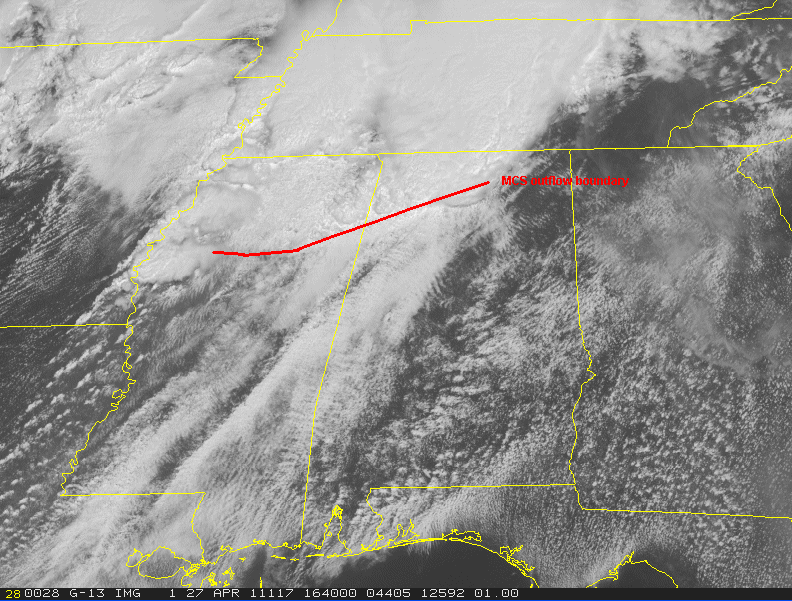
An MCS tracked across Mississippi and Alabama during the overnight hours. The coldest cloud tops tracked from central Mississippi northeastward through central Alabama and into Georgia. Usually the outflow boundary associated with an MCS will exist just south of the region of coldest cloud tops as this corresponds to the southern edge of the thunderstorm complex. Near the end of the loop, we see another thunderstorm complex developing in southeast Arkansas moving into northwest Mississippi.
We’ll pick up where the IR loop left off with the higher resolution GOES visible imagery (1332 – 1725 UTC):
http://rammb.cira.colostate.edu/visit/web/27april11/loop_vis_early.asp
Focus on central Alabama early in the loop, there is a distinct line between clear skies and low level cloud steets moving northward. As we get to the later segment of the loop, you can see north-south oriented lines within this region of low-level cloud streets. Some of these features are low-level convergence boundaries, others are gravity waves associated with a strong upper level jet that moves over the region. We’ll discuss this more later. The convection we observed in the earlier IR loop in northwest Mississippi is moving northeast with a distinct outflow boundary being left behind on its southern flank:

Let’s examine the air mass characteristics via this visible loop with METARs:
http://rammb.cira.colostate.edu/visit/web/27april11/loop_vis_obs.asp
Behind the outflow boundary in northern Mississippi and Alabama, we see a much more stable air mass. However, as we move forward in time, this outflow boundary is moving north as a warm front, note the strong southerly winds to the south of the boundary. Note the observation of 67/64 with north winds on the 1825 UTC visible image in north central Alabama, by the 1932 UTC image, this site is now 75/72 with south winds. A similar trend is seen in northeast Mississippi. Look further south in central Alabama, the whole region has destabilized considerably and we can see numerous north-south oriented lines which we will examine next.
This is the GOES visible imagery from 1545 – 2132 UTC:
http://rammb.cira.colostate.edu/visit/web/27april11/loop_vis_late.asp
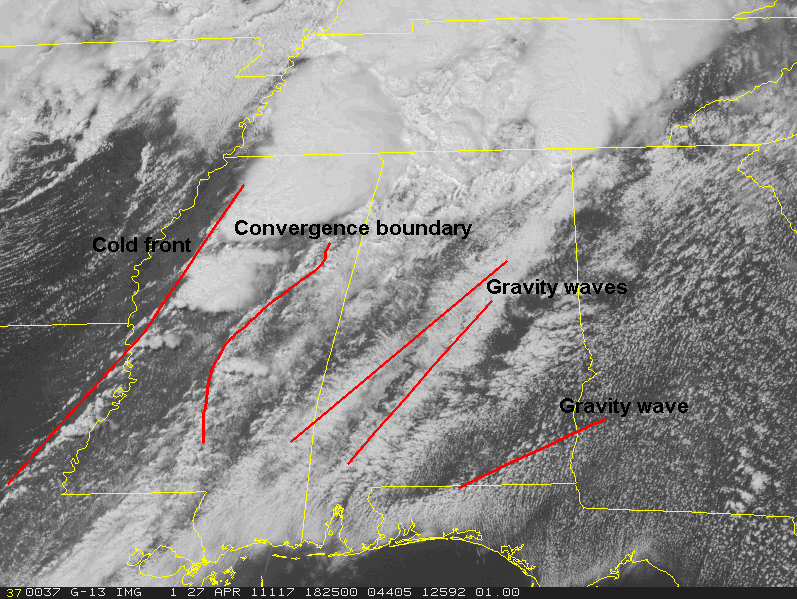
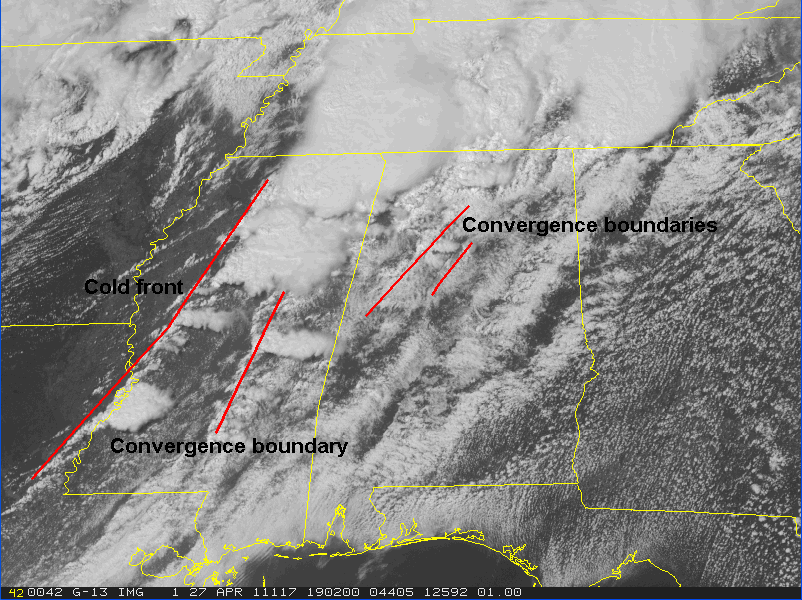
South of the MCS outflow boundary mentioned earlier, we see numerous north-south oriented lines in Mississippi and Alabama. Some of these are gravity waves associated with an upper level jet that are moving over the region, others are low-level convergence boundaries, some of which may be associated with the overnight MCS activity. One way to discriminate between gravity waves and low-level convergence boundaries is that convection may develop along the convergence lines while convection does not develop along the gravity waves since they exist at a higher level. Careful insepction of looping imagery can be compared with these labeled images to help identify the various low-level convergence boundaries:
Labeled visible image at 1825 UTC:

Labeled visible image at 1902 UTC:

Note the low-level convergence lines across central Alabama. Careful inspection of the looping imagery allows one to detect these features after the gravity wave passes to the east. The 0.5 degree tilt base reflectivity loop from the Birmingham WSR-88D also shows both of these boundaries in the vicinity of Tuscaloosa and Birmingham:
http://rammb.cira.colostate.edu/visit/web/27april11/loop_radar.asp
The boundaries are easier to see in the early portion of the loop but they become more subtle in the radar loop as times goes forward, and in the visible loop are obscured by anvil cirrus. Their location and orientation to storm motion would strongly indicate that they played a role later in the afternoon.
This case illustrates the importance of identification of low-level convergence boundaries. Some of these boundaries were relatively easy to identify, others were much more subtle. Be sure to use multiple sources of observational data when identifying boundaries, particularly when they are more subtle.
