March 2, 2012 Severe Weather Outbreak
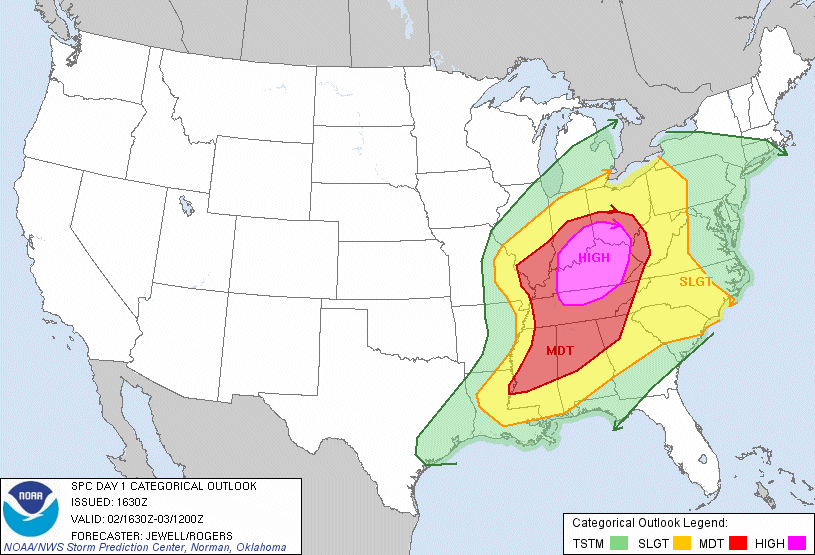
The severe weather event of March 2, 2012 was forecast well ahead of time by the Storm Prediction Center to be associated with significant severe weather:

An animation of GOES-13 visible imagery can be found here:
Sufficient clearing took place over a large portion of the High and Moderate risk areas during the day, allowing for heating to take place to increase CAPE values.
Numerous supercell thunderstorms developed across this region which resulted in many severe weather reports.
The early imagery between approximately 1500-1700 UTC depicts the storms that led to tornadoes in northern Alabama.
Further north in the warm sector, skies were primarily partly cloudy in Kentucky, central and western Tennessee, southern Indiana, and southern Illinois. This allowed insolation to occur and allow for the buildup of CAPE.
Convective initiation occurred in Missouri and Illinois in the early portion of this loop. Some thunderstorms developed along the cold front (further west), while other storms developed further to the east along a pre-frontal boundary. The southernmost of these storms developed in southern Illinois and and soon after initiation moved more to the right (eastward) compared to the other storms. This can be indirectly observed by the orientation of the anvil cirrus, which is more east-west oriented compared to other storms further west which have a northeast-southwest oriented anvil cirrus. This right moving storm went on to produce numerous tornado reports with significant damage in southern Indiana, northern Kentucky and southern Ohio. This is a classic example of a long-track tornado. Although there may have been broken segments in the tornado damage path (where the tornado may have lifted), the path of the supercell is readily detected.
The storms that developed in western Tennessee by 2030 UTC also appear to have initiated along a pre-frontal boundary, just east of the cold front. Between 2030 and 2125 a left-moving storm is observed in central Tennessee (note the storm with the northward storm motion). An east-northeast to west-northwest oriented outflow boundary is produced by this storm, which appears to have interacted with the pre-frontal storm mentioned earlier in the vicinity of Nashville. These outflow boundaries can intensify other storms via enhanced horizontal vorticity that becomes tilted by the storm’s updraft into vertical vorticity, so long as the magnitude of the cold pool isn’t so great that it stabilizes the air mass the storm is ingesting.
There are numerous other boundaries that we see in the visible later in the loop in Mississippi and Alabama. Some of these are obscured by cirrus from the sub-tropical jet moving into the area by the end of the loop.
