Microburst Risk Algorithm observes Favorable Conditions for Strong Convective Winds over the Chesapeake Bay
Ken Pryor (NESDIS / STAR)
A GOES sounder-derived Microburst Windspeed Potential (MWP) algorithm, based on convective available potential energy (CAPE), and vertical temperature and humidity lapse rates, and based on the vertical difference in equivalent potential temperature (theta-e difference, TED) between the surface and middle-troposphere (between 10,000 and 20,000 feet above ground level) recently observed favorable conditions for strong thunderstorm-generated winds over the Chesapeake Bay region. Theta-e is a measure of moist energy in the troposphere in which the vertical difference characterizes moisture stratification and infers the presence of a mid-tropospheric dry-air layer that, upon interacting with the storm precipitation core, can foster intense thunderstorm downdrafts. During the afternoon of 8 September 2012, a line of strong thunderstorms developed over piedmont region of Maryland and Virginia ahead of a cold front and then tracked eastward over the upper Chesapeake Bay region during the late afternoon. A segment of the squall line produced severe downbursts that were recorded by a NOAA buoy on the upper Chesapeake Bay and a Weatherflow station near Annapolis, Maryland. One-minute Super Rapid Scan (SRSO) imagery was available from GOES-14 during this event.


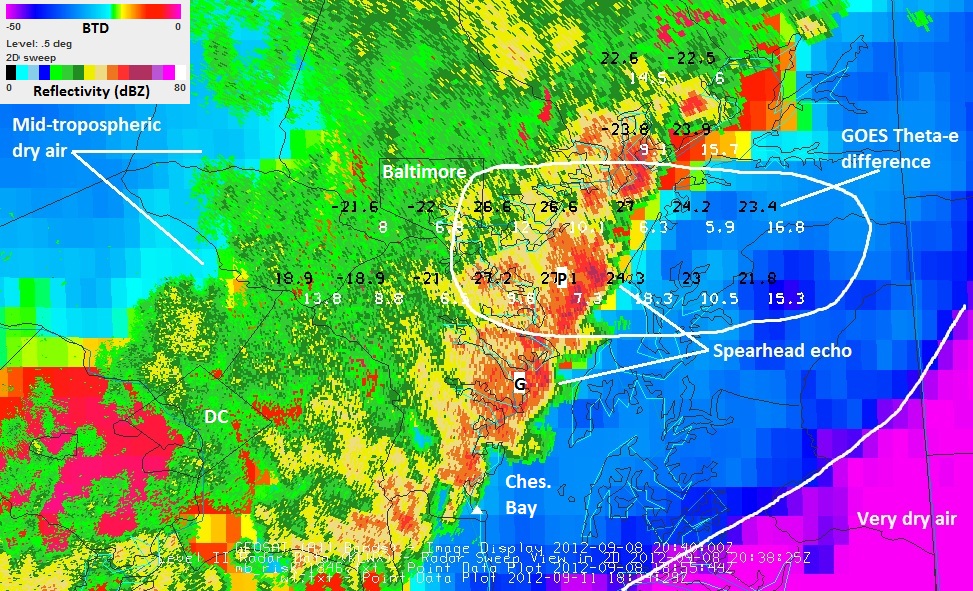
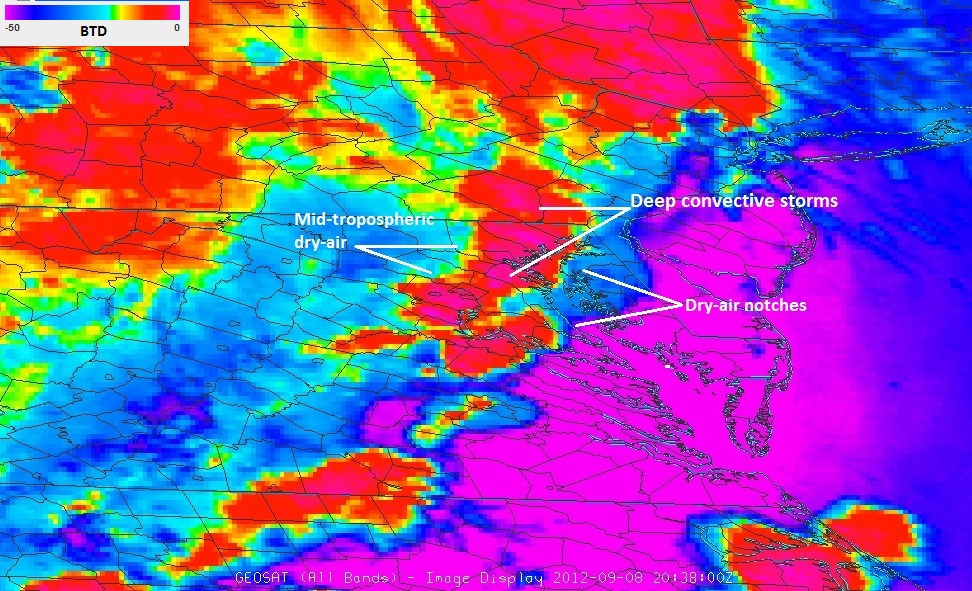
Composite Geostationary Operational Environmental Satellite (GOES)-13 WV-IR brightness temperature difference (BTD) – GOES sounder theta-e difference (TED) – NEXRAD reflectivity composite image at 2040 UTC 8 September 2012 (top) compared to a regional enhanced WV-IR BTD image from GOES-14 at 2038 UTC (bottom) as visualized by McIDAS-V. In the composite image, “P” represents the location of the Patapsco Buoy and “G” represents Greenbury Point Weatherflow station.
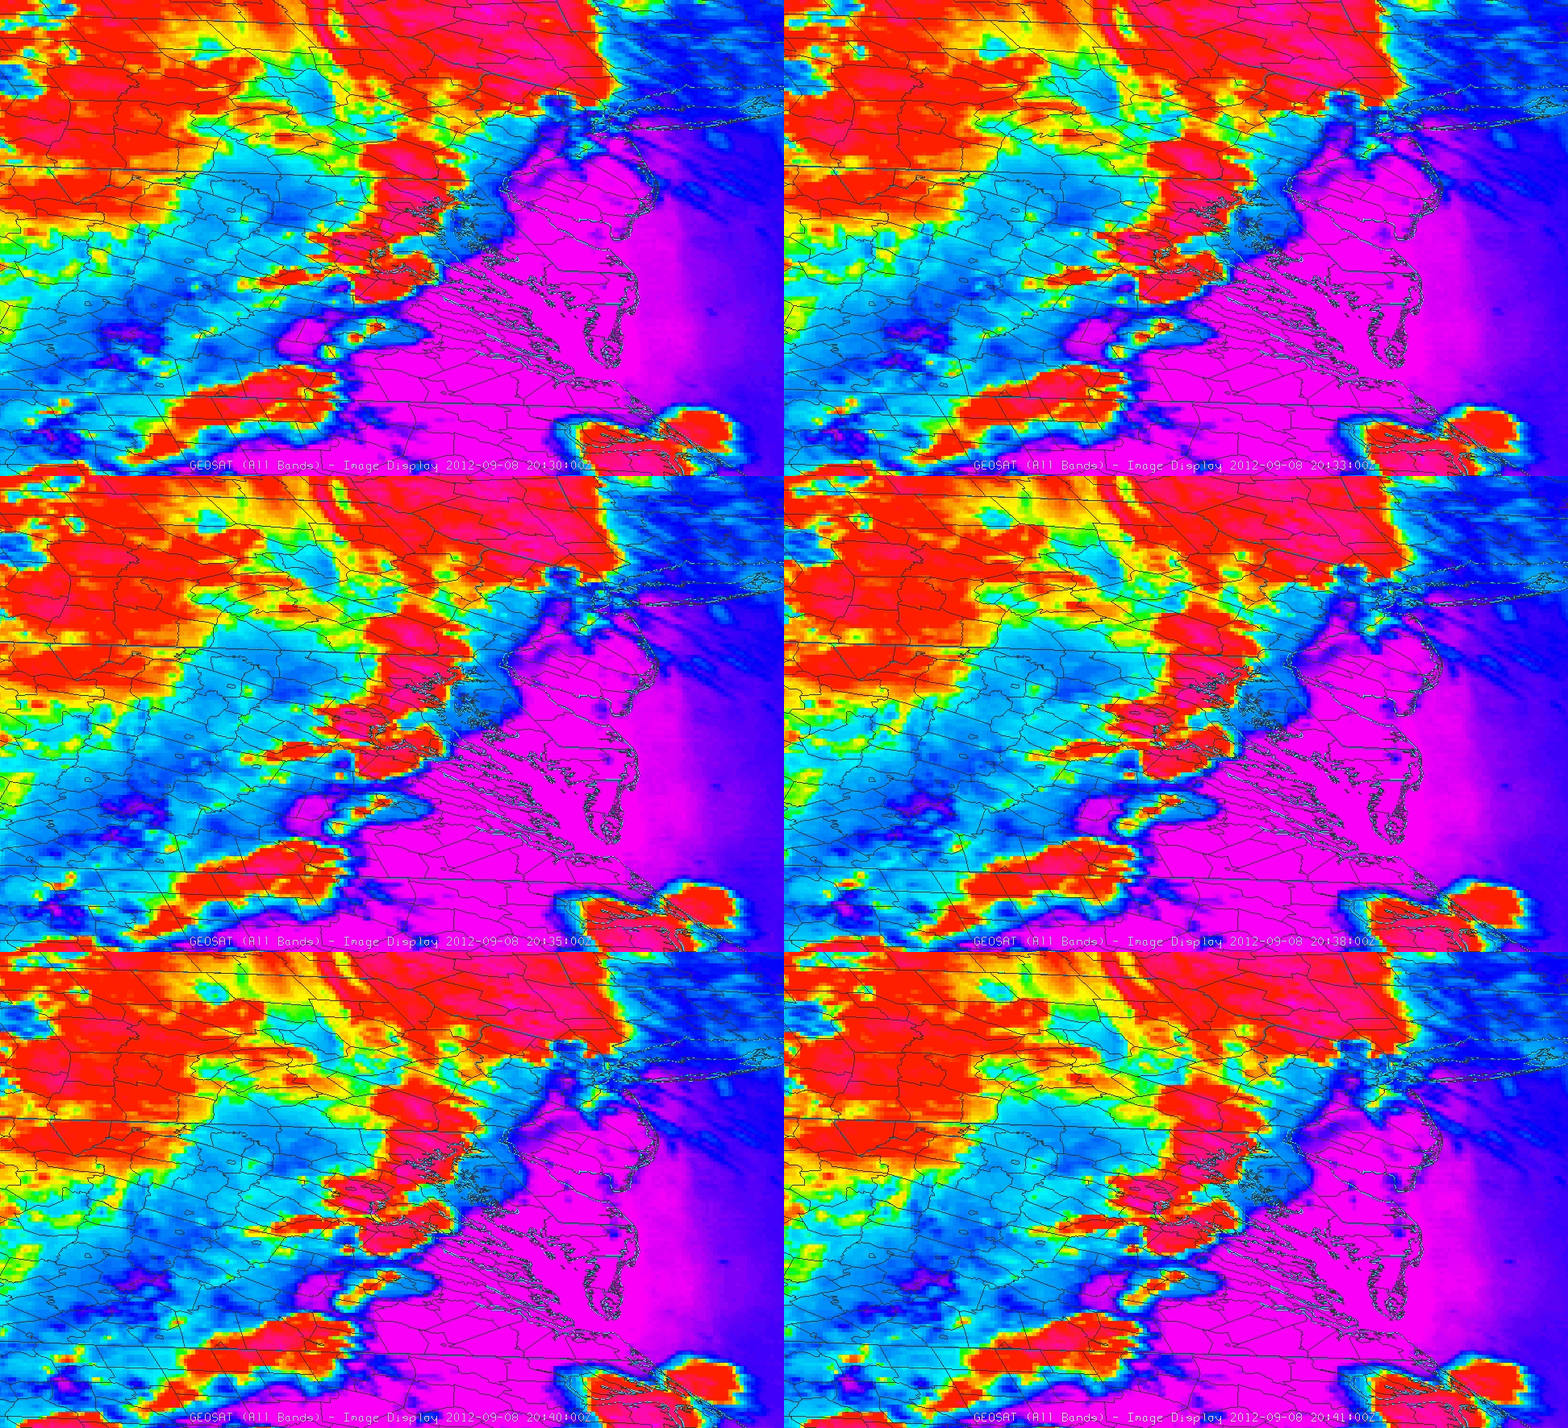
Downburst wind gusts of 40 and 43 knots were recorded by Greenbury Point Weatherflow station near Annapolis, Maryland and by the NOAA Patapsco Buoy in the upper Chesapeake Bay, respectively, between 2035 and 2040 UTC. As shown in the composite image in Figure 1, theta-e difference (TED) values greater than 20 (black values), corresponding to a high risk of downbursts, were indicated by GOES sounding retrievals over one hour earlier at 1855 UTC over the upper Chesapeake Bay. GOES-14 1-minute color-enhanced WV-IR BTD imagery, from 2030 to 2041 UTC, effectively displayed the interaction of dry-mid tropospheric air with the deep, moist convection cores of the squall line that resulted in strong downdraft generation. An interactive, web-based version of the animation is available at this link:
http://www.star.nesdis.noaa.gov/smcd/opdb/kpryor/mburst/srsoanim/btd_srso.html

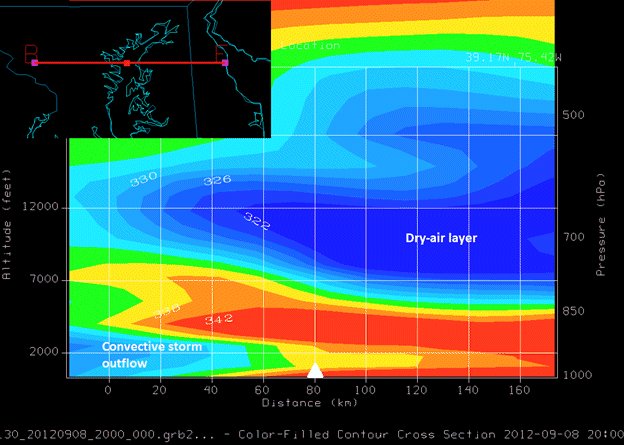
Large TED values, echoed by the theta-e cross section shown below, signified the presence of a prominent mid-tropospheric dry air layer, especially downstream of the squall line over the upper Delmarva Peninsula. As the precipitation in the deep, moist convective storms interacted with the dry mid-tropospheric air, downburst generation occurred that was confirmed by the presence of spearhead echoes in radar imagery and dry-air notches in the regional BTD image associated with the segment of the squall line moving over the upper Chesapeake Bay.

Rapid Refresh Model-derived theta-e cross section over the upper Chesapeake Bay region at 2000 UTC 8 September 2012. White triangle marks the location of the Patapsco Buoy.
Similar composite GOES-NEXRAD imagery for nowcasting downburst potential is described and presented in the VISIT lesson “Convective Downbursts”: http://rammb.cira.colostate.edu/training/visit/training_sessions/convective_downbursts/
