Synthetic imagery application of a snow event on March 5-6, 2013
The synthetic IR (10.35 um) imagery from the 0000 UTC 5 March 2013 NSSL WRF-ARW run:
forecasts a region of colder cloud tops from the Ohio Valley towards the mid-Atlantic states during the late afternoon to morning hours of March 6. This region of colder cloud tops is associated with an extra-tropical cyclone, so that a deformation zone is seen on the northwest flank of the system while further east we can see TROWAL development wrapping cyclonicaly around the surface low.
The forecast from the synthetic imagery can be compared with GOES IR (10.7 um) imagery over the same time period:
Overall, there is good agreement between the model forecast and the observed imagery with respect to the aforementioned deformation zone and TROWAL development with the system weakening by the end of the loop (the morning of March 6). Heavy snow occurred (up to a foot of snow in 6 hours) in portions of western Pennsylvania in association with this feature. By comparing the model forecast with the GOES imagery one can readily gauge confidence in the forecast for future times by noting how much agreement there is during the shorter term forecast range.
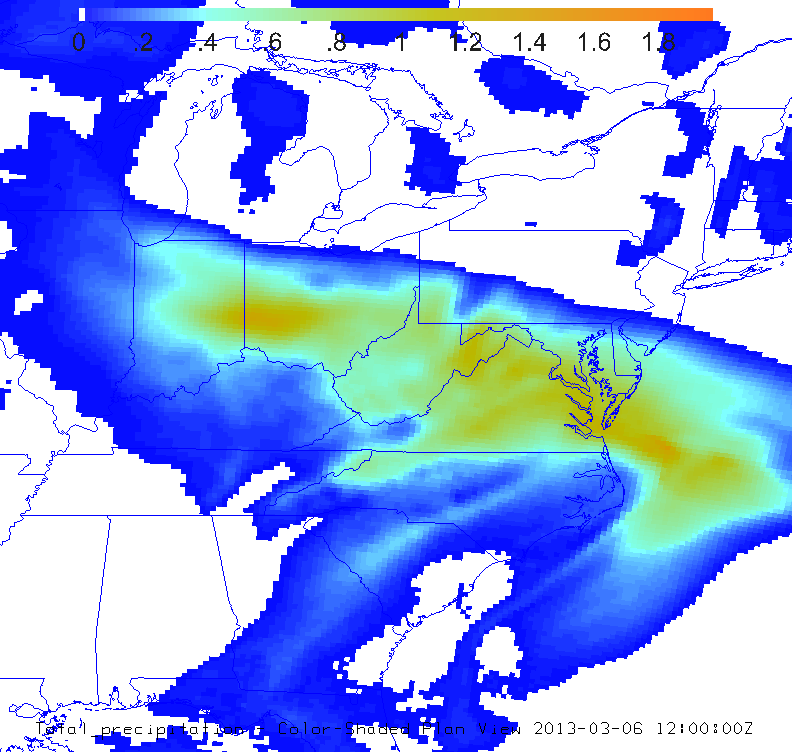
Interestingly, the 1200 UTC NAM run significantly underestimated the snowfall amounts in western PA:

This plot shows the accumulated QPF (inches) from 1200 UTC 5 March – 1200 UTC 6 March. The areas that received heavy snow mentioned above were on the northern edge of the QPF shield (in the 0.2-0.4″ range).
