Synthetic Imagery from the NAM Alaska Nest 4 km
By Jorel Torres, Dan Bikos and Lewis Grasso
A majority of National Weather Service (NWS) training is focused on satellite products for the CONtinental United States (CONUS). However, how can satellite products help NWS forecasters with satellite interpretation in Off CONUS locations such as Alaska? One goal is to use synthetic satellite imagery from the operational NAM Alaska Nest to aid in the identification of cloud liquid water in the winter, at times referred to as ‘Black Fog’.
An example of a satellite product is one in which the difference between two channels is employed. One way to identify cloud liquid water is to calculate the difference between brightness temperatures (Tb) at 10.7 and 3.9 um; that is, the fog product displays values of Tb(10.7 µm)-Tb(3.9 µm). In the fog product, cloud liquid water is indicated by positive values while ice clouds are indicated by negative values. Furthermore, liquid clouds and ice clouds can be differentiated optimally with no solar reflection. In order to eliminate solar reflection from synthetic imagery that is made from a 60-hour forecast from the NAM Alaska Nest, the time of any synthetic image is set to a value of 06 UTC. With the information above, one can use the fog product to aid in the identification of black fog in either observed or synthetic satellite imagery during the winter in Alaska.
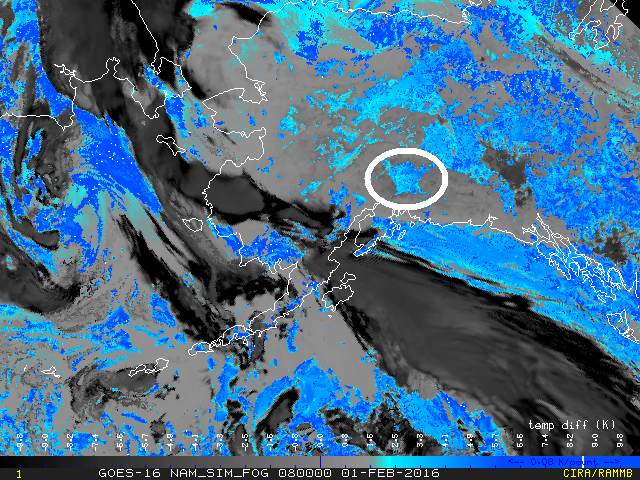
Figure 1: Synthetic Fog Product from the 0000 UTC, 31 January 2016 model run, 32-hour forecast valid at 0800 UTC, 01 February 2016. In this image liquid water clouds are shown as blue and ice clouds are shown in black. Values range from -9.8 to 9.8 K. The bold oval indicates a region that contains liquid water clouds in a low-lying area.
Figure 1 shows the Synthetic Fog Product displayed over Alaska from the 0000 UTC, 31 January 2016 model run, 32-hour forecast valid at 0800 UTC, 01 February 2016. As seen in the figure, liquid water clouds (blue) existed over both the Gulf of Alaska and over the state of Alaska. Black fog would be that portion of the liquid water field over the state of Alaska that is confined to low-lying areas and valleys (as an example, note region bounded by the white ellipse in Figure 1, northeast of Anchorage, AK). Although valley fog may be challenging to identify in one satellite image, an animation of the scene shown in Figure 1 can ease the challenge (please click for a 31 January- 03 February 2016 animation). Note the model updates to the latest run between 0800 and 0900 UTC (for each day) in the animation.
During the time period between 0000-1200 UTC in the animation there is a specific region that contains a liquid cloud layer as shown by the white ellipse northeast of Anchorage. The liquid cloud layer is stagnant and can be inferred that the layer is contained in a valley, demonstrating similar characteristics of fog or low stratus clouds.
In Alaska and the CONUS, detecting fog and low-lying clouds are of high priority among the Aviation Weather Centers (AWC), where they, in turn, inquire assistance from local NWS forecasters. Both AWC and NWC forecasters have many options to use to identify fog and low-lying clouds; however, products must demonstrate value. A way to assess the value of the Synthetic Fog Product is to compare the synthetic imagery to the observations. If observed imagery supports synthetic imagery, then forecasters can have confidence in the forecast of the Synthetic Fog Product.
Synthetic imagery is typically compared to observed imagery from the Geostationary Operational Environmental Satellite (GOES)-15. However since Alaska is the region of interest, this comparison has one disadvantage. GOES-15 imagery contains distortions of data at higher latitudes. Consequently, forecasters can take advantage of the utility of polar-orbiting satellites. A few polar-orbiting satellites have been launched in recent years, ranging from the National Oceanic and Atmospheric Administration (NOAA) satellites (NOAA-18, NOAA-19) to the Suomi-National Polar-orbiting Partnership (Suomi-NPP) satellite. Suomi-NPP is a more comprehensive satellite compared to other polar-orbiting satellites, as it contains more spectral bands (22), finer resolution and enhanced capabilities.
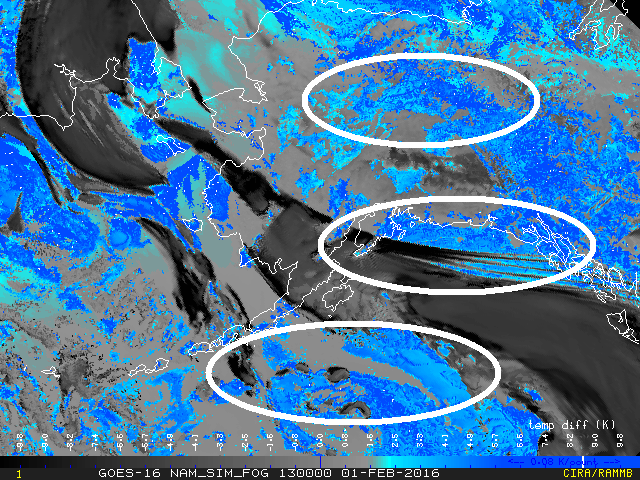
An instrument on board Suomi-NPP is the Visible Infrared Imaging Radiometer Suite (VIIRS), which for illustrative purposes, is used to evaluate synthetic imagery. Similarities and differences between VIIRS data (Figure 2A) and synthetic imagery (Figure 2B) are important to identify. For illustration purposes, images are chosen near 1300 UTC, 01 February 2016. When viewing the regions within the three white ellipses in Figure 2, liquid clouds are seen approximately in the same locations in both the observations and the synthetic imagery. However, the observations shows smaller (larger) regions of liquid clouds in northern (southern) Alaska when compared to the synthetic imagery. The location of liquid clouds could vary due to the off-set time comparison: observations taken at 1245 UTC compared to synthetic imagery at 1300 UTC. Nevertheless, the synthetic imagery shows the capability of detecting liquid clouds while being in relative agreement with observations. As a result, forecasters can have more confidence in the utility of forecasted synthetic imagery from the operational NAM Alaska Nest.
A)

B)
Figure 2: Fog Product near 1300 UTC, 01 February 2016 from (A) Observed VIIRS data and (B) and corresponding forecast time from the NAM Alaska Nest synthetic imagery. The regions bounded by the three ellipses are used to compare and display locations of liquid water clouds in and around Alaska.
For the interested reader, additional VIIRS imagery in the Arctic and real-time synthetic imagery from the NAM Alaska Nest can be seen via the links below.
VIIRS imagery in the Arctic
http://rammb.cira.colostate.edu/projects/alaska/blog/
Synthetic Imagery from the NAM Alaska Nest


