Atmospheric River event of 7-9 January 2017
A significant atmospheric river affected the west coast on 7-9 January, 2017. The GOES water vapor imagery shows the development of clouds associated with an approaching trough off the west coast, these clouds advected into the west coast:
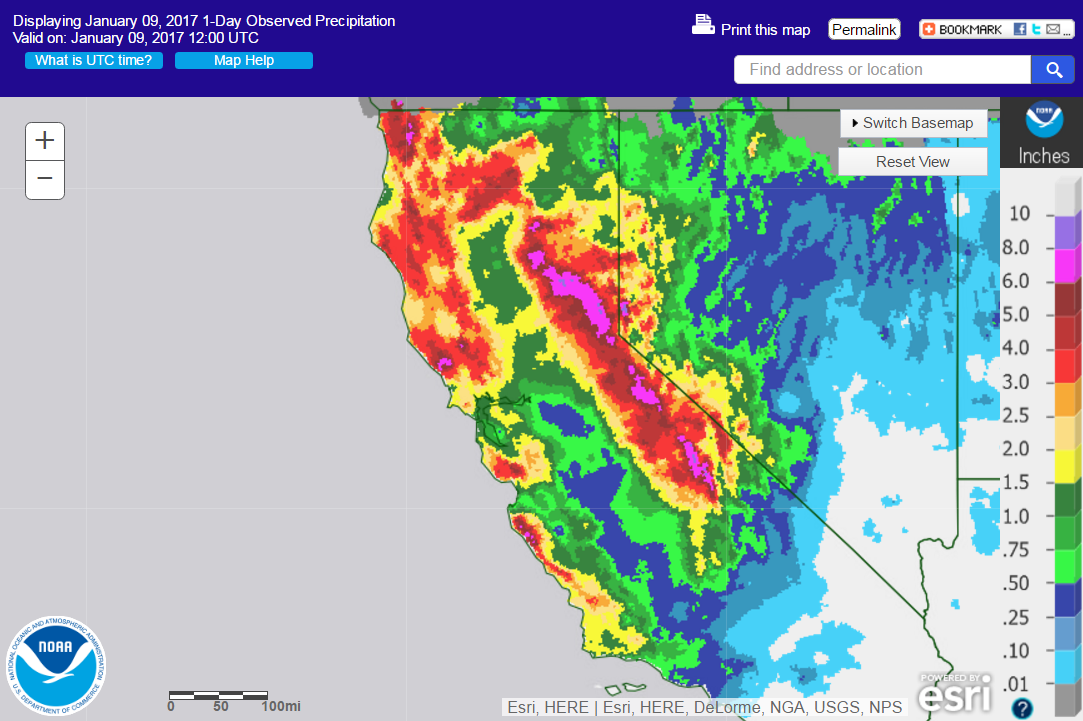
and resulted in significant precipitation across California:
at times, we can infer moisture from the water vapor imagery. In this case we can infer abundant moisture where the clouds develop and advect onshore, however the water vapor channel is not the best way to assess moisture. Instead, making use of a satellite derived moisture product (i.e., precipitable water) is a much better approach. The CIRA layered precipitable water (PW) product:
Provides not only a plan view of the moisture, but also a 3-dimensional perspective since it observes moisture at different layers in the vertical. The lowest layer (upper left) is the PW (units are inches) in the surface to 850 mb layer, the upper right is the PW in the 850-700 mb layer, the lower left is the PW in the 700-500 mb layer, and the lower right is the PW in the 500-300 mb layer. Typically the greatest magnitude of moisture is found in the lowest layer, however what the mid/upper level layers provide can be very important for significant precipitation events. Usually, significant precipitation events are characterized by relatively high precipitation efficiency, which tends to exist in an environment that is saturated through a deep layer. Therefore, if the PW is relatively high in the lower, mid and upper levels, the precipitation efficiency is near 100%. As you may suspect, the PW values in all 3 layers for this case are quite high. Keep in mind, this product utilizes data from polar orbiting microwave instruments which means they can see through (most) cloud cover, unlike the GOES Imager or Sounder instruments.
The Orographic Rain Index (ORI) is a product developed by CIRA made specifically for these type of Atmospheric River (AR) events. The product is based on research by Alan White and others from NOAA/PSD that investigated water vapor transport into terrain for AR events. ORI produces an index related to this water vapor transport using satellite derived TPW combined with GFS winds and high resolution terrain data. The idea is to highlight regions of terrain induced short-term flooding potential. For this particular case, the ORI product:
shows higher values oriented along various ridgelines in central California that would be most susceptible to flooding for this storm. A more detailed description of ORI can be found at http://rammb.cira.colostate.edu/research/goes-r/proving_ground/cira_product_list/orographic_rain_index.asp
Real-time data is available at:
http://rammb.cira.colostate.edu/ramsdis/online/goes-r_proving_ground.asp#Orographic_Rain_Index_(ORI)
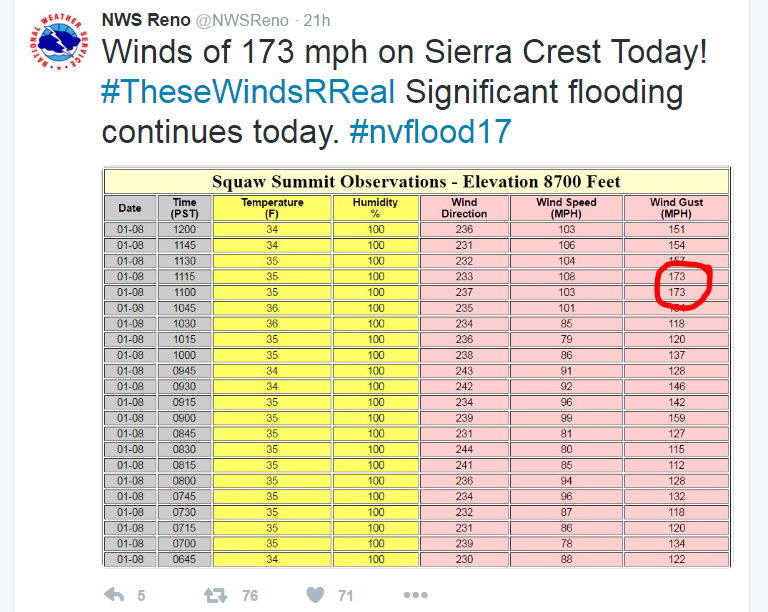
Atmospheric Rivers typically have relatively strong winds in the low to mid layer to help advect moisture rapidly. The winds in this layer were particularly strong for this event, with wind gusts as high as 173 mph observed:


