GOES-16 7.34 micron band applications for the 6 March 2017 event
The GOES-16 data posted on this page are preliminary, non-operational data and are undergoing testing. Users bear all responsibility for inspecting the data prior to use and for the manner in which the data are utilized.
Authors: Dan Bikos, Chris Gitro, Ed Szoke and Chad Gravelle.
On 6 March 2017, a developing cyclone moved eastward across the central US, causing a number of hazards including severe thunderstorms, strong winds and wildfires. This blog entry will focus on GOES-16 applications of the 3 water vapor bands, in particular, the 7.34 micron band. The 3 water vapor bands may be viewed in this animation:
http://rammb.cira.colostate.edu/training/visit/loops/6mar17/loop.gif
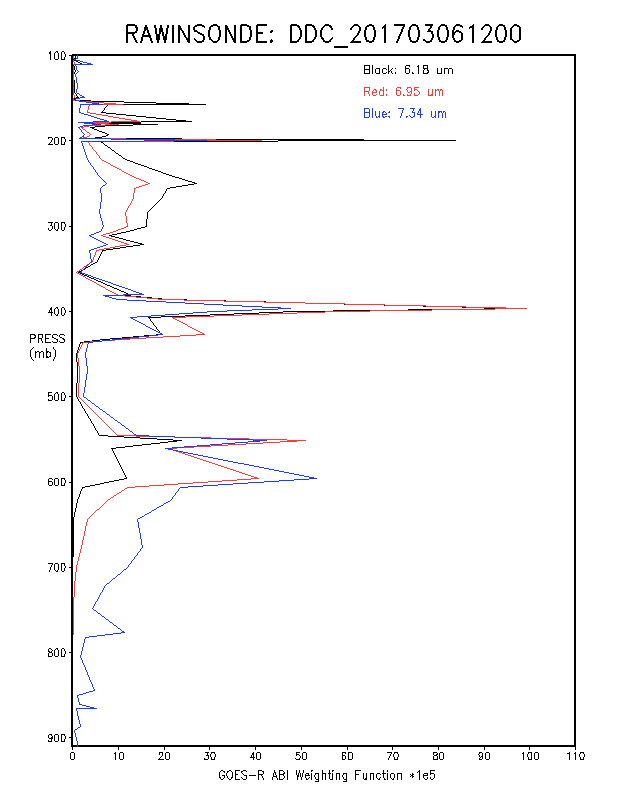
Upper left image is the 7.34 micron (low-level water vapor) band, upper right image is the 6.95 micron (mid-level water vapor) band, lower left image is the 6.19 micron (upper-level water vapor) band, and lower right are surface observations with surface fronts annotated. Analyzing the 3 water vapor bands in tandem provides a three-dimensional perspective since the bands “see” different levels in the vertical, where it “sees” can be identified from the weighting function profile of each band. The GOES-16 weighting function profiles for clear sky conditions based on the 12Z sounding at Dodge City, KS for the three water vapor bands:
Indicates the relative contribution in the vertical for each band. All 3 bands show two peaks in weighting function profiles, near 400 mb and between 550 and 600 mb, however note the 7.34 micron band (blue line) has a more significant contribution as we look lower in altitude. The 7.34 micron band has a peak weighting function around 600 mb, and generally is looking lower in the atmosphere than the other two water vapor bands. This is the level we typically find important meteorological phenomena such as the elevated mixed layer (EML) or elevated cold front (ECF) therefore this band is better suited to identify these features compared to the other 2 water vapor bands.
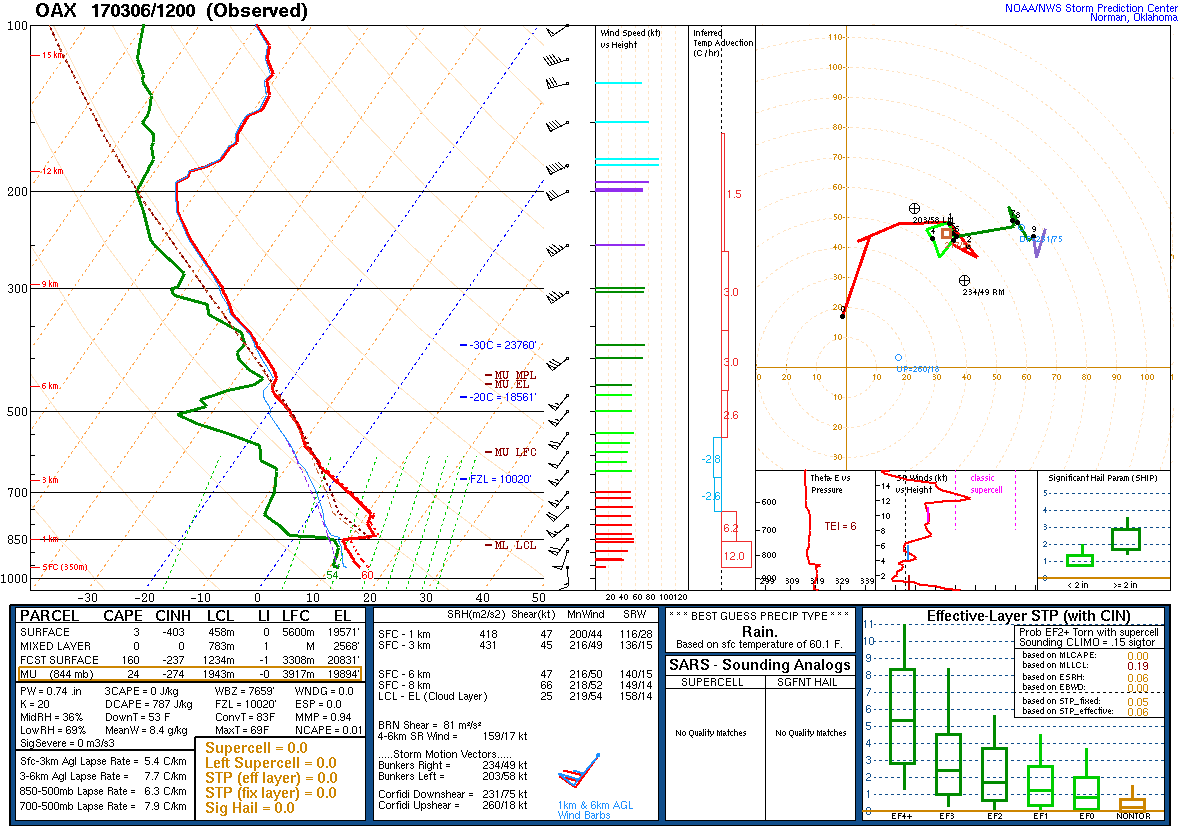
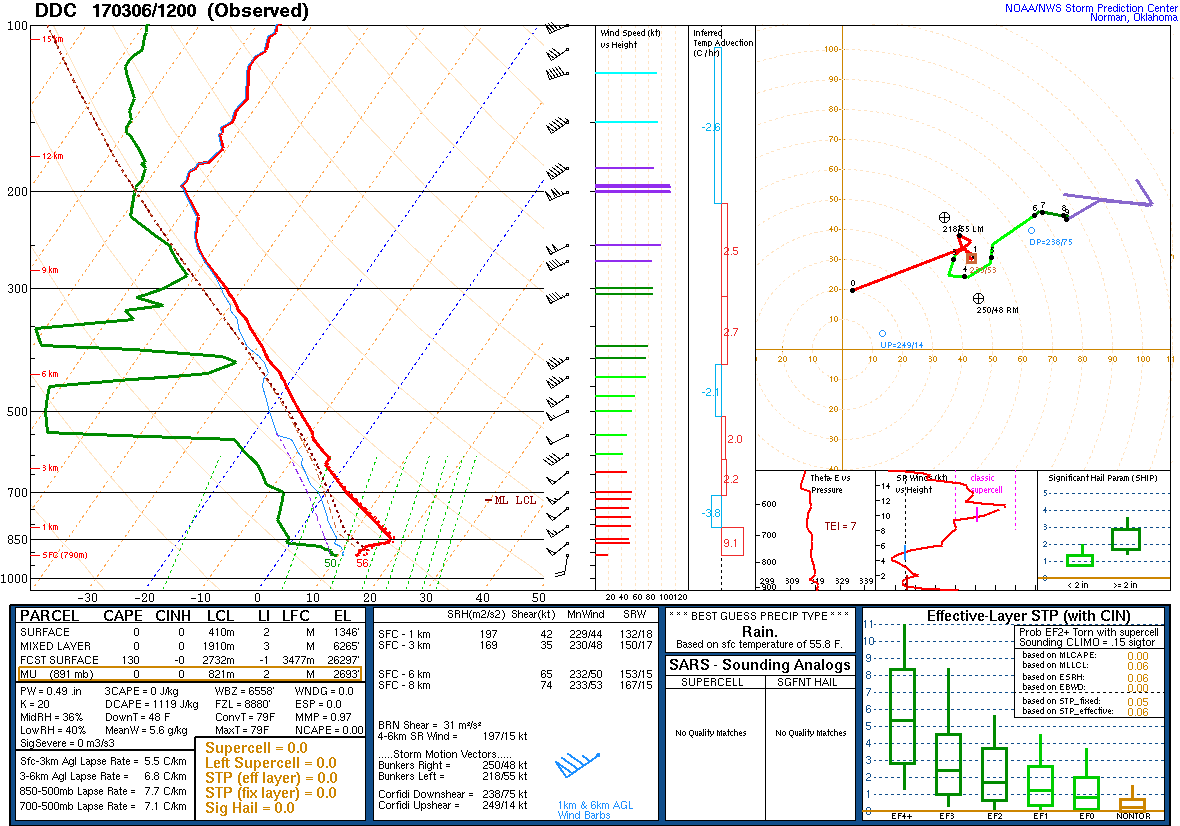
The EML may be tracked in the GOES-16 7.34 micron band once it is positively identified as being associated with an EML with other datasets such as soundings. The brightness temperatures with an EML tend to be relatively warm, however there are a number of reasons why relatively warm brightness temperatures may be observed (i.e., subsidence). Morning soundings from Omaha and Dodge City within regions of warmer brightness temperatures confirm the presence of an EML:
The EML can be tracked eastward if there are no clouds to obscure the layer where the EML exists. Note that this technique does not indicate if a low-level moist layer exists or not, since the weighting function response at low-levels is insufficient (it peaks above the moist layer usually).
In this case, the EML tracked well to the east, including regions where cloud cover exist to obscure the eastern edge of the EML:
Afternoon thunderstorms developed along the surface cold front, within the EML, which provided multiple factors favorable for thunderstorms to be severe. In this case there were many severe reports.
Another feature that may be tracked in the GOES-16 7.34 micron band is the elevated cold front (ECF). The ECF can be identified as a line of relatively warmer brightness temperatures, ahead of the surface cold front as seen in the earlier loop above:
http://rammb.cira.colostate.edu/training/visit/loops/6mar17/loop.gif
This annotated image from 16Z highlights the ECF:
Note the ECF is ahead of the cold front (and dryline – hatched).
Additional confirmation of the ECF can be viewed via model output (RAP in this case), in this case a cross section oriented East-West from Denver to St. Louis:
The contours of theta-e indicate the position of the surface cold front – tight gradient near the surface and sloping to near vertical with height – and the elevated cold front, at the nose of the sloping isentropes east of the surface cold front. A loop of the cross section may be viewed here: 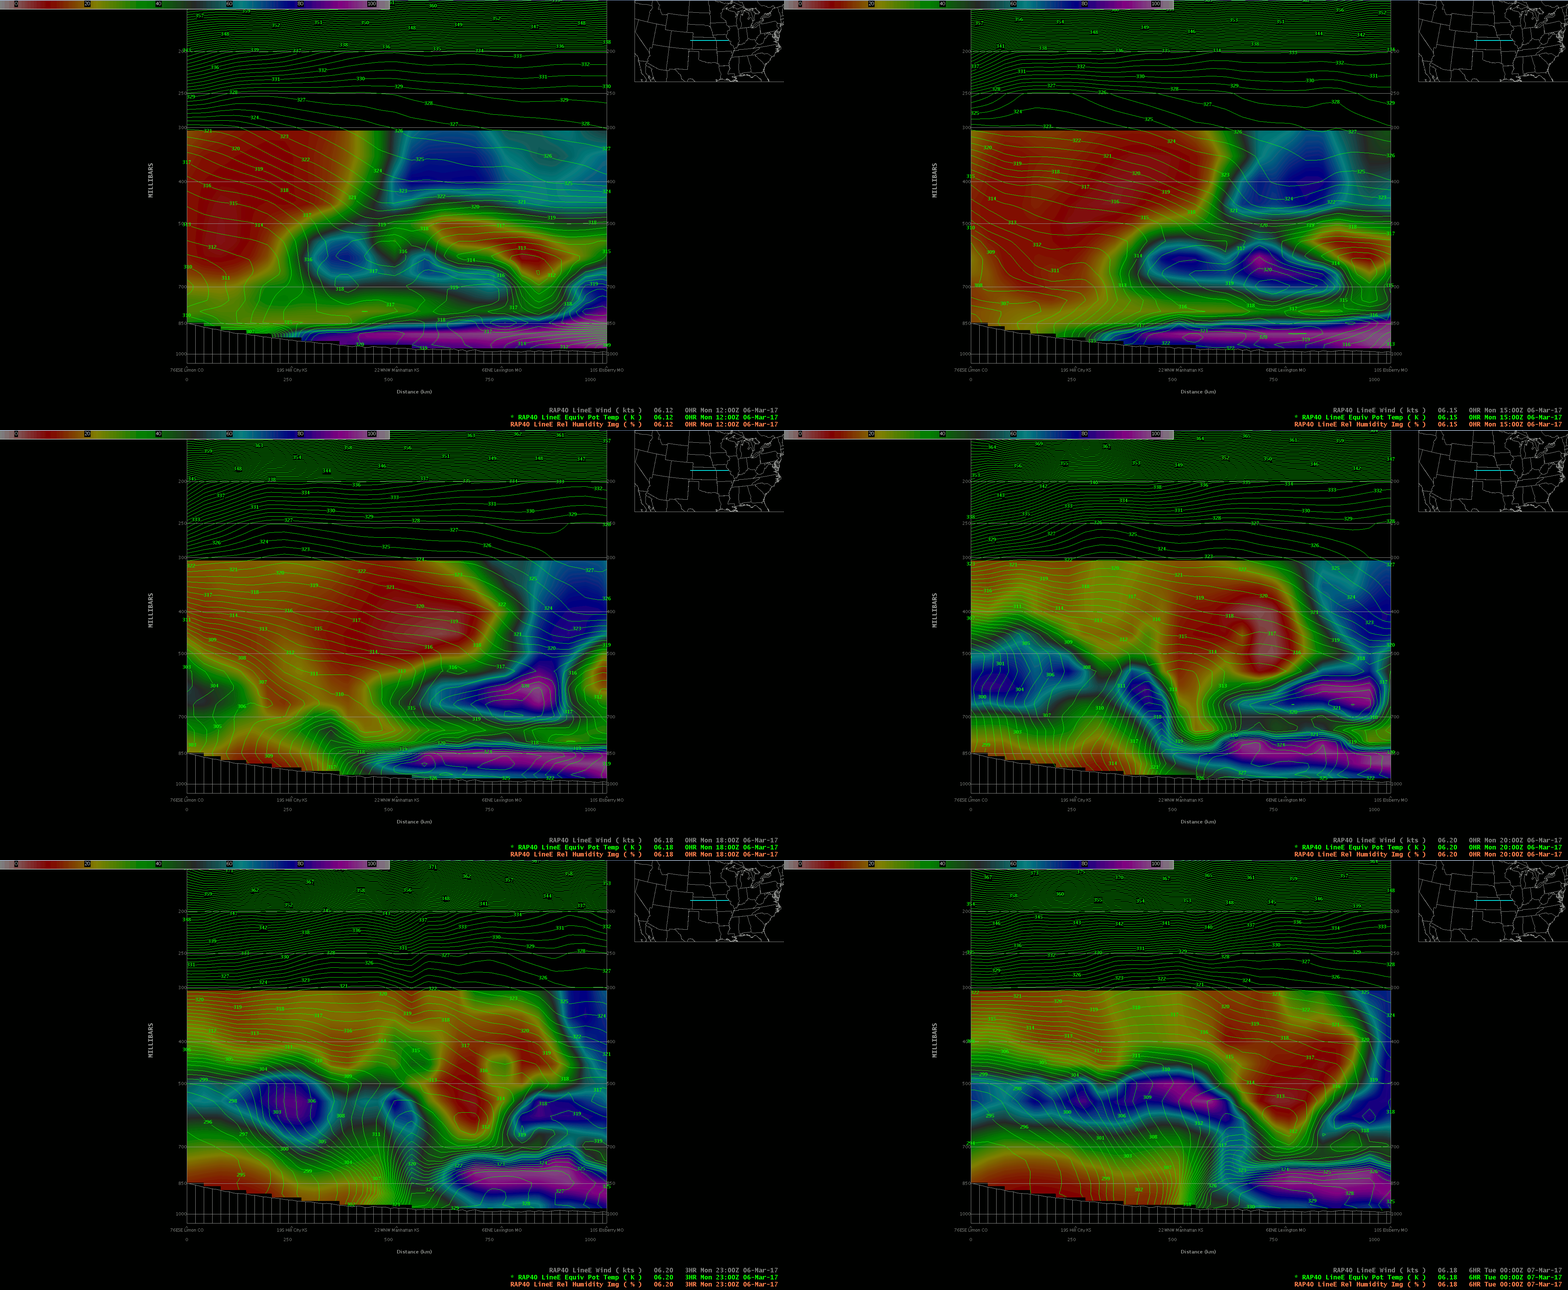
Additional supporting evidence of the ECF may be found in HRRR output of the 700 mb heights, temperature and wind:
The loop shows a bulge of colder temperatures at 700 mb moving into eastern Nebraska / western Iowa that is ahead of the surface cold front. Also, notice the gradient tightens in time. This seems to agree with the line of warmer brightness temperatures we noted above in the 7.34 micron imagery.
A loop of HRRR 700 mb analyses between 15 and 23 Z demonstrates that the model forecast above appears to have captured the ECF:
A RAP model cross section from eastern Colorado to just east of Kansas City of temperature advection, specific humidity and winds:
Depicts cold advection aloft ahead of the surface cold front at 15Z, by 18Z downslope warming / diabatic heating decrease the cold advection signature west of the ECF, however by 21Z we see deep cold advection associated with the surface cold front beginning to catch up with the ECF. Why does the ECF show up as a line of relatively warmer brightness temperatures (at least in the annotated image shown above at 1602 UTC and more subtly later in the afternoon)? The cold advection is accompanied by lower specific humidity (and lower RH as shown above) values, and in this drier air (assuming clear skies) the weighting function profile would “see” lower in the atmosphere, thus warmer brightness temperatures.
What effect does the ECF have on severe thunderstorm development?
Note the thunderstorms that develop ahead of the line of thunderstorms associated with the surface cold front in southwest Iowa:
These storms appear to be in association with the ECF since no distinct surface convergence in that region is apparent in the METARs (lower right panel above) and this is where the ECF would be expected if we closely analyze the loop:
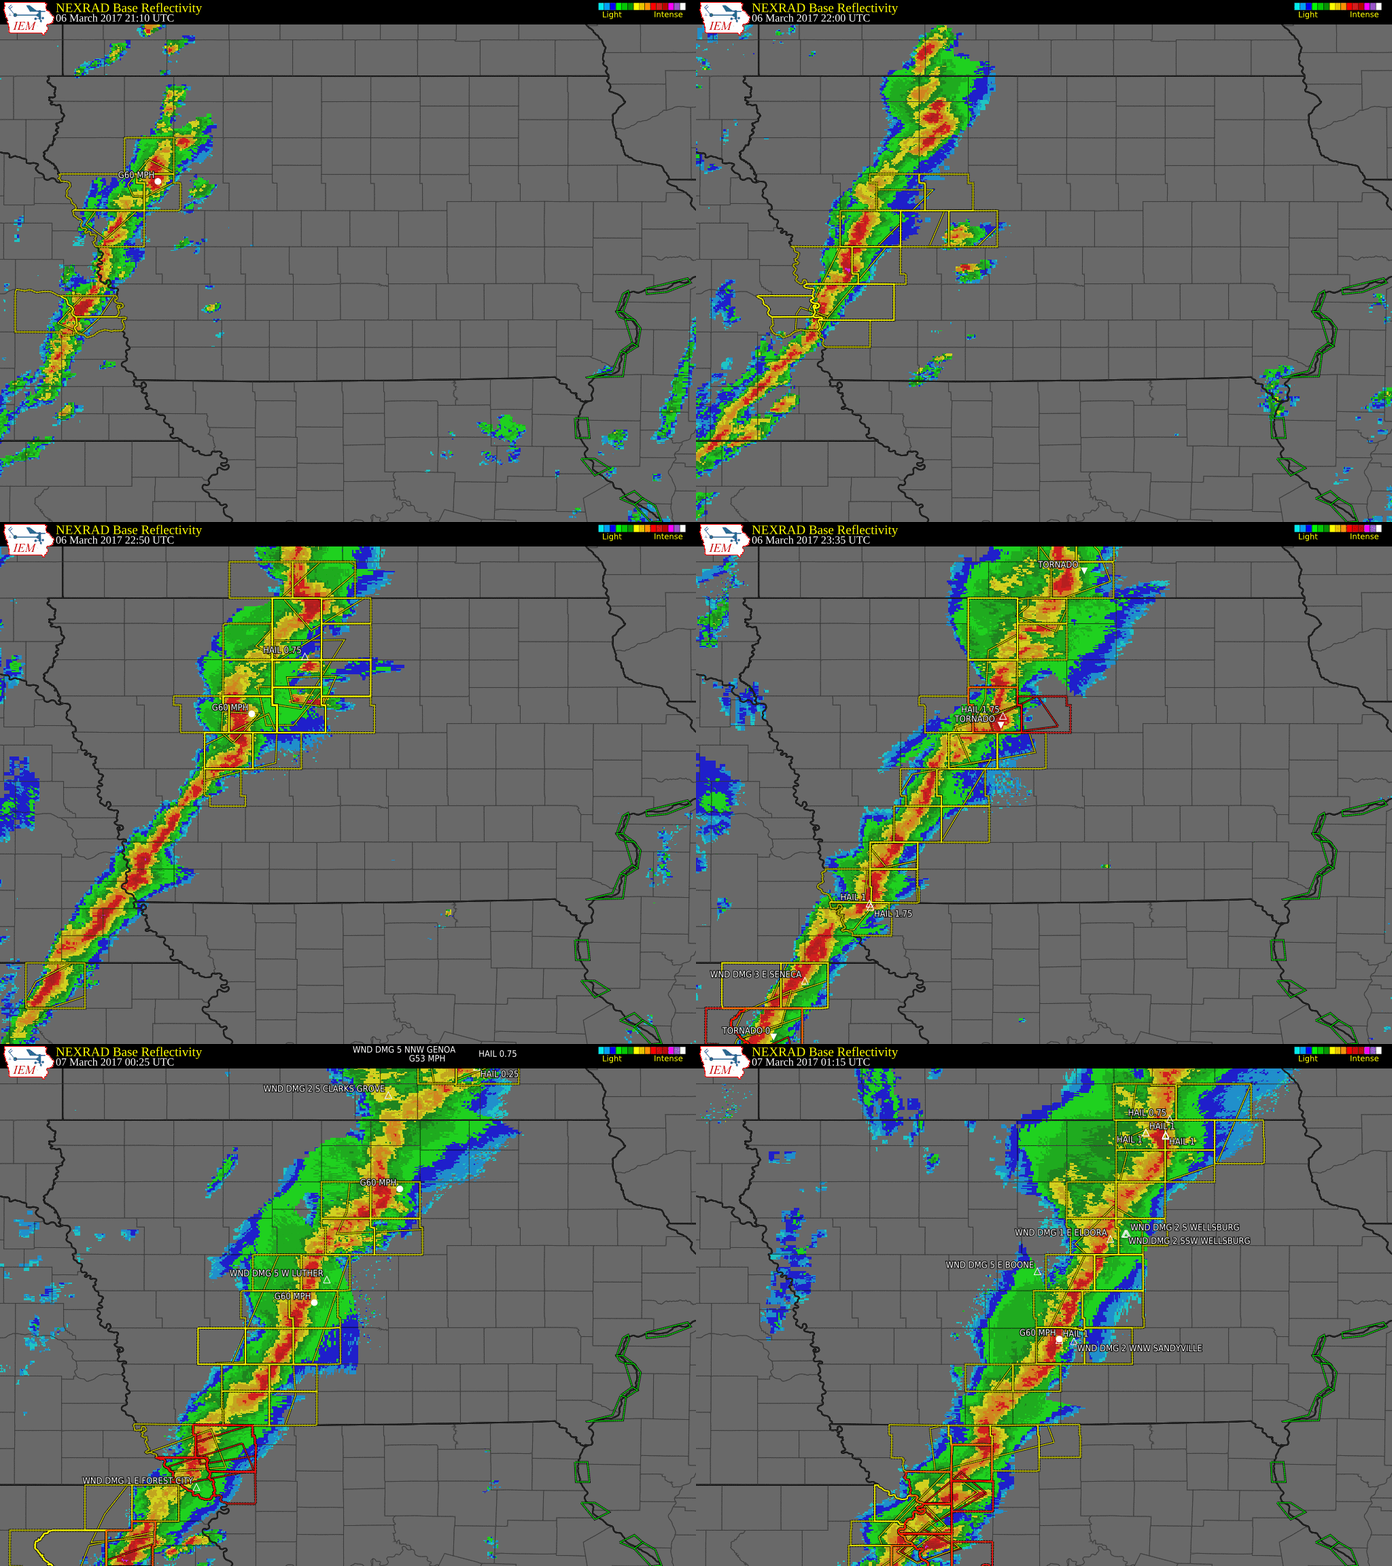
Let’s zoom in on the storms of interest in Iowa by analyzing the radar loop:
Note the storms ahead of the main squall line associated with the surface cold front were difficult to discern in the GOES-16 loop (anvil cirrus from the squall line), however here these storms can be clearly seen and produced multiple severe hail reports. By the end of the loop the surface cold front likely catches up with the ECF as noted by the squall line overtaking the isolated storms ahead of it.
Reference:
Parker, D.J., 1999: Passage of a tracer through frontal zones: A model for the formation of forward-sloping cold fronts. Q.J.R. Meteorol. Soc., 125, 1785-1800.

