1-minute GOES-16 applications for the 8 May 2017 Colorado hail event
The GOES-16 data posted on this page are preliminary, non-operational data and are undergoing testing. Users bear all responsibility for inspecting the data prior to use and for the manner in which the data are utilized.
By Ed Szoke and Dan Bikos
On 8 May 2017 severe thunderstorms hit northeast Colorado with a devastating hail storm across the Denver metro vicinity, causing more than $1.4 billion in damage. This blog entry will look at GOES-16 imagery to show the synoptic setup, followed by the pre-storm environment, and then applications of the 1-minute imagery during the nowcast time period.
The 3 water vapor bands and 0.64 micron visible imagery from GOES-16:
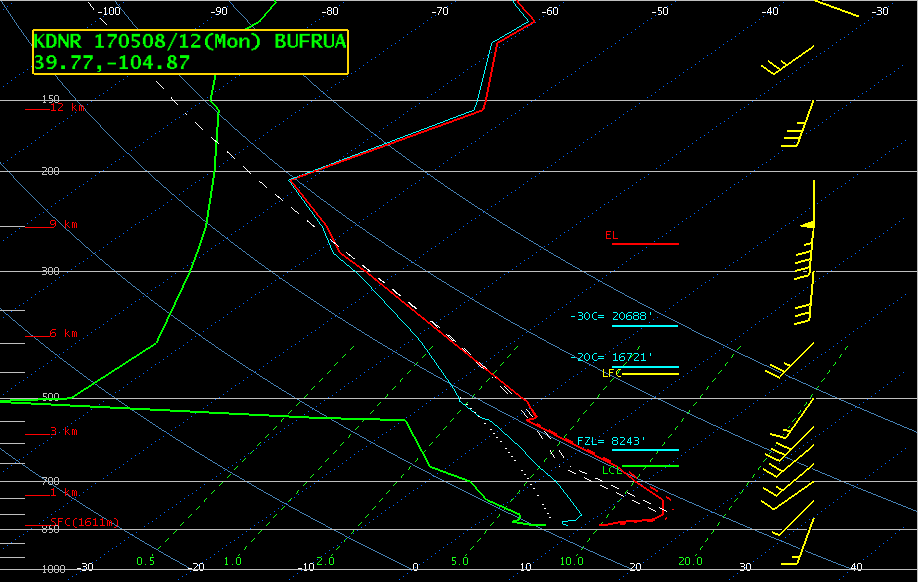
depict a closed low over far northern Baja. The loop shows southerly flow in all 3 WV channels bringing moisture northward across Colorado. We can see this relatively deep moisture in the 12Z Denver sounding:
Note the southerly flow extends to the surface. Mid-level (700-500 mb) lapse rates are quite steep (8.1 degrees C / km). Despite the fairly deep moisture, the dewpoint just above the surface was still fairly low (upper 30s F). But this changed dramatically during the morning as a cold front surged southward across northeastern Colorado as shown in this visible loop with METARs:
The visible imagery shows low-level cumulus developing along portions of the Front Range behind the cold front, meanwhile at the end of the loop a thunderstorm develops at the leading edge of the cold front. By 1800 UTC, the dewpoint at Denver had risen to 46 F with slightly higher values to the north. Although 73 / 46 do not seem like very high values to support the severe hailstorm that would later occur, given the steep lapse rates, this temperature / dewpoint is actually quite unstable at this elevation.
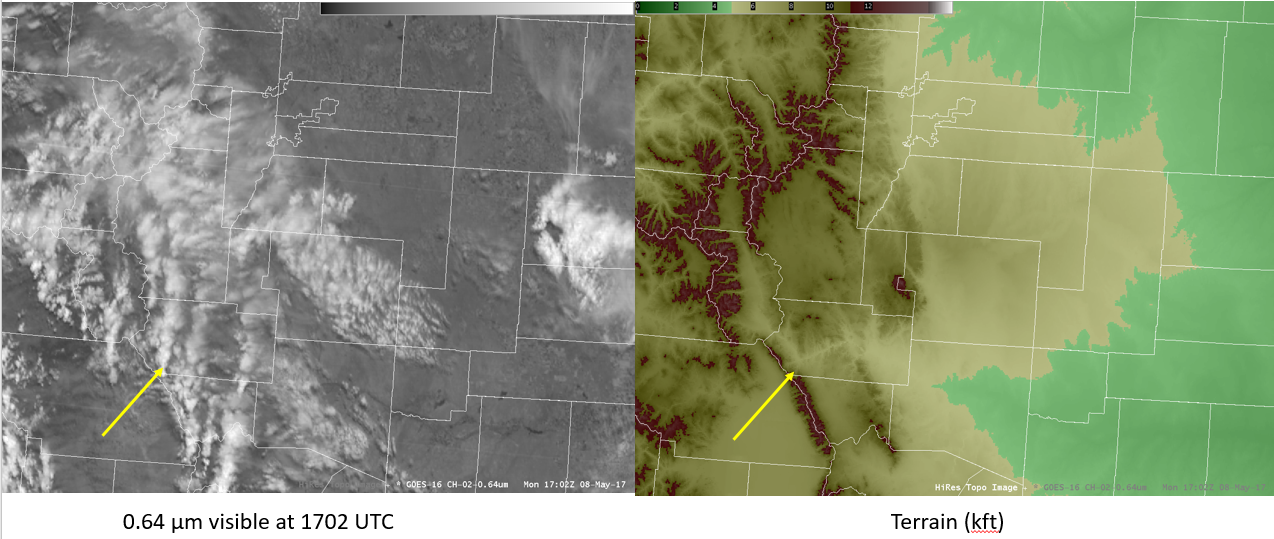
What was the origin of the Denver hailstorm? At the end of the last loop, we noticed a storm forming along the cold front southeast of Denver. In the next loop, we look at several hours of 5 minute visible imagery:
Notice the lines of south-north oriented convection southwest of the Denver area. The origin of these lines appears to be collocated with regions of higher terrain. The moist southerly flow impinging on these terrain features forms these lines of convection. In the loop we can see that the Denver storm appears to develop at the north end of the mountain range indicated by the yellow arrow
The animation also shows the first storm mentioned earlier that forms east of Denver around 1740 UTC and for a while looks fairly strong (although no severe reports were observed with this storm), but it dissipates quickly shortly after 1900 UTC. We speculate that the air mass behind the cold front was still too cool and stable to sustain the storm.
Next, let’s focus on 1-minute visible imagery starting at 1900 UTC going through 2200 UTC:
Early in the loop, extensive cumulus growth takes place over the stalled cold front, leading to convective initiation. These storms remained southeast of Denver but do become severe (hail observed up to 2″ in diameter and funnel cloud). We’ll discuss these storms in more detail later, however now we will focus on the Denver hailstorm.
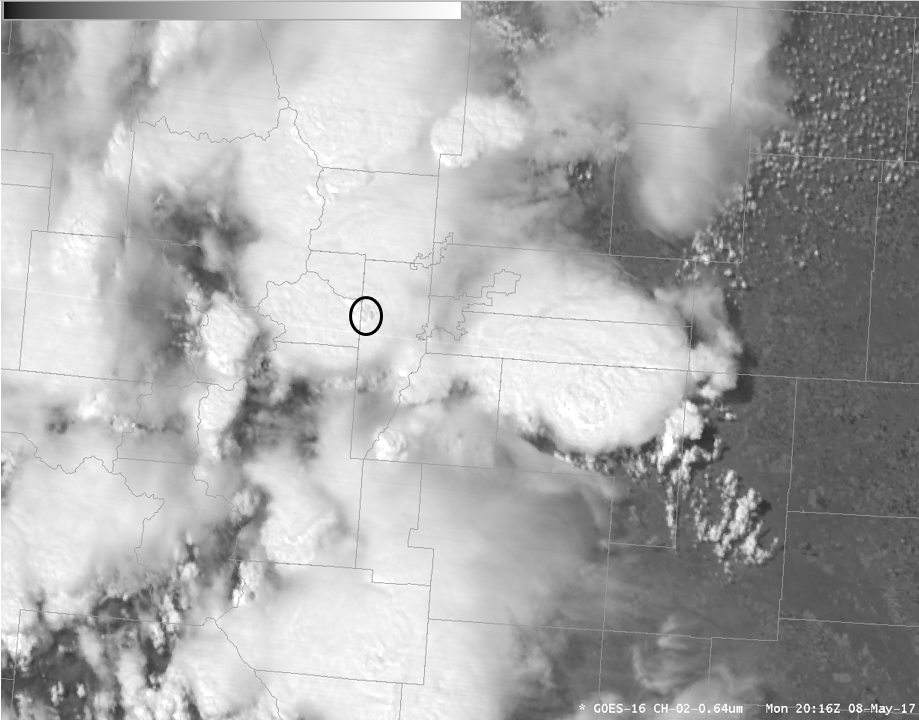
Recall that the Denver storm develops on a cloud line with origins from the northern edge of a mountain range. We can see this nicely in the 1-minute animation. Following this particular storm, we notice that it rapidly develops an overshooting top around 2016 UTC as denoted in this image below:
This overshooting top expands rapidly and soon thereafter (2040 UTC) we get the first severe hail report west of Denver. Shortly after this first hail report we see continued expansion of the overshooting top and what appears like anti-cyclonic rotation at cloud top. This may however just be a strong divergence signature and not necessarily a circulation. Also during this time period, the storm motion changes from heading north-northeast to more east-northeast (turn to the right of the mean flow) coincident with numerous hail reports above 2″ in diameter and up to 2.75″ (baseball) in diameter. Since this is a densely populated area that included numerous automobile dealerships, widespread damage occurred (latest estimates of at least $1.4 billion). After passing through the Denver area, the storm motion reverts back to north-northeast once again, suggesting a downward trend in intensity (indeed, the frequency and size of the hail reports went down).
Early in the loop, at the southern end of our scene a thunderstorm produces anvil cirrus that moves to the north-northeast. As that anvil cirrus approaches the cluster of thunderstorms southeast of Denver that we discussed earlier, they clearly act as an obstacle in the flow to the anvil cirrus coming up from the south (particularly evident as a ring of clear sky between the thunderstorm and approaching cirrus from 2015 – 2100 UTC).
Focusing our attention back on the cluster of thunderstorms southeast of Denver. We observe a series of quasi-stationary waves oriented east-west just north of the overshooting tops, these are particularly evident in the 2030-2130 UTC range. Are these waves induced by the thunderstorms or are they pre-existing?
To help address this question, we consider the 3 water vapor channels along with the 10.35 micron IR animation:
In the water vapor bands, notice the east-west oriented quasi-stationary waves do exist prior to convective initiation. These waves are most evident in the 6.95 micron (mid-level) water vapor band, somewhat evident in the 7.34 micron (lower-level) water vapor band and quite subtle in the 6.2 micron (upper-level) water vapor band. It appears that once the anvil cirrus develops, the waves become visible within the anvil shield. Perhaps these are gravity waves that are forming as the mid/upper level southerly flow is lifted over the stalled cold front.
One final feature to point out is in the 10.35 micron IR imagery in the lower right panel. The overshooting top with the Denver hailstorm is quite vivid in the IR imagery, in particular at 2016 UTC in comparison with the visible imagery discussed earlier. We can also easily follow the deviant storm motion and what appears to be the anti-cyclonic motion at cloud top around the time of the most significant hail reports. The most pronounced enhanced-V signature is found in the storm further north of Denver where severe hail also caused damage.
For more information about the Denver hailstorm of 8 May 2017, see this link:


