Mississippi and Ohio River Flooding
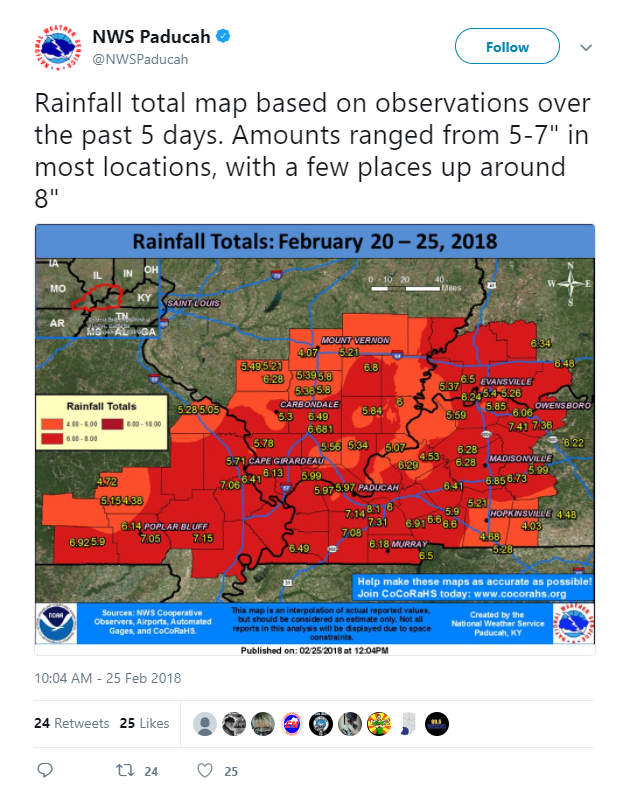
More flooding has occurred over the past weekend, due to a series of storms passing through the Lower Mississippi River Valley and along the Ohio River. Storm totals across the area were in the range of 4-8 inches of liquid precipitation. In the image below, National Weather Service (NWS) – Paducah, Kentucky shows total precipitation values along the Mississippi and Ohio Rivers, and displays the states of Missouri, Illinois, Tennessee, Indiana and Kentucky on 25 February 2018. For a zoomed-in image click on the following NWS-Paducah social media link.

In complement to these totals, one can also see the magnitude of the flooding via the VIIRS Flood Detection Map product, that can be seen via the RealEarth website. There are 2 subsequent images below. The first image shows a google map, in this case, covering where the Lower Mississippi River Valley and the Ohio River intersect, along with the neighboring states.

The second image shows the VIIRS Flood Detection Map product over the same domain. The product highlights the areas of inundation (yellow, orange and red colors) in relation to the open water (blue) and land (brown). In the southeast portion of the image (bottom-right corner) one can see ‘grey colors’ that are an indication of cloud cover in the area. The images were taken at 1932 UTC, 26 February 2018 and are at a spatial resolution of 375 meters. Notice, the inundation areas are along the rivers, but there are significant amounts of flooding just west of the Mississippi River, and north and south of the Ohio River. What makes matters worse, is more rain is expected within the next 3-5 days, most likely exacerbating the situation.

