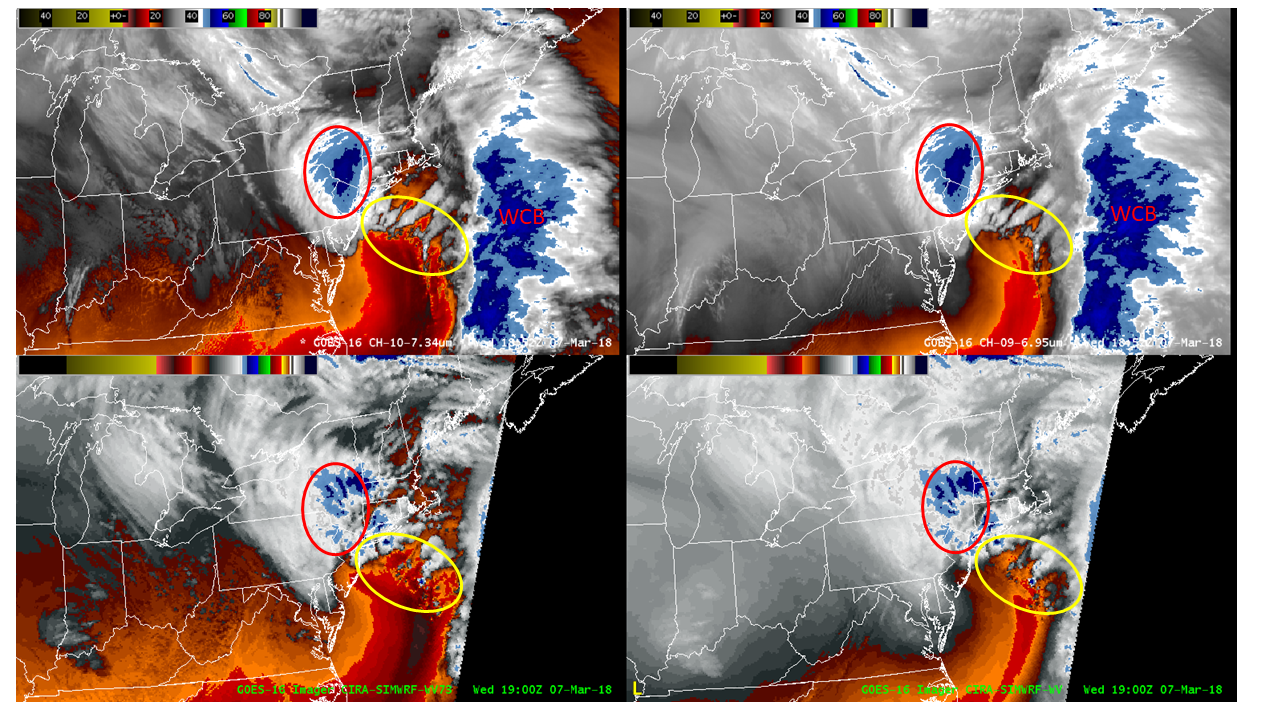
Synthetic imagery from the NSSL WRF-ARW for 7 March 2018 event
A nor’easter occurred on 7 March 2018 which resulted in heavy snow, strong winds and rain across portions of the Northeast U.S. In this blog entry we’ll examine the performance of the NSSL WRF-ARW via synthetic water vapor imagery in relation to the cyclogenesis aspects.
The following 4 panel display:
shows the following:
Upper left: GOES-16 7.34 micron imagery (5 minutes)
Lower left: NSSL WRF-ARW synthetic 7.34 micron imagery from the 00Z 7 March run (hourly)
Upper right: GOES-16 6.95 micron imagery (5 minutes)
Lower right: NSSL WRF-ARW synthetic 6.95 micron imagery from the 00Z 7 March run (hourly)
Early in the loop we observe colder cloud tops offshore, adjacent to a dry slot just west of that region, followed by colder cloud tops associated with proximity to the upper low. Soon thereafter, we see the rapid development of clouds in proximity to the upper low (the red oval on the image below):

The warm conveyor belt is denoted by the red “WCB” at this time. Up to this point, this may be considered a cold air type of cyclogenesis event. However what happens afterwards in the yellow oval above would transition this to an (more intense) instant occlusions type of cyclogenesis. In the yellow oval, watch the development of convection. This signifies the development of a secondary warm conveyor belt which peels cyclonically from the warm conveyor belt back towards the position of the upper low. Once occlusion begins, this is generally referred to as the TROWAL airstream. The significance of this is that the TROWAL advects air from the warm sector, back towards the low, allowing more baroclinic energy for the cyclone to act upon. This generally results in rapid pressure falls, and associated hazardous weather (heavy precipitation, strong winds etc.). A conceptual diagram with these features can be viewed on slide 3 of this training module: http://rammb.cira.colostate.edu/training/visit/training_sessions/goes_r_cyclogenesis_life_cycle/video/
The NSSL WRF-ARW output, as viewed via the synthetic imagery generally did a good job capturing the development of the various components of cyclogenesis discussed above, albeit the position was slightly off. The synthetic imagery provides an efficient visual comparison between model output and observations (GOES), allowing for a rapid assessment of how the model is performing. This assessment in model forecast confidence allows the forecaster to have more or less confidence in future forecast hours. The region of rapidly cooling cloud tops denoted by the red oval shows a more uniform extent of colder cloud tops compared to the NSSL WRF-ARW synthetic imagery. This is primarily due to a known weakness in the WSM6 microphysics scheme used in the NSSL WRF-ARW. Due to this known weakness, it’s the location and timing of the colder cloud tops that matters, not so much the areal extent of colder cloud tops.
The GOES-16 1-minute visible imagery provided a spectacular view of the development of the convection associated with the TROWAL:
An alternate view of the same scene is the Day Cloud Phase Distinction RGB, which provides different colors to various growth stages of the convection:
