Hail damage swaths from severe storms over the High Plains as viewed from satellites during July 2018
By Louie Grasso, Dan Bikos, Jorel Torres and Ed Szoke
During the summer of 2018 over the High Plains, several significant severe storms occurred. Several hailstorms moved southward over the Central High Plains and produced noticeable hail swaths and damage scars on the ground that were captured by GOES-16 ABI. The purpose of this blog is to compare and contrast GOES-16 imagery before and after each event. In addition, SNPP and NOAA-20 imagery will be shown that also contains damage scars. Supplemental observations of the tracks of the severe storms is provided the MRMS Mid-level rotation tracks along with SPC storm reports.
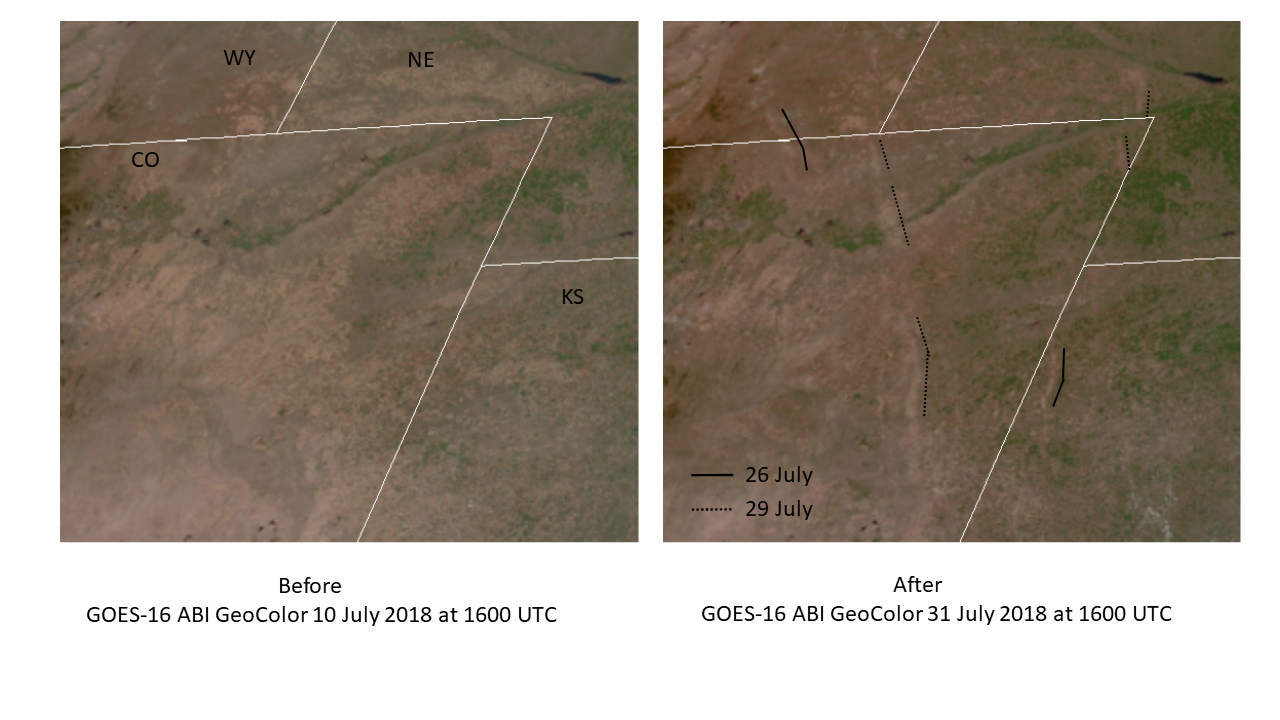
To begin with, a brief discussion of imagery before and after the hail swaths and damage scars is given below. Before the events (left side image in the figure below) this is how the GOES-16 ABI imagery appeared on 10 July 2018. For those not familiar with the region displayed in the imagery, the dominant brownish color is typical due to the semi-arid climate of the western High Plains. During the three weeks following 10 July a persistent northwesterly flow pattern existed that supported multiple severe weather episodes. As a result, several surface features, indicated by black line segments are evident at the end of the period (right side image in the figure below).
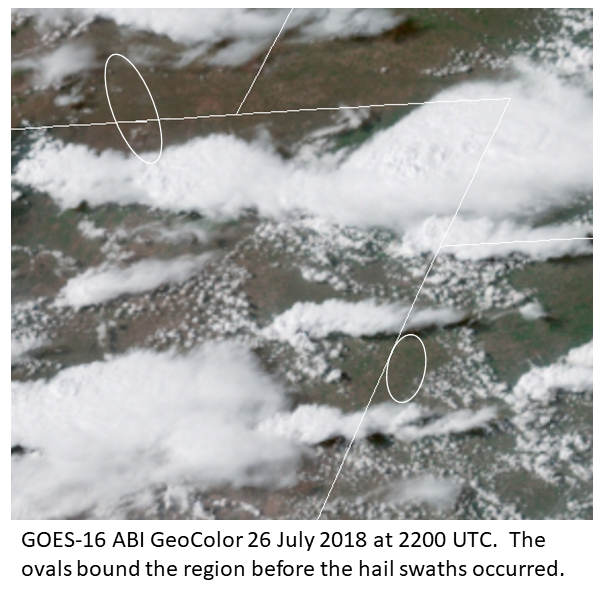
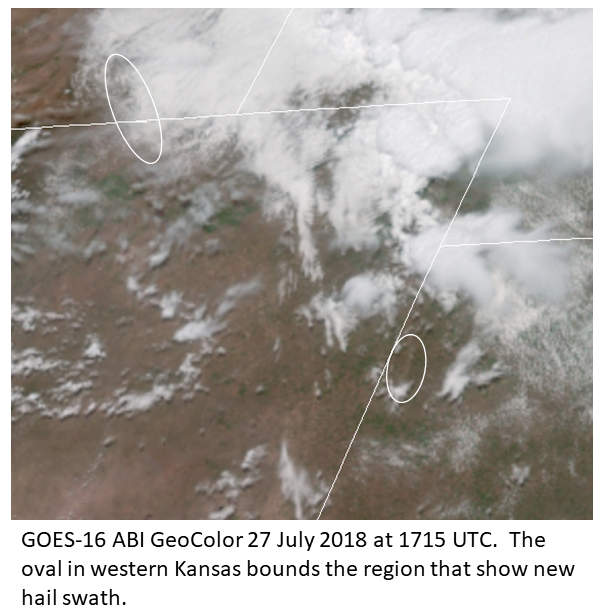
Our first case study occurred on 26 July 2018. Thunderstorms began developing during the afternoon of the 26th, a few of which are seen in the figure below. Of particular interest are the two white ovals, one located along the Colorado/Wyoming border, the second located in western Kansas. At that time no hail swaths were evident in either oval. A comparison of the figures above and below can be used to orient the reader about the 2 regions just discussed.
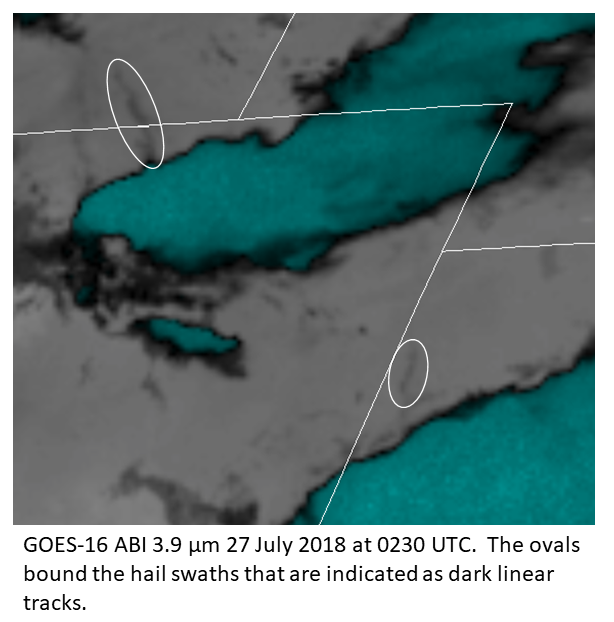
At 0230 UTC 27 July two hail producing storms were evident in imagery in the GOES-16 ABI 3.9 micron band and is displayed below. Within the white ovals, darker line segments were evident in the wake of the storm paths as they moved towards the southeast. In the color table used below, the dark line segments correspond to cooler brightness temperatures compared to the light gray region around each swath. The colder and dark line segments represent hail swaths due to the hail be colder than surrounding ground.
On the next day, imagery near noon is used to indicate the hail scar due to the previous day’s storms. Unluckily the swath along the Colorado/Wyoming was obscured by persistent clouds. On the other hand the swath in western Kansas is evident within the oval: compare the figure below with the previous two figures.
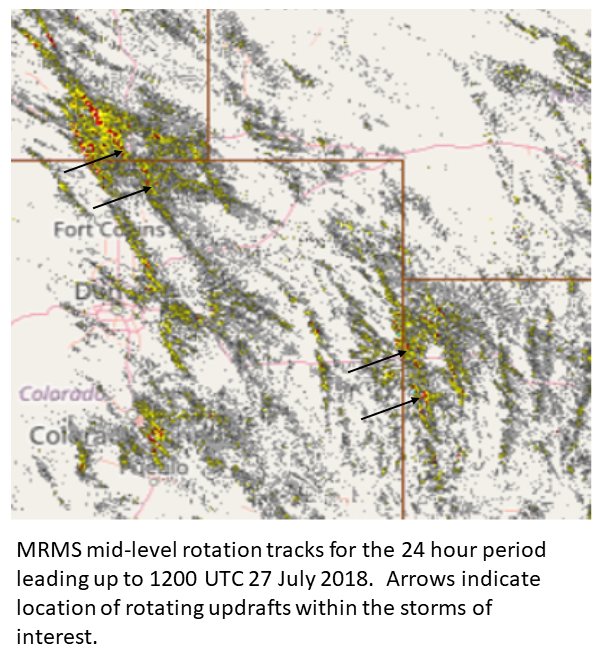
An independent observing system that captured the storms is the MRMS mid-level rotation tracks. As is seen in the figure below, the pairs of black arrows correspond to the location of rotating storms. A comparison of the figure below with the previous three figures above provide additional evidence of convective activity where the hail swaths occurred.
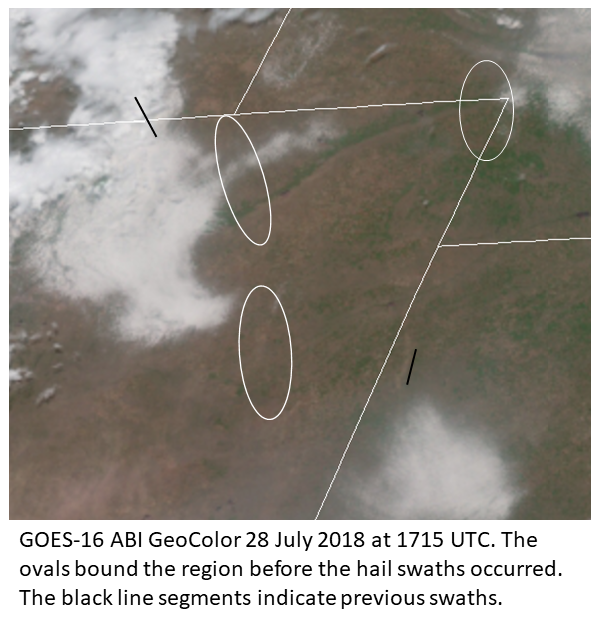
Our second case study occurred on 28 July 2018. Unlike the first case above, no thunderstorms have developed in the image below since it is late morning. Of particular interest are the three white ovals, one located just south of the Colorado/Wyoming border, the second located in extreme northeast Colorado, while the third is located over east central Colorado. At that time no hail swaths were evident in either oval. A comparison of the first figure (see beginning of blog) and the figure below can be used to orient the reader about the 3 regions just discussed.
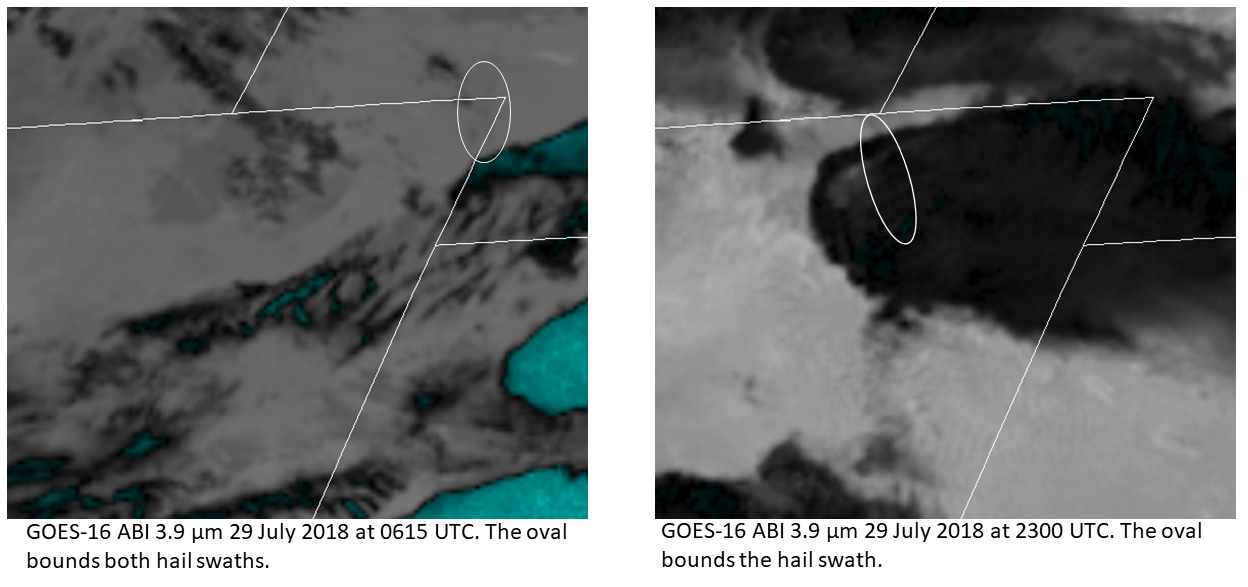
At 0615 UTC 29 July the hail producing storm was evident over extreme northeast Colorado as seen in the GOES-16 ABI 3.9 micron band imagery as displayed below on the left. Within the white oval in extreme northeast Colorado, two darker line segments were evident in the wake of the storm path as it moved towards the southeast over extreme southwest Nebraska. Later on that day, severe storms developed and also produced a hail swath; the northern portion of the hail swath is seen in the northern portion of the white oval near the Colorado/Wyoming border. The thunderstorm producing the hail swath covers the rest of the oval as is seen in the figure below on the right.
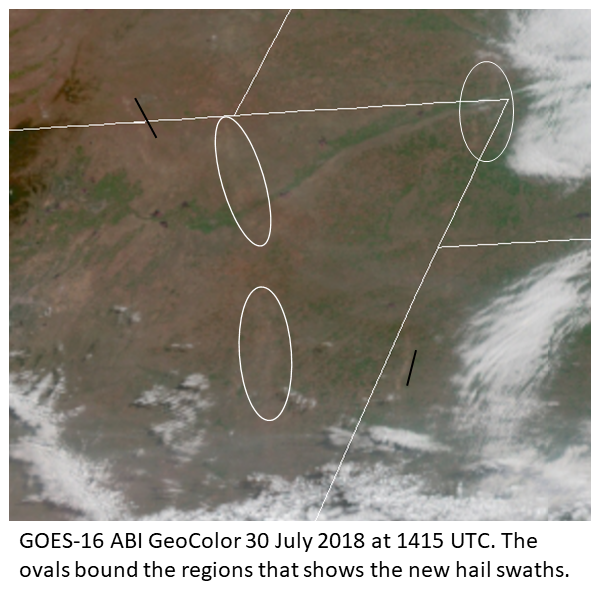
On 30 July 2018 at 1415 UTC imagery in the early morning is used to indicate the hail scars due to the previous two convective events (see figure below). The hail damage scars from the first case are denoted by two black line segments. Within each oval, hail damage scars are evident. A comparison of the figure below with the first figure of the blog can be used to help the reader identify hail damage scars.
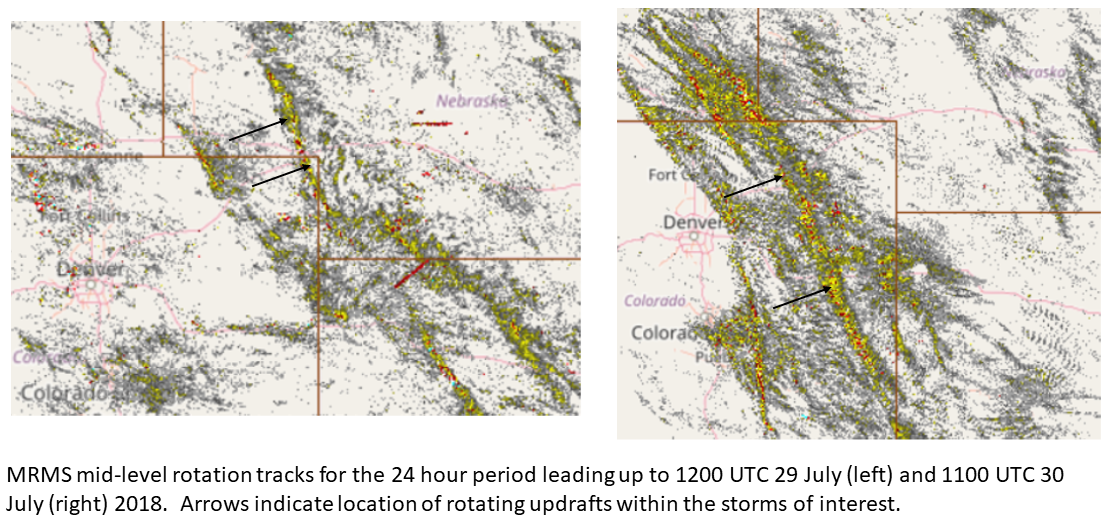
As in the other case, the MRMS mid-level rotation tracks are used an additional source of information. As is seen in the figures below, the pairs of black arrows correspond to the location of rotating storms. A comparison of the figures below with the previous figures for this case provide additional evidence of convective activity where the hail swaths occurred.
All of the hail damage scars were also imaged by SNPP-VIIRS as seen in the image below on 31 July 2018 at 1917 UTC. Black arrows point to scarring locations while the white arrow points to Cheyenne, WY.

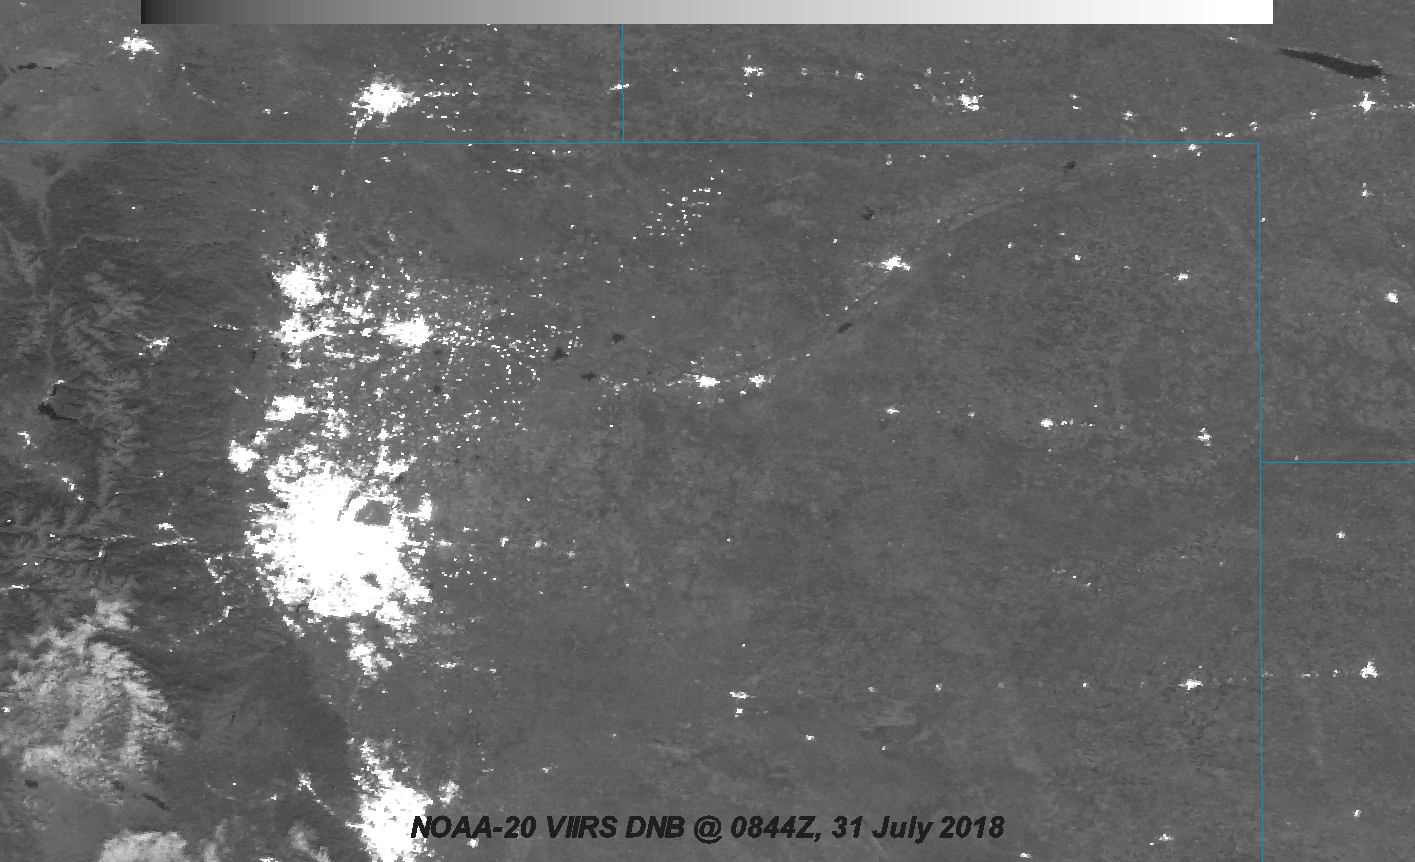
We leave it to the interested reader to identify hail damage swaths in the NOAA-VIIRS Day Night Band image displayed below. Also of interest a number of cities appear in the imagery.
