21 November 2018 Snow Squall event in upstate New York
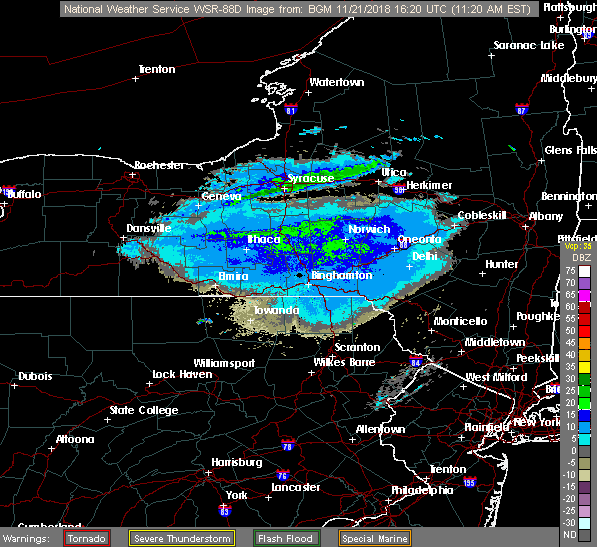
On 21 November 2018 a cold front moved through upstate New York with an associated band of heavier snow, as seen in this WSR-88D reflectivity image:

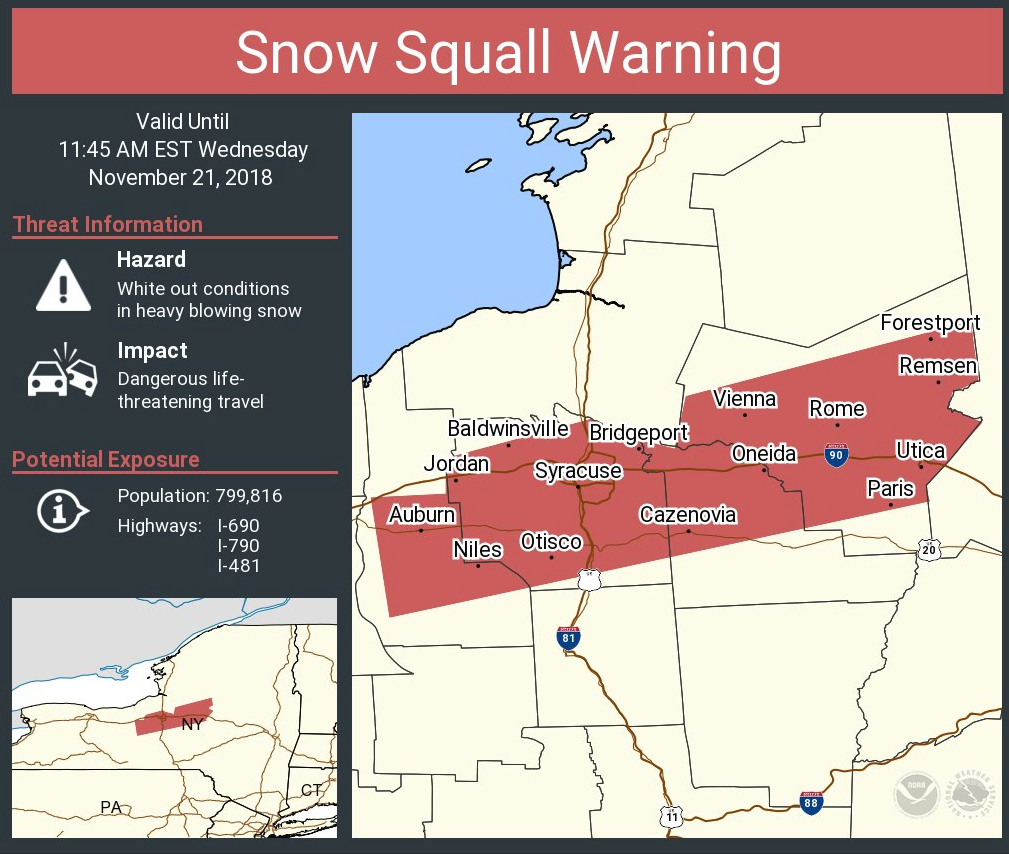
Note the narrow region of higher reflectivities extending from near Syracuse northeastward. This snowband prompted a snow squall warning issued by the NWS office in Binghamton:

How about the perspective from GOES-16? Here is a 4 panel display of visible (0.64 micron band) in the upper left, the day cloud phase distinction RGB (upper right), IR (10.3 micron band) with the default color curve (IR_Color_Clouds_Winter) in the lower left, and IR (10.3 micron band) with the GOES Snow Squall color curve in the lower right:
The imagery on the top 2 panels relies on information from the visible band, therefore it’s only valid during daylight hours. The familiar visible imagery in the upper left shows the snowband as more textured clouds along a narrow line, which is along the cold front as seen in the METARs. The day cloud phase distinction RGB shows the snowband as green with surrounding clouds as light blue or cyan. The surrounding clouds are clouds composed of liquid water, which show up as light blue or cyan in this RGB product. The snowband is associated with more vertically developed clouds, therefore have glaciated tops associated with them. Once glaciation occurs, the blue component of this RGB product (the 1.6 micron band) goes from a high contribution to a low contribution since ice clouds absorb radiation considerably more than liquid water clouds at this wavelength. Lower contribution of blue means that the green contribution (0.64 micron) shows up quite well (since clouds reflect during the daytime). How about the IR band shown in the bottom panels? There is insufficient contrast to identify the snowband with the IR imagery in the default color curve in the lower left panel. The lower right panel has a color curve designed for more contrast at temperature thresholds typically observed with snow squalls, however it’s still not as easy to identify compared with observing the glaciated cloud tops (in green) in the day cloud phase distinction RGB. If this was a nighttime case, the day cloud phase distinction product would be unavailable, leaving you with options such as changing the range on the IR imagery or perhaps making manual adjustments to the color curve in the AWIPS color curve GUI.
