Nebraska flooding
The past two weeks Nebraska has been inundated with heavy precipitation, in the forms of rain and snow. Nebraska was significantly affected by the ‘record-breaking’ mid-latitude cyclone that past through the area from 13-15 March 2019. Refer to the GOES-16 10.3um infrared satellite imagery below, seen from 5Z, 13 March 2019 to 22Z, 14 March 2019. Throughout the animation, notice the large areal extent of the cyclone and the cold convective cloud tops (i.e. cold brightness temperatures) indicating varying levels of precipitation in Eastern Nebraska.
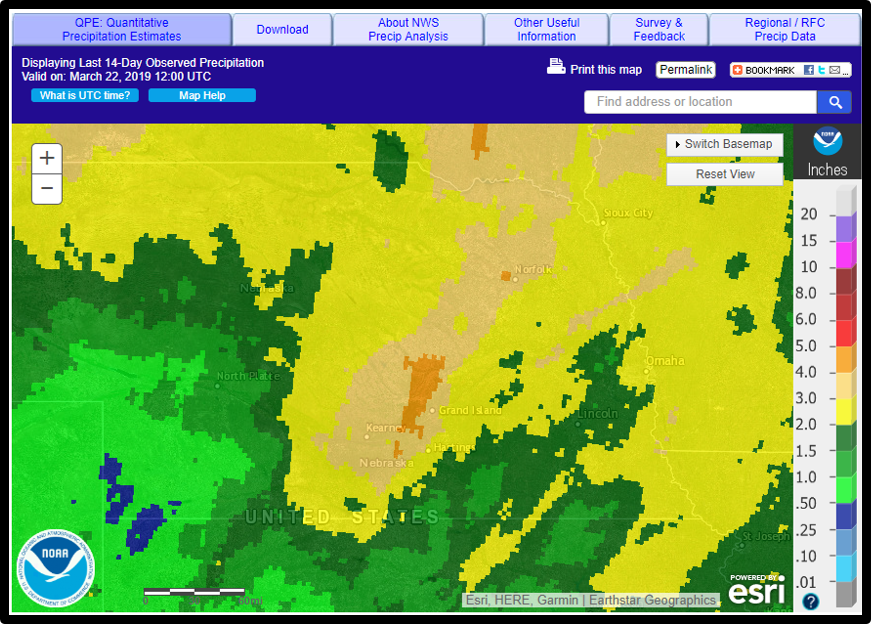
From this storm, plus subsequent storms thereafter, extreme flooding has transpired throughout eastern Nebraska. The image below displays the observed precipitation values over Nebraska the last 14 days, valid at 12Z, 22 March 2019. Product is provided from the National Weather Service (NWS) – Advanced Hydrologic Prediction Services (AHPS). Precipitation values ranged from 1-5 inches throughout Nebraska.

Coinciding with the precipitation values is polar-orbiting satellite data that observes the magnitude of flooding via Suomi-National Polar-orbiting Partnership (S-NPP) Visible Infrared Imaging Radiometer Suite (VIIRS) Flood Areal Extent product. The product (seen in animation below) shows the areas of flooding (i.e. yellow, orange, red colors) in Eastern Nebraska and Iowa between 15-21 March 2019. 17 and 19 March were omitted due to cloud obscuration observed over the area. VIIRS Flood Areal Extent calculates the floodwater fraction percentage of a pixel (i.e. from 0-100%, green-to-red colors), and discriminates between different scene types. Note in the legend: LD = land (brown), SI = supra/snow ice (mixed water and ice, or water over ice, seen in purple), IC = ice (river or lake ice, seen in aqua), CL = clouds (grey), CS = cloud shadows (dark grey), and WA = open water (blue). Spatial resolution of the product is at 375-m resolution. Within the animation, see the evolution of the floodwaters as they increase in width or move along the rivers.
