17 April 2019 thunderstorm event over northern Mexico as observed by GOES-16
By Louie Grasso and Dan Bikos
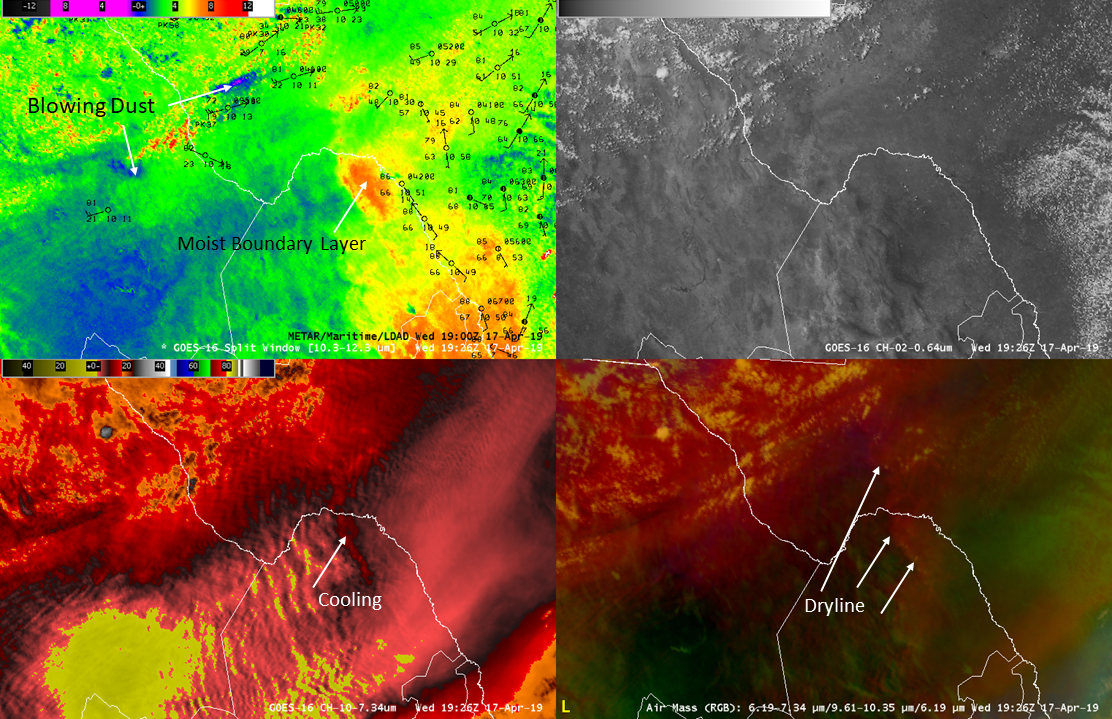
On the day of 17 April 2019 observations indicated a significant upper-level trough over the southwest portions of the US. As is typical with this type of synoptic setup, southwesterly flow ahead of the trough existed over northern Mexico extending northeastward into Texas. In addition, this synoptic setup is associated with the development of a dryline in Texas and northern Mexico. In the following animation:
Upper left: GOES-16 Split Window Difference (SWD; 10.3 – 12.3 micron) with METARs
Upper right: GOES-16 Visible (0.64 micron)
Lower left: GOES-16 Low-level water vapor band (7.3 micron)
Lower right: GOES-16 Air Mass RGB product
the METARs indicate advection of warm moist air from the Gulf of Mexico with dewpoints in the upper 60s along with drier southwesterly flow with dewpoints in the low 20s over southwest Texas and northern Mexico. Several features are evident in the SWD product that are absent from the visible imagery. For example, a moist boundary layer is displayed by deep orange/red colors ; there are two regions of blowing dust displayed as blue/purple, as shown below:
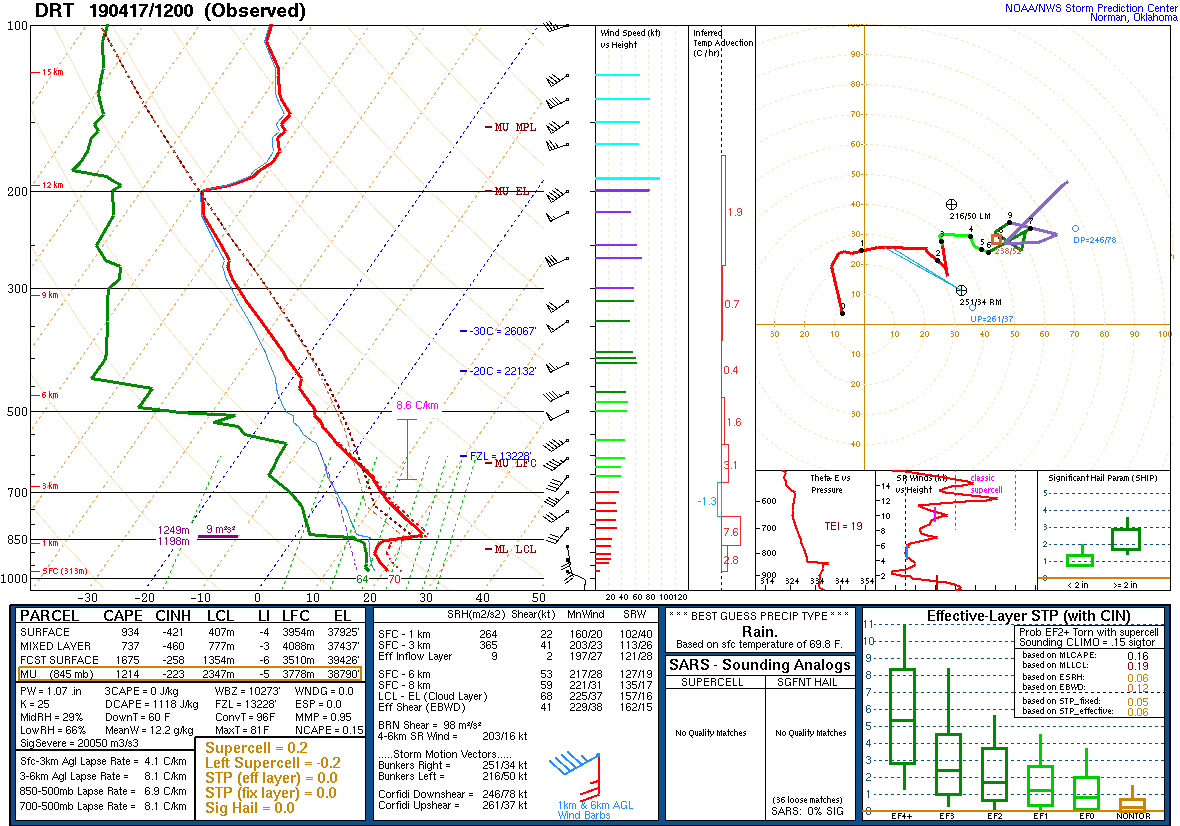
In advance of the synoptic scale trough, warm dry air is seen in the GOES-16 7.3 micron band imagery advecting northward from Mexico (yellow color) into central Texas and is associated with an Elevated Mixed Layer (EML) as confirmed by the morning Del Rio, TX sounding:
The air mass RGB product also shows the dryline quite clearly, in support of the SWD product. The above animation ends in early afternoon prior to convective initiation.
A few sequence of events are evident in the above animation that are associated with changes in the pre-storm environment that may lead to convective initiation. First, in the 7.3 micron imagery a region of cooling occurred coincident with the moist boundary layer in the SWD product (see annotated figure above). In particular, the western edge of the cooling is stationary at 7.3 micron while the eastern edge was advected northeastward with the mean flow.
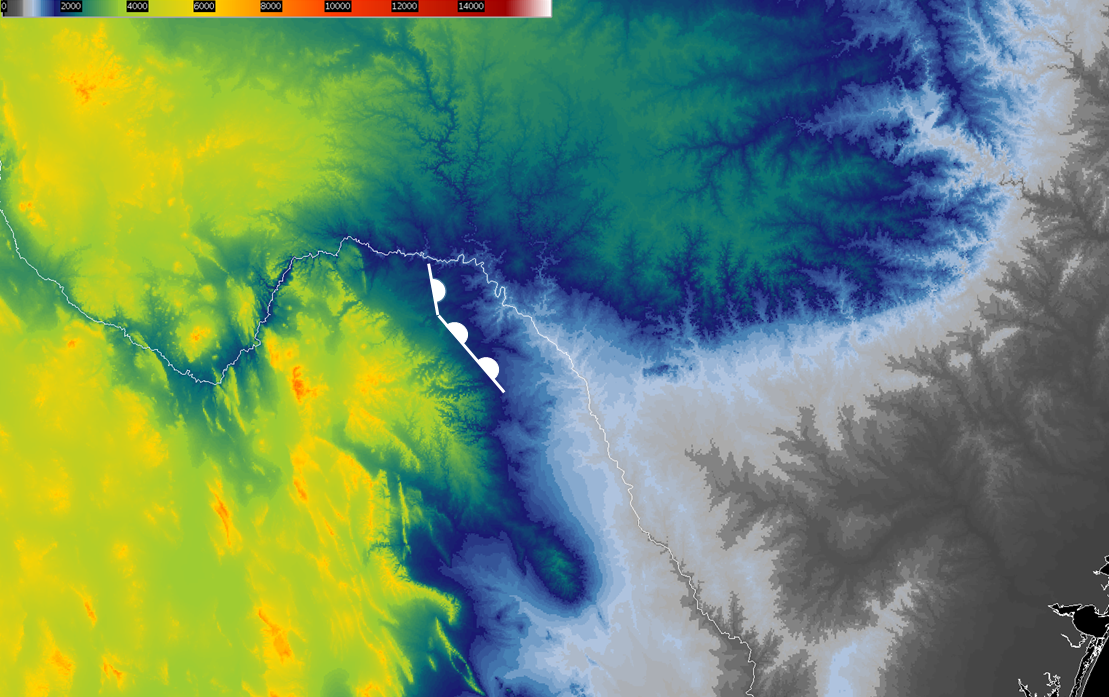
In the above image, which shows topography, the western edge of the moist layer is annotated with the conventional dryline symbol. Although the dryline extends well into central Texas, the portion annotated in the figure is bounded by the approximate 2000 foot increase in elevation to the west.
As indicated in the 7.3 micron imagery in the above loop, cooling was coincident with the dryline segment. An open question becomes, is the cooling observed in other GOES-16 water vapor bands?
The following animation:
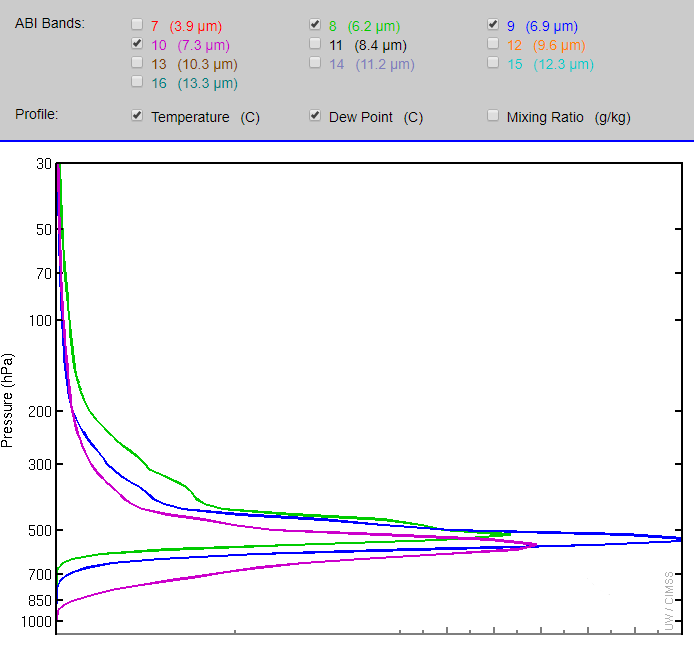
Shows the 3 GOES-16 water vapor bands in addition the to the IR band at 10.3 microns. Note that the region of cooling observed in the 7.3 micron band also became evident at 6.9 microns, however at 6.2 microns we do not see this cooling signature. An explanation is hypothesized that makes use of weighting functions, as shown below from the 12Z Del Rio, TX sounding:
Figure courtesy UW/CIMSS
In the weighting function profile, notice that overall the weighting function profile for the 7.3 micron band (magenta) existed at lower altitudes compared to the other 2 water vapor bands. Likewise, the weighting function profile for the 6.2 micron band (green) is in general above the other 2 water vapor bands. The interpretation is that the energy detected by GOES-16 ABI originated in the area between the curve and the vertical axis of each respective weighting function profile. A word of caution, energy detected by the satellite is not coming from just the peak. As a result of the relative position of each weighting function, brightness temperatures at 7.3 microns are generally warmer than at 6.9 microns which are themselves warmer than 6.2 microns. The cooling at 7.3 microns is likely caused by ascending motion at the western edge of the moist boundary layer due to backing surface winds forcing the moist boundary layer up the eastern slope of the ridge line depicted in the topographic map. This can be characterized by convective pre-conditioning of the environment for potential convective initiation.
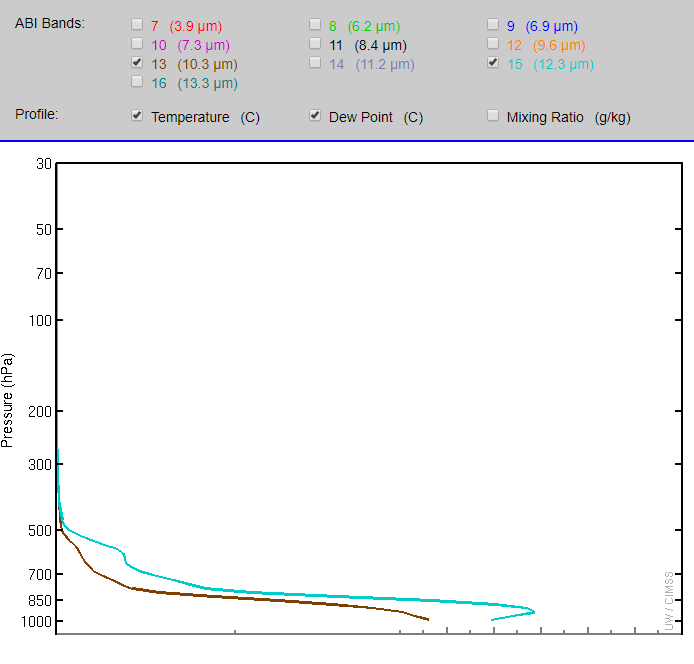
As mentioned above, the moist boundary layer is evident in the SWD product. One explanation utilizes the weighting function profiles as shown below from the 12Z Del Rio, TX sounding for the 10.3 and 12.3 micron bands:
Figure courtesy UW/CIMSS
As seen in the figure, the entire weighting function profile for 10.3 microns is contained within the weighting function profile for 12.3 microns. As a result, absorption and re-emission of energy occurs at cooler temperatures at 12.3 microns compared to 10.3 microns. Consequently, the values of the SWD brightness temperatures is positive.
During the pre-conditioning stage, a few events can be identified. In the following loop:
At approximately 2146 UTC blowing dust, suggestive of downward mixing of high momentum air, headed eastward towards the moist layer (top left panel). The development of cumulus, cumulus congestus, and towering cumulus occurred on the western edge of the moist layer (top right panel). Further, there is evidence of orphan anvils around 2146 UTC. Also notice in the 7.3 micron imagery the progression of the cooling over a larger area above the moist layer (lower left panel). In addition, the westward migration of the moist layer in response to backing winds as evidence in the top left and bottom right panels. Lastly, evidence of the cold front is seen in the METARs on the upper left panel due to veering surface winds and decreasing temperatures. Also, the leading edge of cooler air is indicated by a subtle blue region expanding southward towards the moist layer in southwest Texas. The expanding cold front is also slightly less subtle in the lower right panel. These processes continued over the next few hours until convective initiation occurred slightly prior to 0000 UTC 18 April 2019.
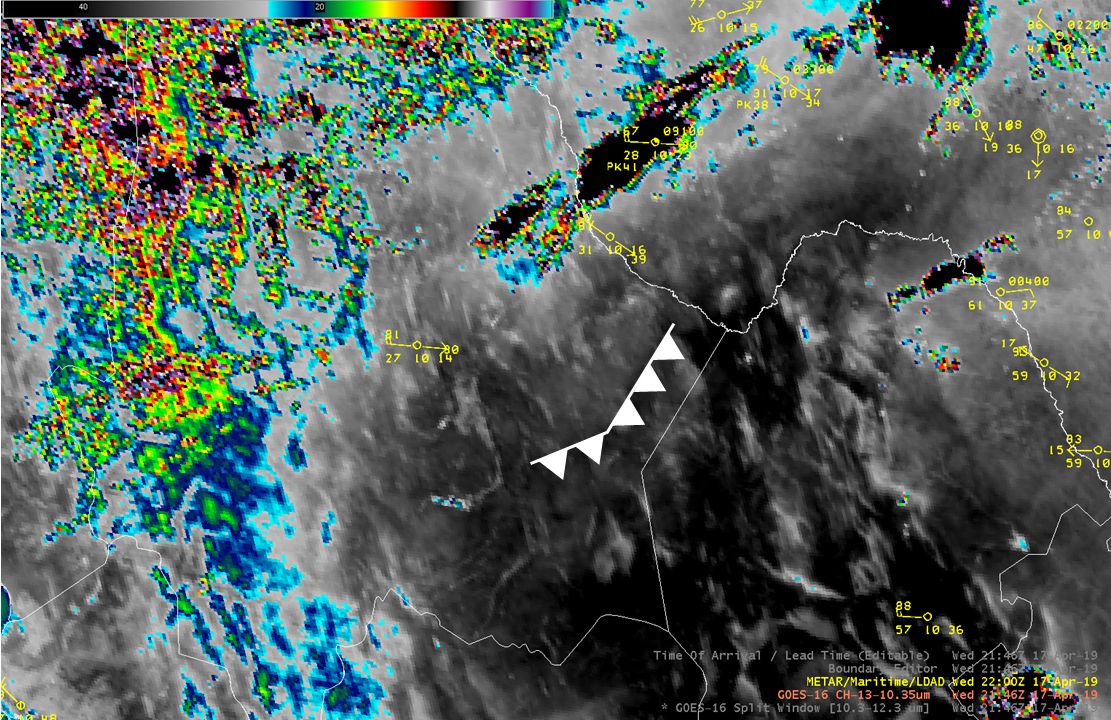
One technique to increase contrast of features of interest is to modify color tables. For example, in our cold front of interest, we created one possible color table to apply to the 10.3 micron band. At 22:46 UTC a segment of the cold front is denoted by a standard symbol in the figure below as means to aid the reader in identifying the leading edge of the cold airmass.
The readers attention is directed towards the evolution of the cold front in the following loop. During the loop (click link)
notice that convective initiation occurs coincident with the region of cooling observed that was annotated in the 7.3 micron image above. In particular, convective initiation occurs prior to the arrival of the cold front in the IR loop above. This suggests that convective initiation occurred as a result of a process independent of the cold front. As an aside, note that convective initiation in Texas occurs in association with the cold front.
In the Del Rio, TX WSR-88D reflectivity loop:
From the start of the loop, and prior to convection initiation, through about 0106 UTC horizontal streets rotate counterclockwise consistent with backing winds which would aid in the secondary circulation along the sloping ridge in northern Mexico. Also recall the onset of orphan anvils as discussed above along with blowing dust and cooling at 7.3 microns combined indicate pre-conditioning of an environment towards convective initiation ahead of the cold front. Around 0030 UTC convective initiation occurs in the region of interest in northern Mexico. Also note in the radar imagery the two modes of convection – linear to the north and isolated to the south with a well defined right moving supercell.
Another useful tool to monitor convective initiation is the time-of-arrival tool in AWIPS. Here it is used with the SWD product to track a dust plume that is interpreted as the leading edge of strong southwest flow heading towards our region of cooling at 7.3 microns and separate from the cold front. As seen in the loop
as the dust (purple) advects northeastward a line of shallow cumulus form and is interpreted as the leading edge of the strong southwesterly flow that eventually arrives at the region of cooling at 7.3 micron triggering convective initiation independent of the cold front.
One last item to note: the loop speed of the above IR loop is critical in being able to identify the movement of subtle features. If the loop speed is too low, identification of certain features may be difficult or impossible. Therefore it is suggested that the reader experiment with different loop speeds and the rock feature to aid in identification of features of interest.

