Dryline Bulges Identified in GOES-16 Split Window Difference on 30 April 2019
By Dan Bikos and Lewis Grasso
During the afternoon of 30 April 2019, a dryline mixed eastward from New Mexico into the Texas panhandle, as seen in this GOES-16 visible loop with METARs overlaid:
Thunderstorms initiate along various segments of the dryline during the animation.
The moisture gradient is substantial across the dryline so we may expect to see this in the GOES Split Window Difference (SWD) (10.3 minus 12.3 micron) product as well:
Upper left: CIRA SLIDER default enhancement applied to the SWD product
Upper right: AWIPS default enhancement (dust_and_moisture_split_window) applied to SWD product
Lower left: Linear enhancement with a modified range of 0 to 8 degrees Celsius applied to the SWD product
Lower right: Linear enhancement with a modified range of 0 to 5 degrees Celsius applied to the SWD product
Water vapor in the boundary layer is an absorbing gas to energy at 10.3 and 12.3 microns that is emitted from the earth’s surface. Water vapor absorbs more energy at 12.3 compared to 10.3 microns; therefore, when the temperature decreases with height the brightness temperature at 12.3 microns is less than the brightness temperature at 10.3 microns, hence the difference is positive. The magnitude of the SWD is greater on the moist side of the dryline compared to the dry side.
The above animation shows why it’s important to experiment with different color tables and range when looking at imagery. Certain features of interest may stand out more than others. For example, since there is a temperature dependence in the SWD, there is a diurnal variation in the animation as we approach sunset in the later half. The diurnal variation may mask the moisture variation of interest, this is particularly true of the color tables in the top two panels, whereas the diurnal variation is not as obvious in the bottom two panels.
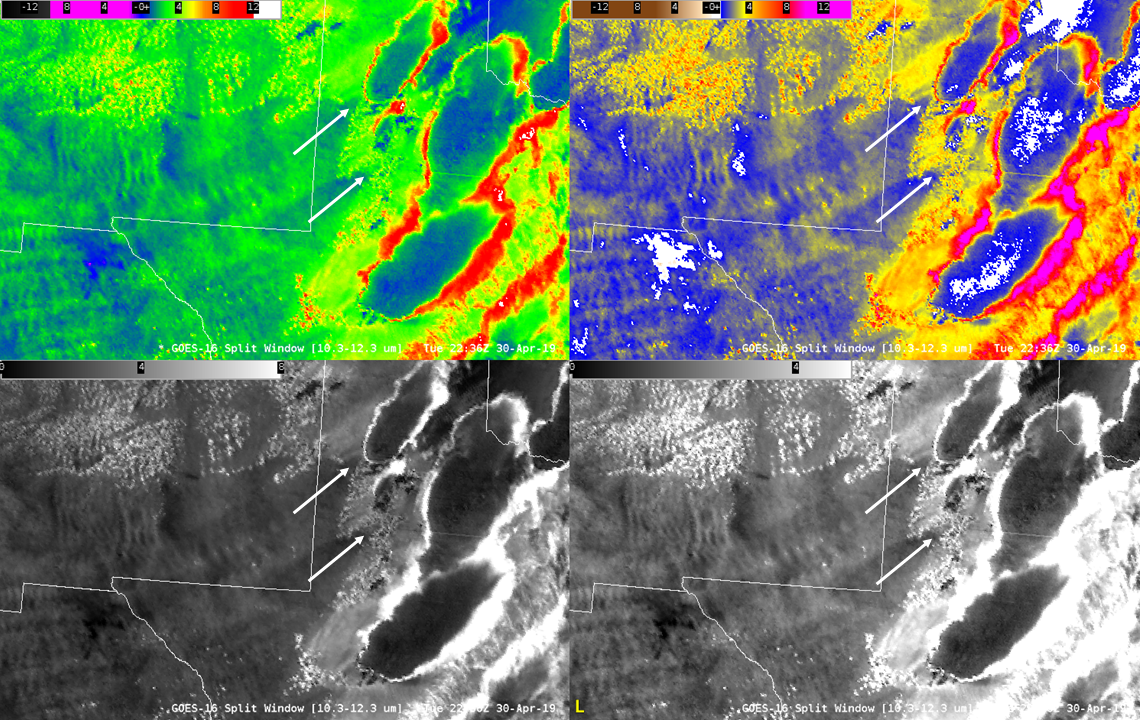
One feature that the SWD product really highlights more than visible imagery is the fact that there are smaller scale bulges along the dryline. These are important as they may be indications of localized moisture convergence which may trigger convective initiation. The smaller scale bulges are annotated with white arrows on the image below:

In the loop, notice that these smaller scale dryline bulges appear earlier in the bottom two panels compared to the top two.
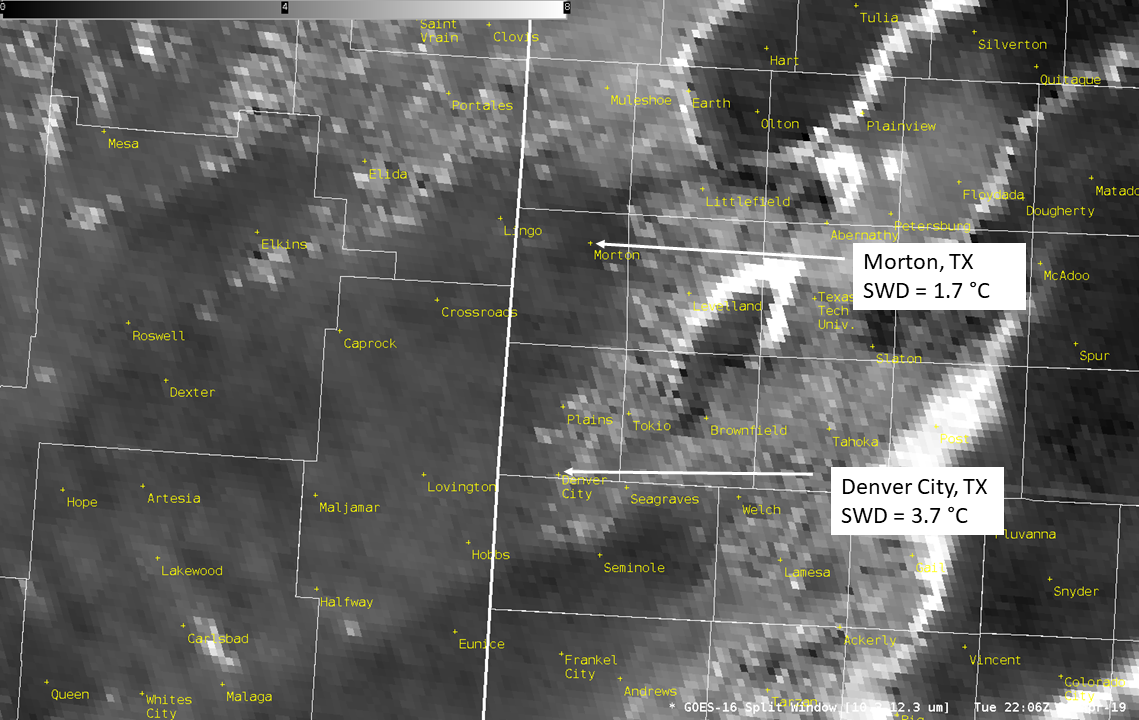
The visible imagery shown earlier does show indications of some cumulus along segments of the dryline, so are these regions actually more moist or being obscured by clouds as seen in the GOES imagery? To help answer that question we introduce surface observations from the west Texas Mesonet. Below is a zoomed in SWD image using the linear color table and range of 0 to 8 degrees Celsius at 22:06 UTC. At that time, there are two dryline bulges evident in the SWD product:

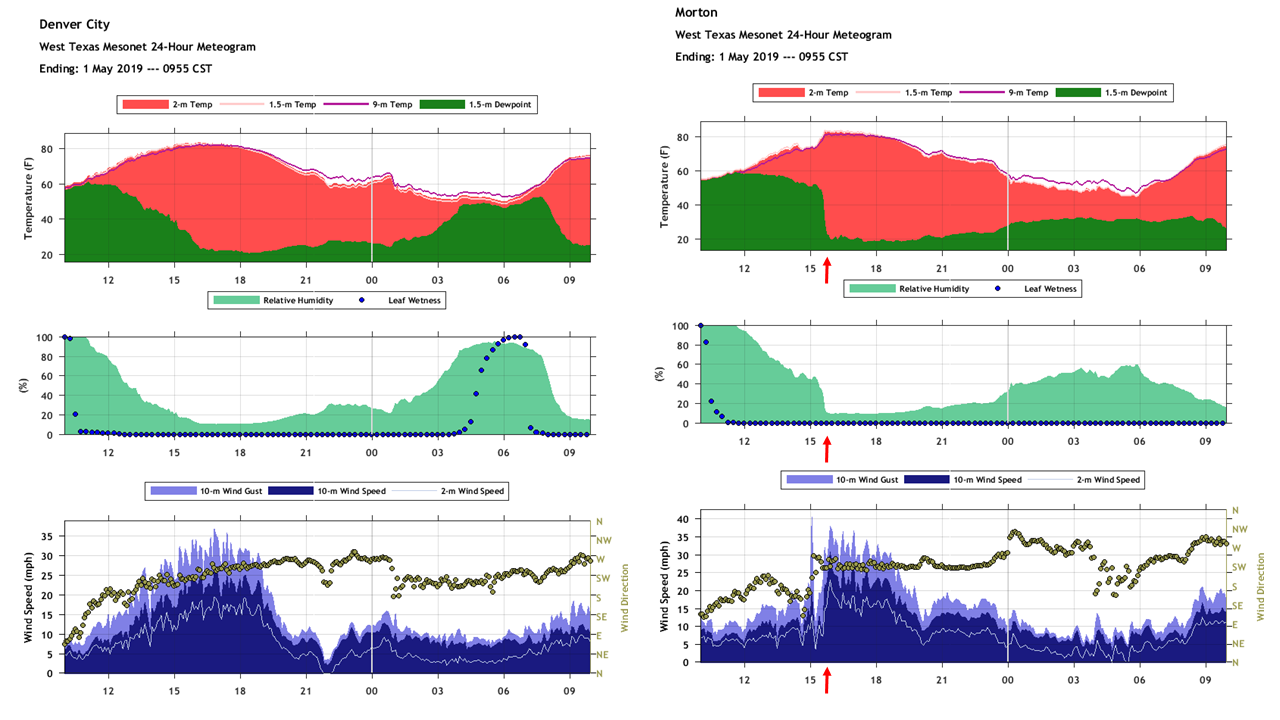
The SWD product suggests that Denver City, TX is still on the moist side of the dryline while Morton, TX is on the dry side. The meteogram below is from the observations at those locations, red arrows for the timeline in the Morton meteogram indicate the time of the above image (near 2200 UTC):

Meteograms courtesy of the West Texas Mesonet.
The dewpoint (shown in the solid green curve) clearly drops at Morton, TX BEFORE it does so in Denver City, TX. This is confirmation that the features identified in the GOES-16 SWD product are indeed associated with smaller scale dryline bulges. In fact, note the winds at Morton, TX increase in speed and veer in direction before it does so in Denver City, TX.
We conclude with a comparison of the GOES-16 SWD product with other familiar bands (0.64 micron visible, 10.3 micron IR, and 7.3 micron water vapor):
How well do the dryline bulges discussed above show up in other bands?
Which bands can you see outflow from the southernmost storm in?
