Water vapor imagery in an extremely dry airmass – 31 October 2019
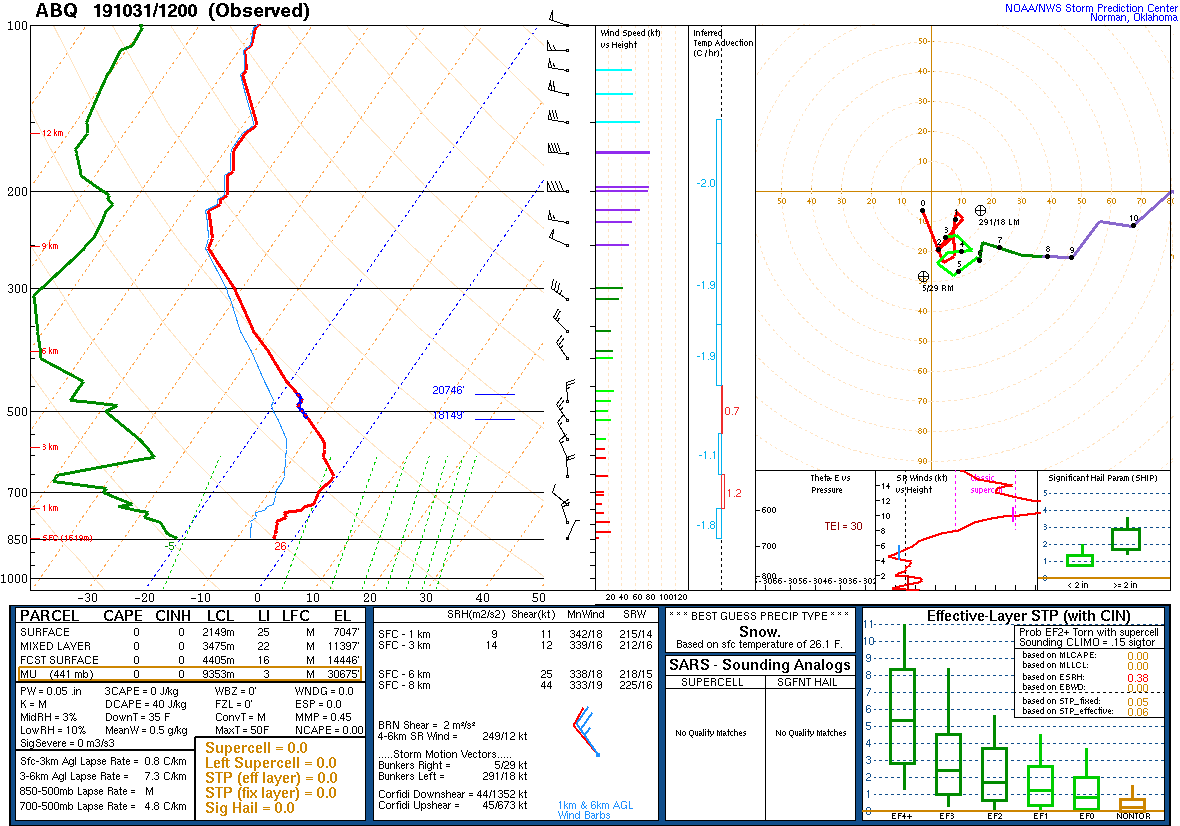
On 31 October 2019 a very dry airmass existed over the southwest US. To illustrate the dry airmass, consider the sounding from Albuquerque, NM with a precipitable water amount of 0.05″ (1.27 mm):
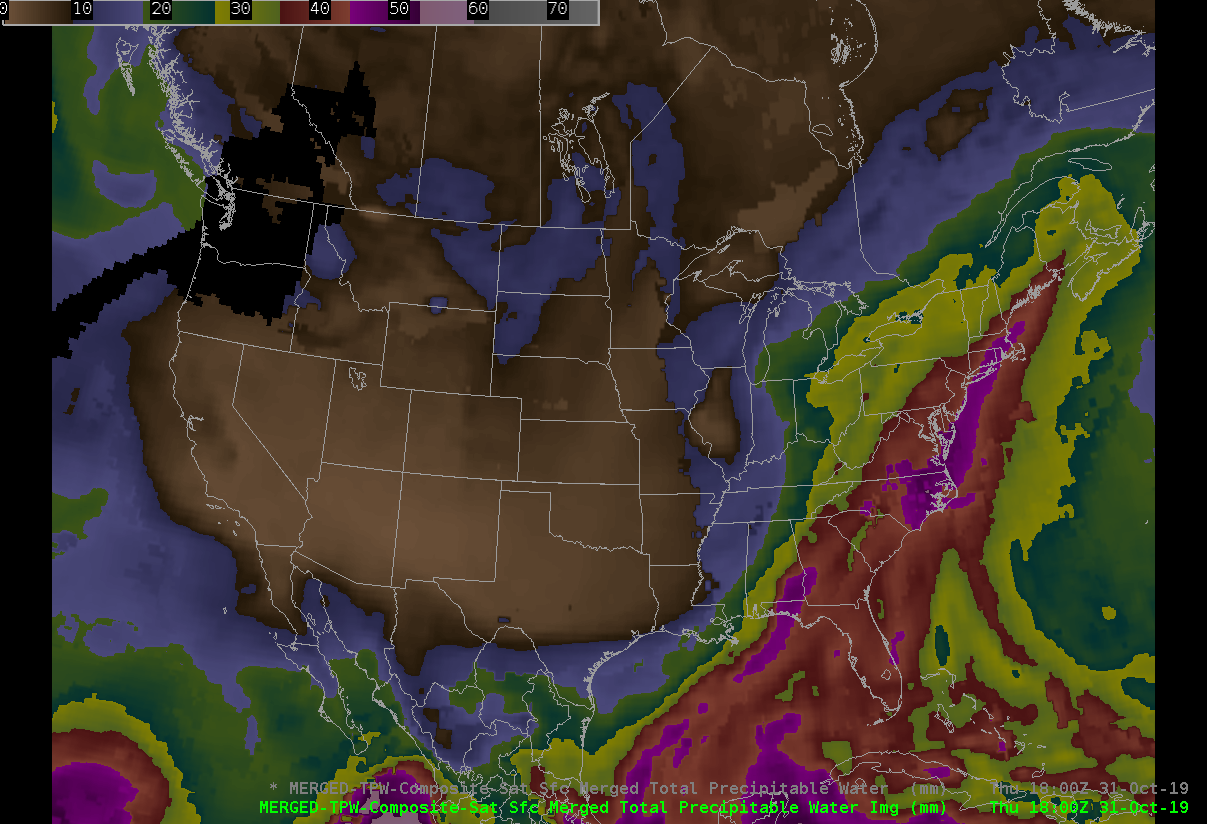
The synoptic scale pattern was characterized by above normal PW in the east ahead of a trough, with below normal PW in the west behind the trough, as seen in the CIRA experimental TPW product:
This experimental product combines retrievals from both polar orbiting and GOES satellites. Contrast this with the current operational blended TPW product on AWIPS which uses only polar orbiting satellite data.
Next let’s consider the GOES water vapor bands, normally the upper 2 water vapor bands (at 6.9 and 6.2 microns) do not see all the way to the surface due to water vapor absorption. Recall that on occasion the low-level water vapor band at 7.3 microns may see to the surface depending on how dry it is. In this extremely dry airmass over elevated terrain, what do the GOES water vapor bands show?
Upper left panel: GOES-16 Water vapor band at 7.3 microns
Upper-right: GOES-16 Water vapor band at 6.9 microns
Lower-left: GOES-16 Water vapor band at 6.2 microns
Lower-right: GOES-16 GeoColor
Note that we observe clear skies across this scene in the GeoColor product.
In the 7.3 micron (low-level) water vapor band, we readily observe the earth’s surface as it warms with daytime heating. You can compare the terrain features seen in this imagery with what is shown in GeoColor. The warmest brightness temperatures are observed due to a combination of locally highest elevations and a relative minimum in TPW. In the 6.9 micron imagery we observe brightness temperature maxima where we see mountain peaks across various ranges, particularly in New Mexico. Even at 6.2 microns we observe indications of diurnal heating and warmer brightness temperatures along various peaks in New Mexico.
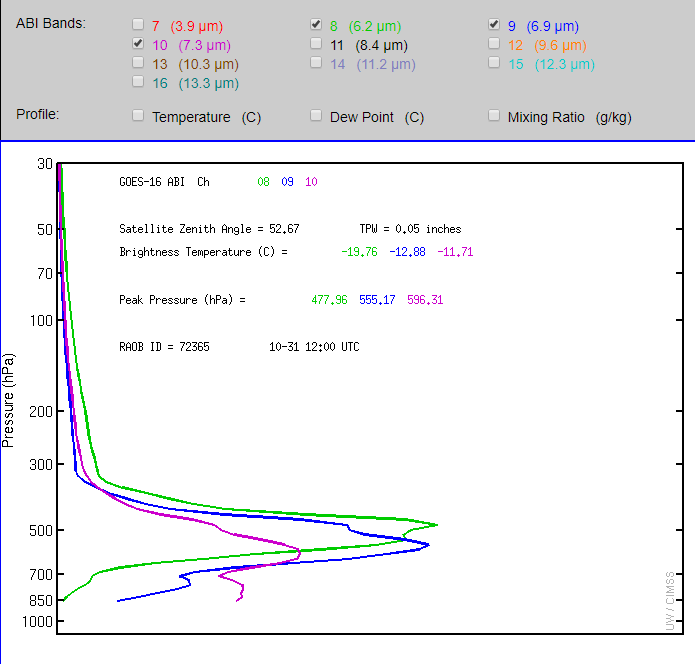
To help explain why the imagery sees all the way to the earth’s surface we analyze the weighting function profile from the Albuquerque sounding (courtesy of CIMSS – https://cimss.ssec.wisc.edu/goes/wf/):
Typically the weighting function profile for water vapor bands on GOES does not extend all the way to the surface, however due to the extremely dry airmass in place, the 7.3 and 6.9 micron bands have contributions from the earth’s surface. In fact, the 6.2 micron band even had contributions at elevations just above Albuquerque which explains why higher mountain peaks, which would be above 850 mb, are being observed in the 6.2 micron imagery.
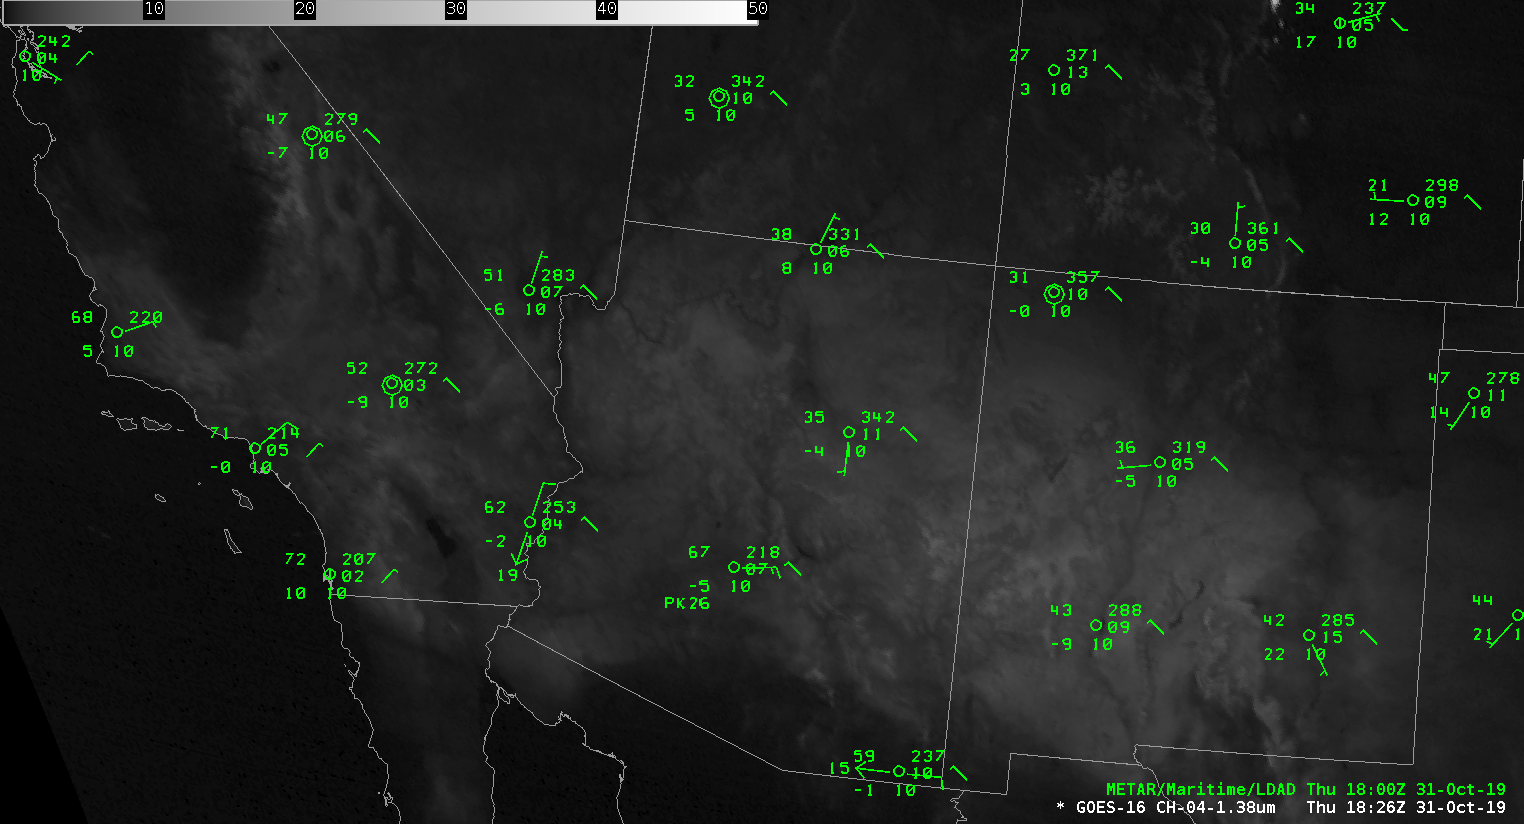
The 1.38 micron “cirrus” band also is significantly affected by water vapor absorption, which is why this band is typically used to highlight cirrus clouds since the earth’s surface is generally not seen due to significant water vapor absorption. In this particular case with an extremely dry airmass, the earth’s surface shows up readily across the region of interest:


