Moisture products for the tornadic storm of 4 July 2020 in Saskatchewan
On 4 July 2020 a thunderstorm developed in southern Saskatchewan that led to numerous tornadoes (video, picture, pictures).
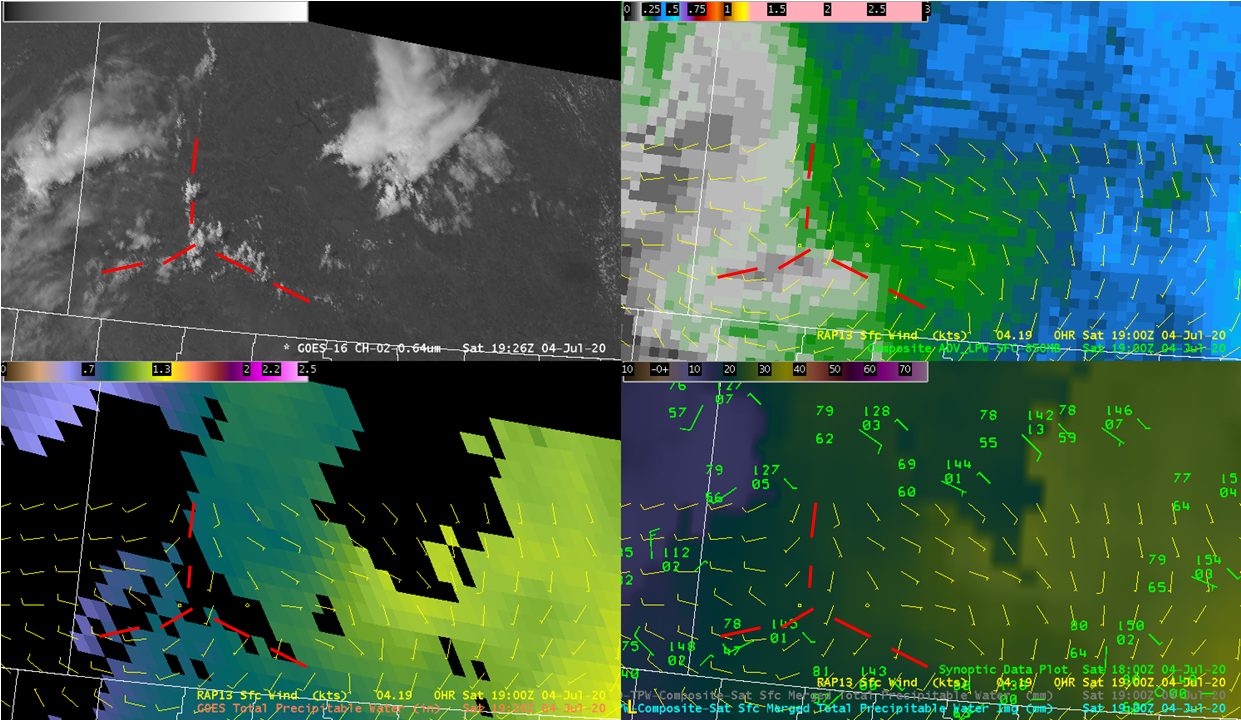
Let’s analyze various satellite derived moisture products in the time period leading up to the tornadic storm. The following loop 4-panel loop:
Upper-left: GOES-16 visible (0.64 micron) imagery.
Upper-right: Advected Layer Precipitable Water (ALPW) product in the surface to 850 mb layer with RAP 00hr surface winds.
Lower-left: GOES-R baseline Total Precipitable Water (TPW) product with RAP 00hr surface winds.
Lower-right: Merged (GOES + POES) Advected TPW product with surface observations.
It’s important to note the status of the 3 moisture products. The GOES-R baseline TPW product has been operational in AWIPS, the ALPW product is non-operational but will become operational in AWIPS within the next 1-2 years, while the Merged Advected TPW product is very much experimental (still in development).
First looking at the visible imagery, we observe morning convection while later we see storms develop along a north-south oriented boundary. Most of the storms move off to the northeast, however one of the storms appears to develop at the intersection of this boundary with another boundary that is almost east-west oriented and this storm moves southeast. Tornadoes are associated with the storm as it’s moving southeast and exhibits inflow feeder clouds.
The RAP surface winds and surface observations provide indications of a triple point, however the signal is not strong since the winds are not strong. If we use this data along with indications of the boundary in the visible imagery to annotate with red dashed lines where the boundaries are:

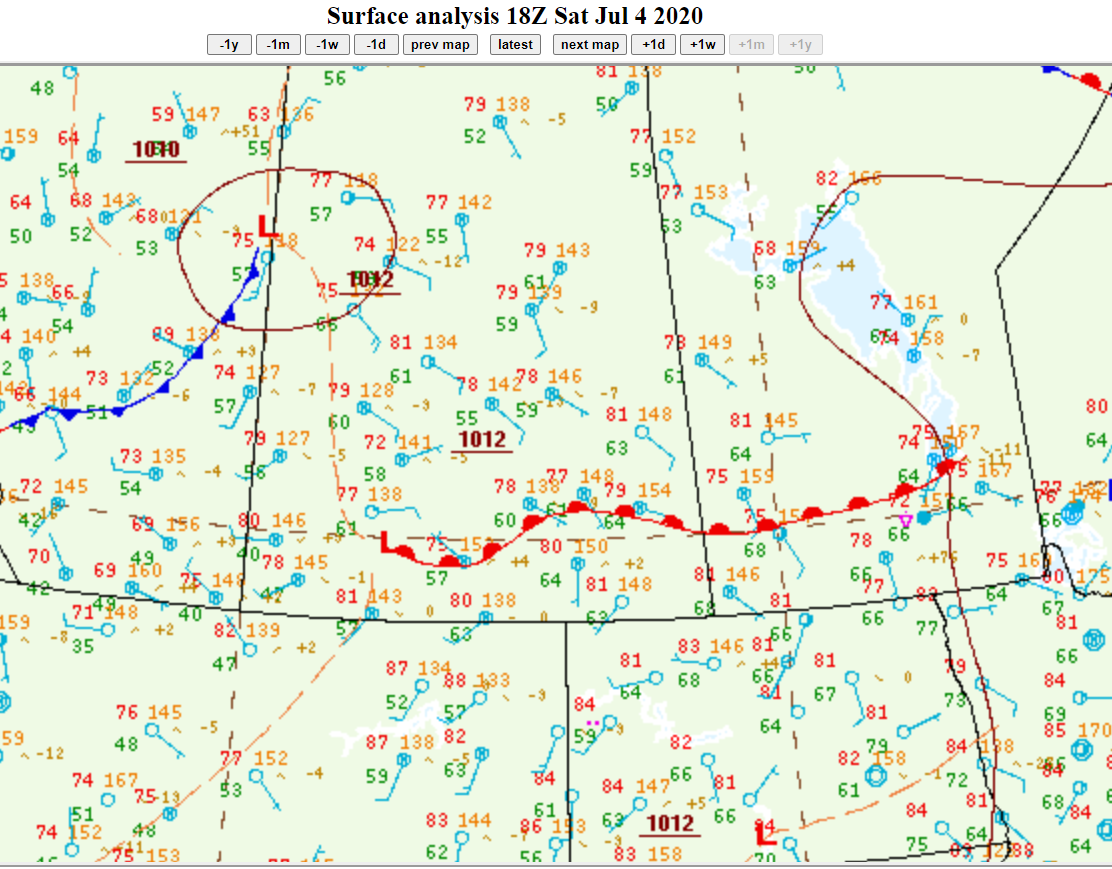
The triple point shows up nicely with west winds (shortly later northwest winds) with the cold front to the west, light east/southeast winds in the warm sector and southwest winds further south with drier air (78/47 in the observation) – a classic dryline/cold front triple point although in this case much more subtle since the winds were relatively light and the boundaries and air mass differences were subtle (i.e., the weak cold front may be analyzed as a trough). The WPC official surface analysis at 18Z shows the triple point analyzed as a trough to the north and southwest, with a warm front to the east:

Note the color table and range for the bottom 2 panels of the 4 panel image above are corresponding so as to make comparison between the 2 products. One limitation of this however is that gradients at key ranges for this particular case may be smoothed out. An alternative would be a different color table that shows increased contrast across the feature of interest so that it stands out more readily such as this animation depicts:
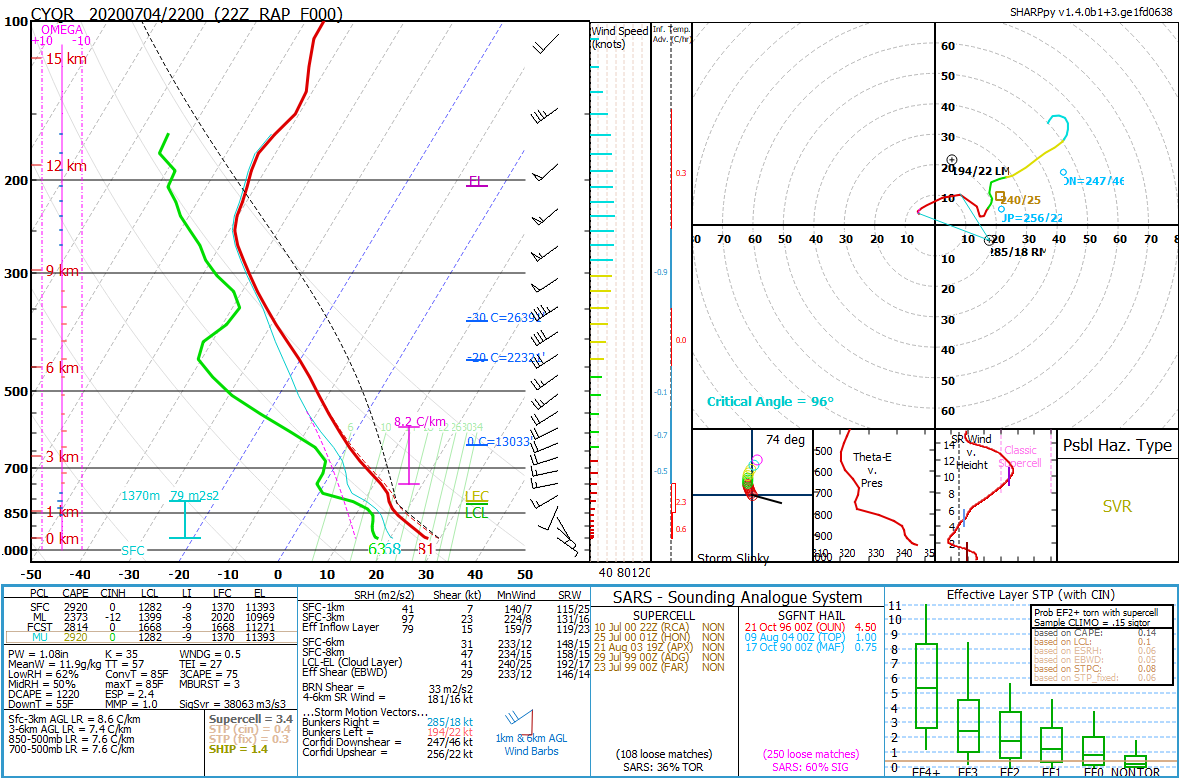
Viewing the animation of the moisture products to focus on the dryline (the analyzed trough extending southwest of the surface low), the TPW products show subtle indications of the relatively drier versus relatively more moist airmasses. However, in comparison with the ALPW surface to 850 mb layer we see that the ALPW product really shines at highlighting the various airmass differences. This shouldn’t be surprising since low-level moisture is key for severe thunderstorms, particularly in an environment with an elevated mixed layer as seen in the RAP 2200 UTC 00hr profile from Regina, SK:

Keep in mind that the ALPW product has 4 layers, and they may be viewed for this case here:
2 key points from this loop:
1) The triple point is very much a low-level feature, it only shows up in a more subtle way in the 850-700 mb layer and does not show up above that.
2) There is rich /deep moisture in the warm sector east of the triple point in a relatively narrow corridor and the storm moves towards this region as it turns to the right (moving southeast in an environment of southwest flow aloft).
One final question worth considering, did the morning convection produce an outflow boundary that moved southwest and contributed to higher moisture / convergence for the afternoon thunderstorms? There are some indications of that in the moisture products with varying degrees of subtlety. The GOES-R baseline product seems to show some increase in TPW to the southwest of the morning convection, while the ALPW seems to show some increase in low-level moisture as well. The following animation supports this hypothesis if we make some continuity assumptions of where the weak outflow boundary would exist, but the key is that it may have reinforced the weak warm front:
Note the inflow feeder clouds towards the end of the animation, a satellite storm-scale signature that indicates the storm is likely severe.
In summary, we have a triple point pattern that led to a tornadic storm. often times we think of a triple point pattern with strong convergence along the boundaries and obvious air mass differences, making identification of the triple point pattern relatively easy. In this case, the winds are much weaker and the boundaries and air mass differences are much more subtle. It’s definitely more challenging to identify this pattern in these circumstances, however ALPW and other moisture products help with respect to identification of air mass differences and boundaries (from the PW gradients).
When using the moisture products operationally, latency should be kept in mind. Let’s first discuss latency as defined as receipt time on AWIPS. The GOES-R baseline TPW product has the least latency (~15 minutes) with ALPW latency a little over 45 minutes while the merged TPW product is about the same albeit still experimental. These products can be used for relatively short-fuse type of events, so long as it’s not so short that latency becomes an issue. Keep in mind, the products that contain POES data have a “hidden latency” in that the most recent passes that are advected to make the products are generally 2 to 6 hours old. Despite these limitations, the evolution of the triple point is captured quite well in the surface to 850 mb layer ALPW. Perhaps the GOES product may have shown this as well, however we have the limitation of cloud obscuration and it is a total precipitable water product. Some of the important changes that occur at lower-levels (therefore captured by the lowest layer ALPW) are “washed out” in a TPW product.
