Impacts of Water Vapor on Satellite Dust Detection of the 16-17 February 2020 Saharan Air Layer Dust Event over the Eastern Atlantic
Lewis Grasso1, Dan Bikos1, Jorel Torres1, John Forsythe1, Heather Q. Cronk1, Curtis J. Seaman1, Emily Berndt2
1Cooperative Institute for Research in the Atmosphere, Colorado State University, Fort Collins, CO
2NASA Marshall Space Flight Center, Short-term Prediction Research and Transition Center, Huntsville, AL
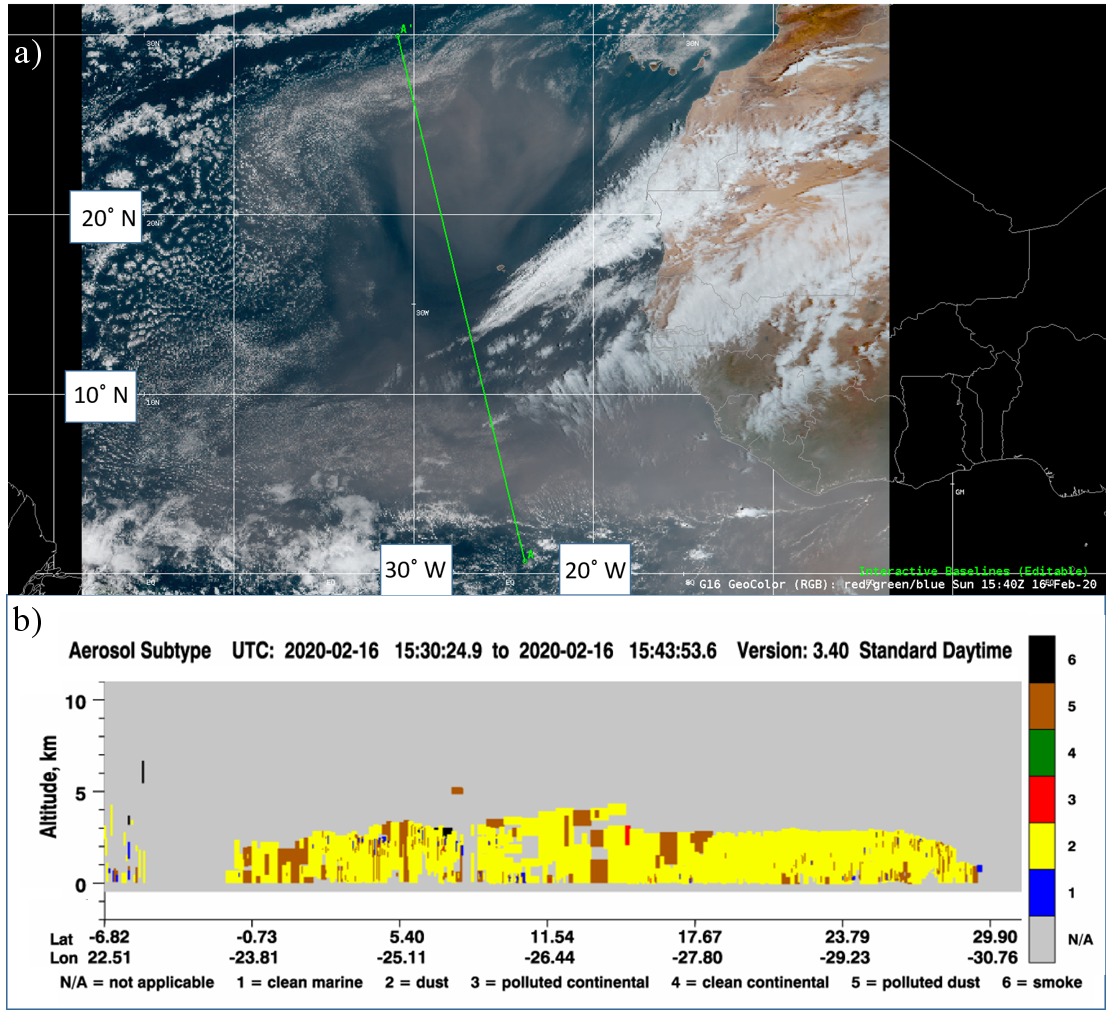
In the afternoon of 16 February 2020 a dust layer moved off western Africa. A loop of GeoColor imagery from ABI on GOES-16 exhibits the dust layer, which is typically part of a Saharan Air Layer (SAL), that moved westward over the eastern Atlantic Ocean. At approximately 15:40 UTC 16 February 2020, CALIPSO moved northward over the SAL; a green line segment in Fig. 1a indicates the ground track of the CALIPSO satellite. Data from CALIOP, the primary sensor onboard CALIPSO, was used to produce a Vertical Feature Mask (VFM), also shown in Fig. 1b. As seen in the VFM, the primary constituent was dust and is indicated in the VFM as a yellow shading, from the surface to about 3.0 km.
Figure 1: (a) GeoColor imagery diagnosed from ABI on GOES-16 valid at 1540 UTC 16 February 2020 along with a portion of the ground track (green line segment) of CALIPSO from 1530 UTC to 1543 UTC 16 February 2020. (b) Dust, in yellow, is displayed in the vertical feature mask from CALIOP.
Annotations are placed on GeoColor imagery valid 17:50 UTC 16 February 2020 that distinguish between a northern dust region (NDR) and a southern dust region (SDR), see Fig. 2. A black oval is used to indicate the NDR while a horizontal, black, dashed line segment denotes the SDR in the figure.
Figure 2: GeoColor imagery diagnosed from ABI on GOES-16, valid 1750 UTC 16 February 2020, along with the following annotations: A black oval bounds dust in the NDR while the horizontal, black, dashed line highlights dust in the SDR. Within the black oval are additional annotations in red. Further the letters A (upper left portion of the figure), B, and C appear. All annotations are used for comparison purposes with Fig. 3.
A companion image to Fig. 2 is Fig. 3, which displays the ABI infrared channel difference, Tb(10.35 um) – Tb(12.3 um)
Figure 3: Channel difference, Tb(10.35 µm) – Tb(12.3 µm) (˚C), from ABI on GOES-16 valid at 1750 UTC 16 February 2020. Annotations are the same as in Fig. 2. Dust is indicated by the blue and purple colors within the black oval in the northern dust region. There was a lack of a dust signal in the southern dust region.
A dust signal is evident in the NDR with negative to near zero values of the channel difference. In sharp contrast, the SDR is void of a dust signal with values of the channel difference near 3˚C in Fig. 3. In addition, the red oval in Fig. 2 surrounds thick dust, which is coincident with a strong dust signal in Fig 3. Southwest of the red dashed contour in Fig. 2, dust appears thin, which was a region with a weak dust signal in Fig. 3. In the northwest portion of Figs. 2 and 3 the letter A is used to highlight the sharp boundary of low-level liquid clouds as opposed to the diffuse boundary of dust, despite the same channel difference color. That is, different features in Fig. 2 may have similar values of the channel difference in Fig. 3. Further, the letter B denotes locations of thin cirrus along the western portions of the horizontal, black, dashed line segment of the SDR. Although the letter C identifies a region with a similar channel difference color as thin cirrus in Fig. 3, a comparison of the region C in Figs. 2 and 3 reveal clear skies.
Imagery from VIIRS on NOAA-20 at 1510 UTC 16 February 2020 is displayed in Fig. 4.
Figure 4: Data from VIIRS on NOAA-20 valid at approximately 1510 UTC 16 February 2020 showing (a) True-Color, as opposed to GOES-16 ABI GeoColor, imagery and (b) VIIRS channel difference, Tb(10.76 µm) – Tb(12.01 µm), with the same color table shown in Fig. 3.
Note the similarity of patterns in True-Color imagery from VIIRS (Fig. 4a) and the channel difference (Fig. 4b) compared to those from ABI in Figs. 2 and 3. One unanswered question is why does dust in the NDR and SDR (Fig. 2) have such a different appearance in the channel difference (Fig. 3).
Values of the total precipitable water (TPW) from the GFS analysis are superimposed on GeoColor imagery, both valid at 1800 UTC 16 February 2020 (Fig. 5). As illustrated in the figure, values of TPW varied between 0.5 inches to 0.75 inches in the NDR; in contrast, TPW values increased significantly to near 1.5 inches in the SDR.
Figure 5: TPW (in) from the GFS analysis plotted on a GeoColor image derived from GOES-16 ABI; all data is valid at 1800 UTC 16 February 2020.
Values of the TPW from the GFS analysis were also superimposed on the ABI channel difference (Fig. 6), valid at the same time as Fig. 5.
Figure 6: Same as Fig. 5, except TPW (in) is plotted on the GOES-16 ABI Tb(10.35 µm) – Tb(12.3 µm) channel difference (˚C).
One striking feature in Fig. 6 is the clear link between low values of TPW (0.5-075 inches) and a dust signal in the NDR as opposed to high values of TPW (1.0-2.0 inches) an a lack of a dust signal in the SDR.
Satellite retrievals of Advected Layer Precipitable Water (ALPW) retrieved from microwave instruments, valid 0300 UTC 17 February 2020, are displayed in Fig. 7.
Figure 7: Advected Layer Precipitable Water product (in) for the surface to 850 hPa layer valid at 0300 UTC 17 February 2020.
As seen in the figure, the NDR was characterized has having the lowest values of LPW, from the surface to 850 hPa. Values increased sharply in the SDR where a dust signal was absent in ABI channel difference images.
Values of TPW diagnosed or computed from retrieved NUCAPS soundings, valid 03:30 17 February 2020, are shown in Fig. 8. Similar to the patterns in Fig. 7, values of TPW were the lowest over the NDR and largest over the SDR.
Figure 8: Gridded NUCAPS TPW (mm) valid at 0333 UTC 17 February 2020, which represents the time of the granule in the image.
Observations of the water vapor field for this dust event allows for the development of a hypothesis. Based on GFS analysis and satellite retrievals of water vapor, dust is detected/masked when water vapor content in the atmosphere is low/high. That is, when water vapor values are low enough infrared channel differences, and dust products, will detect a dust signal. However, when water vapor content is above a critical value the channel difference will be dominated by a water vapor signal, thus masking dust.
One beneficial consequence of infrared channel differencing of dust in a dry environment is the ability to track dust layers when the sun sets. During the night, GeoColor imagery will be unable to reveal dust layers as a result of the loss of reflection of solar energy off dust. Figure 9 is an animation of the channel difference, which allows a forecaster to follow the nocturnal morphology of dust.


