Flooding in Utah – 26 July 2021
By Sheldon Kusselson and Dan Bikos
The North American monsoon has been in full swing during the summer of 2021, bringing much needed moisture to the Southwest.

At times though the abundant moisture has resulted in heavy rain and flash flood events.

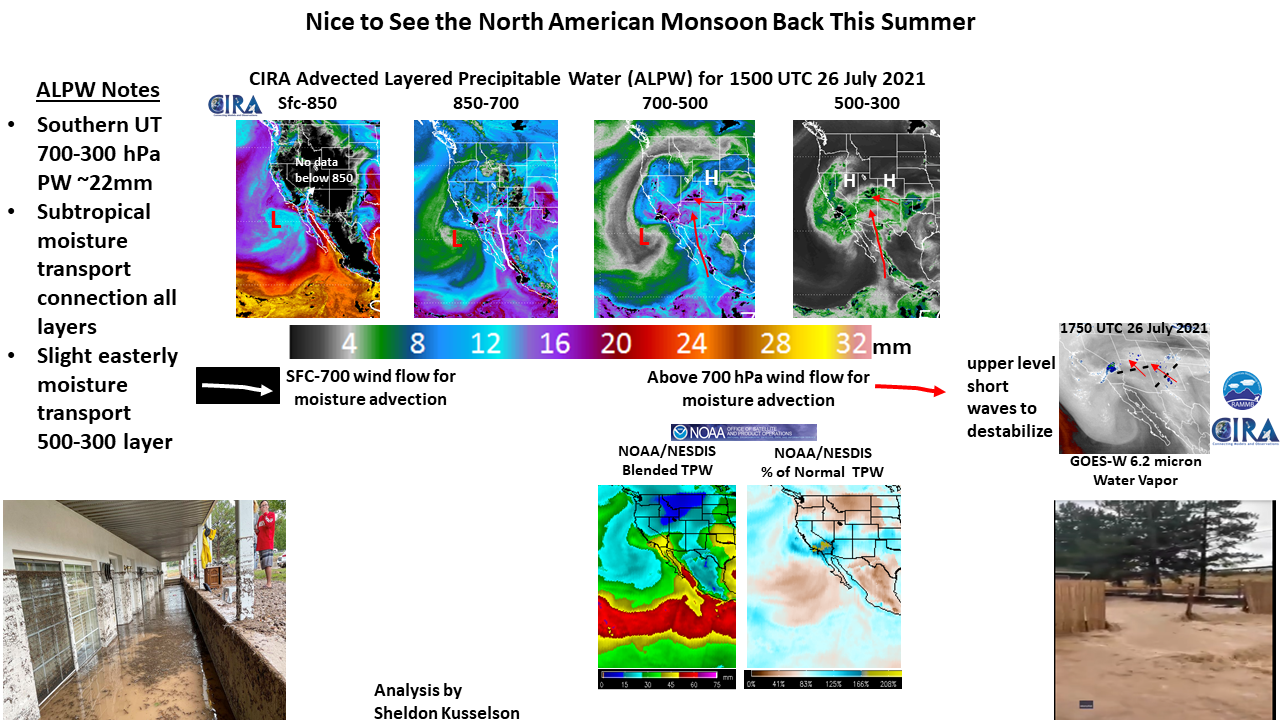
See the 4 panel Advected Layer Precipitable Water (ALPW) animation
Upper left: ALPW in the Surface to 850 mb layer
Upper right: ALPW in the 850 to 700 mb layer
Lower-left: ALPW in the 700-500 mb layer
Lower-right: ALPW in the 500-300 mb layer
When viewing this product in the west, keep in mind that data is missing over higher elevations. This effect is easily observed in the Surface to 850 mb layer, and even shows up in localized regions of the 850 to 700 mb layer. The 700-500 mb layer is very useful for the monsoon season with the typically high moisture values observed in mid-levels over regions of higher elevation. The relative maximum in moisture across southern Utah can be easily observed in this layer. The 500-300 mb layer can depicts regions of higher moisture at that level highlighting regions where the moisture is particularly deep which can enhance precipitation efficiency. Compare the animation with the slide above that denotes with arrows the direction moisture plumes are moving in the different layers. Source regions of moisture can be readily identified along with when these moisture layers become vertically aligned leading to a deep moist profile typically associated with excessive precipitation events.
See the 4 panel 700-500 mb ALPW, GOES-16 6.2 um water vapor band and 2 TPW products
Upper left: ALPW in the 850 to 700 mb layer
Upper right: GOES-16 6.2 um (upper-level) water vapor band
Lower-left: Blended TPW product (operational), (missing before 1400 UTC)
Lower-right: Merged (GOES + POES) TPW product (experimental)
Compare the animation of the water vapor imagery with the annotated water vapor image on the slide above that denotes short waves.
Compare the TPW products with the ALPW animation above, how do they complement and supplement each other?
Upper left: ALPW in the 850 to 700 mb layer
Upper right: MRMS composite reflectivity
Lower-left: GOES-16 IR (10.3 um)
Lower-right: GOES-16 upper-level water vapor (6.2 um)
Again, the water vapor imagery depicts the short wave.
Note how the ALPW seems to increase at certain times. If the increase is occurring over a large area, it is likely due to a new polar pass becoming available or a pass with a different sensor.
Detailed information on the flooding in southern Utah
