The VIIRS Flood Map Product
Need a new satellite product to observe flooding? Look no further than the VIIRS Flood Map product. The VIIRS Flood Map calculates the flood extent of a 375-m pixel (i.e., known as the floodwater fraction percentage from 0 to 100%, displayed in green-to-red colors). The product also differentiates between scene types (e.g., cloud cover, bare land, snow cover, vegetation). Currently, the product is only available during the daytime, and employs VIIRS imagery band data from the Suomi-National Polar-orbiting Partnership (SNPP) and the NOAA-20 satellites.
Users can access the product online: near-real-time flood data via RealEarth, data over Alaska via GINA, and a NOAA Satellite Proving Ground Global Flood Products Archive. National Weather Service (NWS) users can access the product online and via the Advanced Weather Interactive Processing System – II (AWIPS-II).
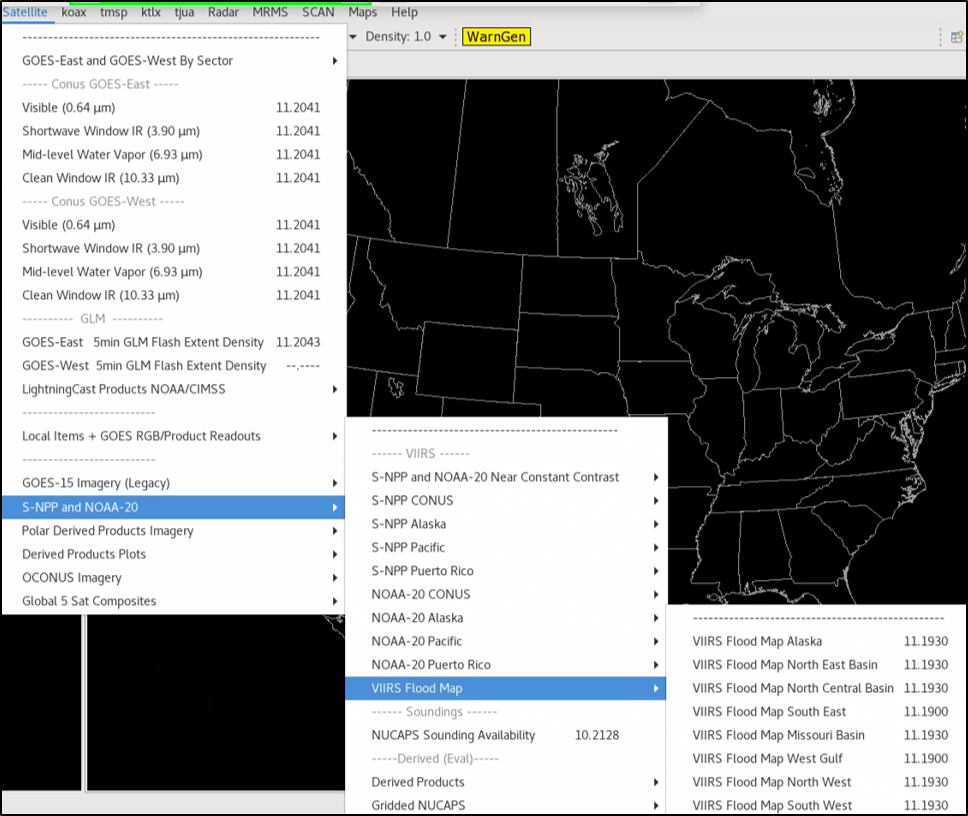
Note, in AWIPS-II, users can choose between 8 regional sectors to access the VIIRS Flood Map: 7 CONUS regions and 1 Alaska region. Under the AWIPS Satellite menu, users can scroll down and click on ‘S-NPP and NOAA-20’, then ‘VIIRS Flood Map’, and can select the domain of interest. Refer to the AWIPS screenshot below.

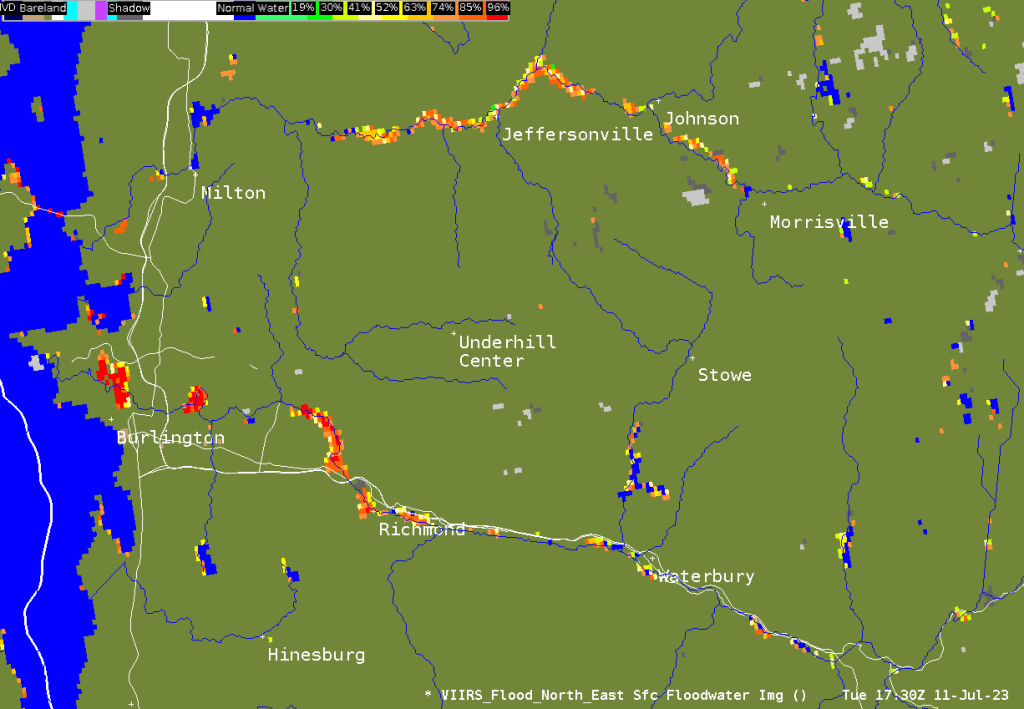
A VIIRS Flood Map example (see below) from the ‘North East Basin’ sector shows the recent flooding that transpired over the state of Vermont. The northeast United States received significant precipitation over the past few days (over 9 inches in Vermont) that led to flooding in a few states. Notice the inundation along Interstate 89 between Burlington, VT and Waterbury, VT.

