Canadian Wildfires
Another summer and another round of wildfires and smoke that inundate the Canadian provinces and territories. From 19-21Z, 17 July 2024, VIIRS GeoColor observed the smoke and fires extending from British Columbia to Hudson Bay. A daytime animation of VIIRS overpasses from SNPP, NOAA-20, and NOAA-21 can be seen below.
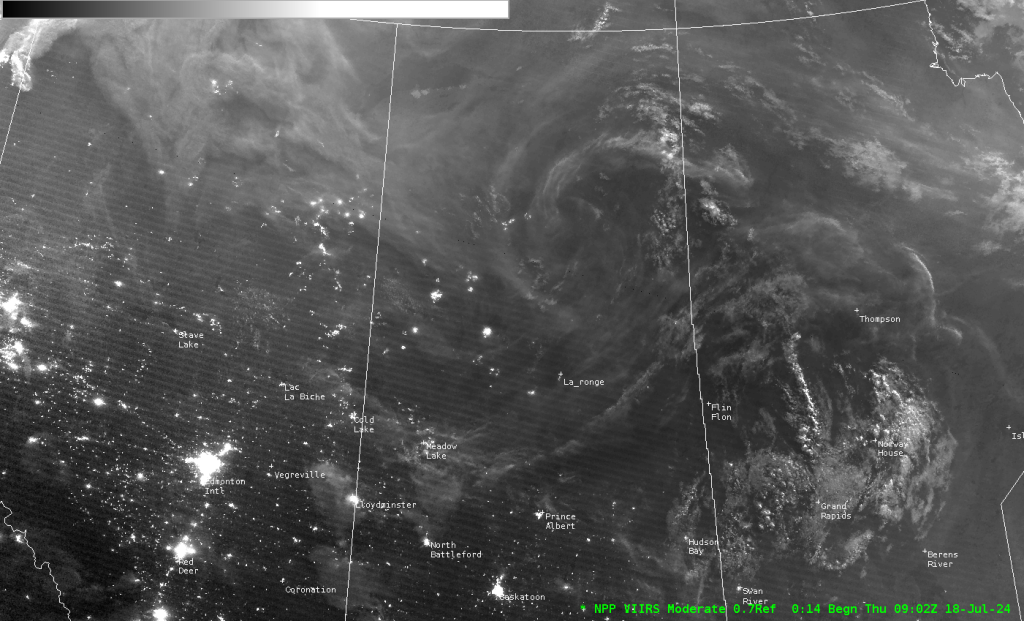
At ~09Z 18 July 2024, the SNPP VIIRS Near-Constant Contrast (NCC) product captured the emitted lights from the fires and the neighboring towns and cities. The nighttime visible imagery also observed a mix of smoke and clouds over the Canadian provinces. The use of nighttime visible imagery is unique, especially for the detection of smoke at night, which is challenging to observe in the infrared channels. Refer to the SNPP VIIRS NCC image below.

Note, forecasters can modify the VIIRS NCC color table in AWIPS-II, which can be customized to bring out features in the imagery (in this case, the smoke and clouds). A comparison of two NCC imagery enhancements, the default NCC 0-to-1 scale and the 0-to-0.7 scale are seen below at ~9Z, 18 July 2024. The 0-to-0.7 NCC enhancement helps illuminate the smoke and clouds, but increases the saturation of the emitted lights. Forecasters should be aware of the different NCC enhancements (a.k.a., scales) and how they can bring out certain features more than others. Additional information on the NCC enhancements can be explored here.
If we focus on the emitted lights that are seen at ~9Z, 18 July 2024, how can forecasters differentiate between emitted lights that are produced from fires and the emitted lights produced from cities and towns? In the nighttime visible imagery, city/town lights can be detected via individual pixels or clusters, where fires are represented by bright pixels that tend to have a corresponding diffuse smoke plume.
Additional ways to locate emitted lights from fires is to overlay other datasets onto the NCC imagery (e.g., utilize the 3.74µm, Fire Temperature RGB, etc.). The animation below shows the VIIRS Active Fire product overlaid onto the VIIRS NCC data at ~9Z, 18 July 2024. The VIIRS Active Fire displays a range of colors, from yellow to dark red colors that indicate values of increasing fire intensity. The fire intensity is expressed in MegaWatts (MW). In the animation, notice the varying fire intensities across Canada and how they align with certain emitted lights. Also note the emitted lights that are not associated with the thermal hot spots, such as the city of Edmonton. Edmonton is seen as a cluster of emitted city lights that can be observed in the bottom left corner of the animation.
