Fort McMurray Wildfires and Near-Constant Contrast (NCC) Imagery
The Fort McMurray Wildfires started in the city of Fort McMurray, located in the northeastern part of Alberta, a province of Canada. The wildfires started 01 May 2016 and are still currently burning. The wildfires have burned over 1,200,000 plus acres of land and has reached into parts of western Saskatchewan. Over 2,400 plus homes and businesses were lost within the Fort McMurray area (The Globe and Mail and Weather.com). Estimated insured losses from the fires are between 3-7 billion U.S. dollars (Insurance Journal). According to the Washington Post, the wildfires have produced an estimated 85 million tons of carbon dioxide equivalent emissions as of 20 May 2016.
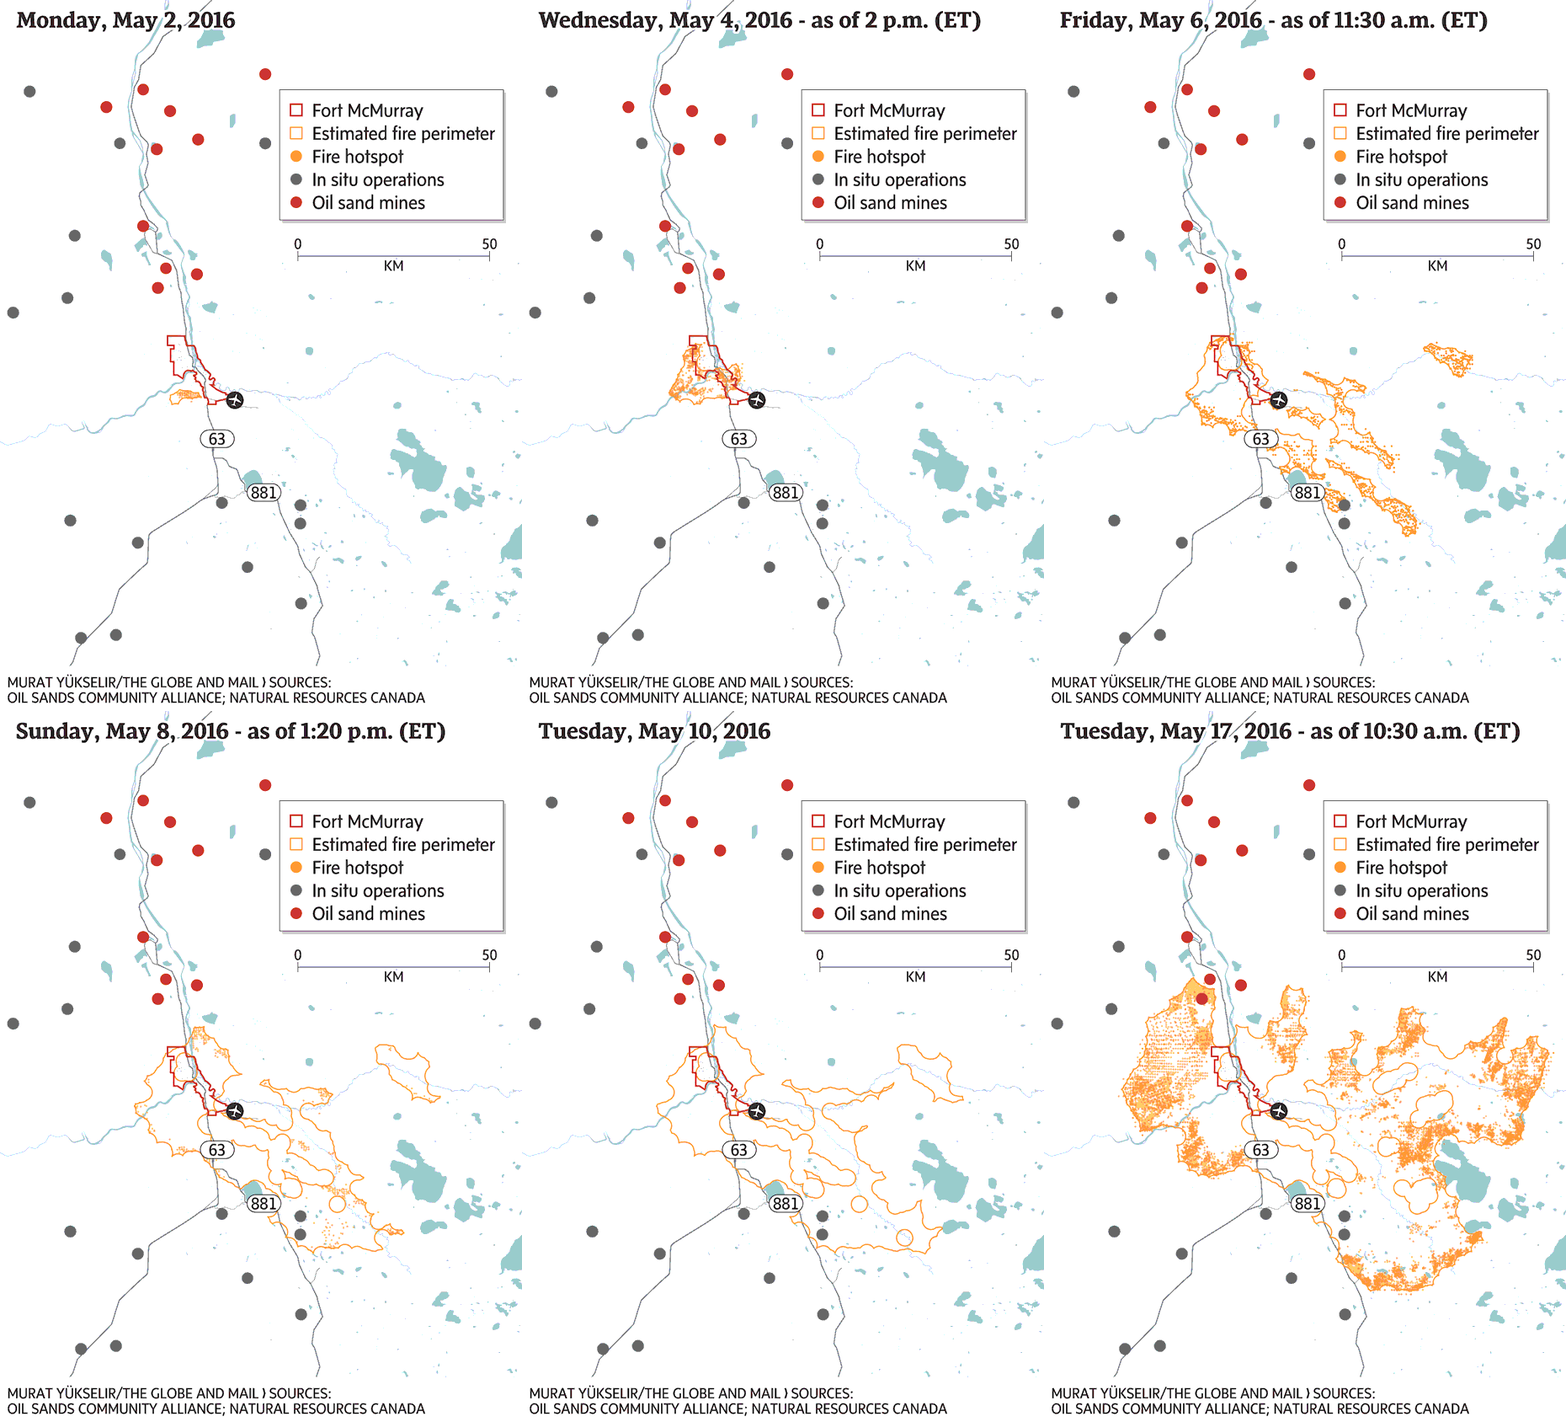
The sequence of the estimated fire perimeters can be shown through the animation below.
A subset of operations for National Weather Service (NWS) is focused on forecasting and monitoring wildfire potential and growth (i.e., Fort McMurray wildfires) during the daytime and nighttime. NWS forecasters can monitor wildfires utilizing visible imagery from satellite during the day however, monitoring wildfires during the night can become cumbersome. To assist NWS forecasters during the nighttime, polar-orbiting satellite data from the Suomi National Polar-orbiting Partnership (Suomi-NPP) satellite is considered. On-board the Suomi-NPP is the Visible Infrared Imaging Radiometer Suite (VIIRS) instrument that consists of 22 spectral channels, where one of those channels is the Day-Night Band (DNB).
The DNB provides the capability of observing night-time light emissions (e.g. wildfires) and atmospheric features across the globe and monitors the global distribution of clouds (Miller et al 2014). DNB has the ability to detect broad ranges of light intensities ranging from full sunlight during the daytime to faint atmospheric glow on moonless nights (8 orders of magnitude in radiance space). The broad range leads to difficulties in displaying an images without losing detail at either end of the radiance scale. Near-Constant Contrast (NCC) was developed to mitigate the enhancement issues utilizing a sun/moon model to convert DNB radiance values into a reflectance-like value. In short, the NCC is a derived product of the DNB.
Currently, NCC is available for NWS forecasters in the Advanced Weather Interactive Processing System-II (AWIPS-II); a weather forecasting display and analysis package. To access NCC data in AWIPS-II refer to Figure 1 below.
Figure 1: Screenshot of the AWIPS-II interface, where users can access NCC data under the ‘Satellite’ tab.
For the interested reader, a link to the Quick Guide for Imagery Enhancement involving NCC in AWIPS-II can be found below.
ftp://rammftp.cira.colostate.edu/torres/Quick_Guide/VIIRS_NCC_Quick_Guide_Dec2015.pdf
Furthermore, to highlight the capabilities of the NCC we will take a closer look at the Fort McMurray wildfires. Displayed screenshots of NCC imagery were taken before the fire and during the fire shown in Figures 2-4. Emitted light sources from the active fires, city lights, gas flares, and also atmospheric features such as clouds and smoke are seen in the satellite imagery.
NCC Imagery Before the Fire
Figure 2: NCC imagery was taken a week in a half before the initiation of the Fort McMurray fires at 1013Z, 18 April 2016. Note the city lights of Fort McMurray, the gas flares from Tar Island, and the clouds in the vicinity.
NCC Imagery of Fort McMurray Wildfire – 17 May at 0930 UTC
Figure 3: NCC imagery taken during the Fort McMurray fires at 0930Z, 17 May 2016. One can see the emitted light from the fires and fire perimeter line that is forming.
NCC Imagery of Fort McMurray Wildfire – 18 May at 0915 UTC
Figure 4: NCC imagery taken during the Fort McMurray fires at 0915Z, 18 May 2016. Note the active fires along the fire perimeter line and the large amount of smoke produced.
Lastly, a comparison was conducted between the estimated fire perimeter and NCC imagery for 17 May 2016 (Figure 5). Both images show relatively similar shape and size of the fire perimeter line. It is important to note the time stamps for each image in the comparison is offset by a few hours, however, the polygonal shape of the fire perimeter is still apparent.
 Figure 5: The comparison between the estimated fire perimeter and NCC imagery for 17 May 2016. A polygonal shape of the active fire line perimeter is evident in both images.


