1-minute applications for severe thunderstorms from 15-16 April 2017
The GOES-16 data posted on this page are preliminary, non-operational data and are undergoing testing. Users bear all responsibility for inspecting the data prior to use and for the manner in which the data are utilized.
During the afternoon hours of 15 April, one of the GOES-16 mesoscale sectors captured severe thunderstorms in the Iowa / Nebraska region:
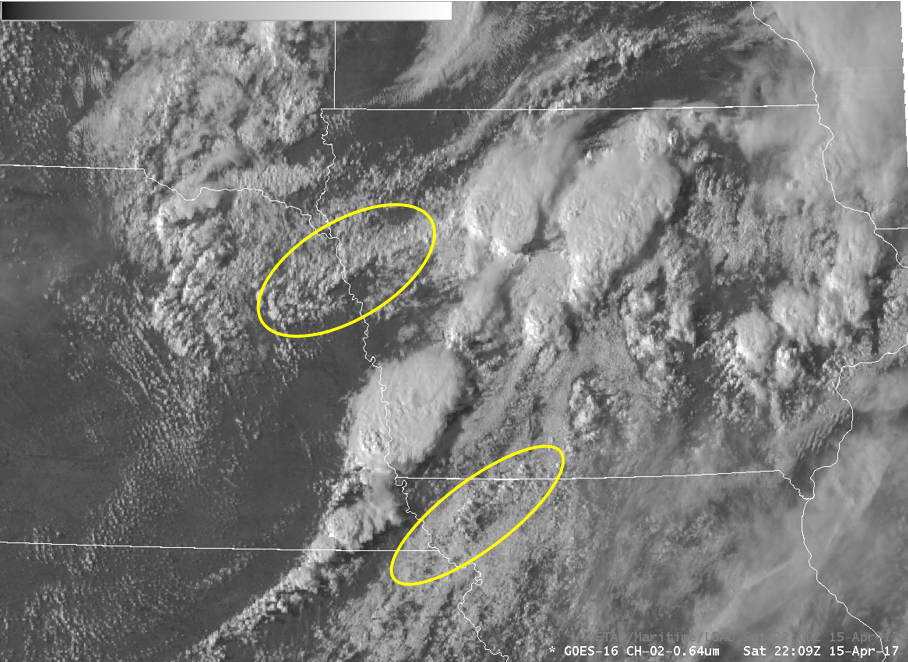
Often times we like to point out the use of 1-minute imagery for the evolution of severe thunderstorms. However, the imagery also has utility to identify regions where the potential for thunderstorm development is suppressed which can be an important operational application. In this particular case, notice the highlighted yellow regions at 2209 UTC:
Focus on those regions in the animation above. Note that thunderstorm development is suppressed in these regions. The 1-minute imagery actually helps you identify these regions with more clarity than current GOES due to the increased temporal and spatial resolution. We might not always be able to understand why suppression is occurring. In this case, just considering the surface observations:
for the southern region of interest, although there is cloud cover, the temperature and moisture does not appear unfavorable for thunderstorm development, however the imagery shows that any attempts at convective initiation are being suppressed by something in the environment. Meanwhile, in the northern region of interest there is nothing apparent in the METARs that would suggest suppression, however GOES-16 imagery clearly indicates that something in the environment is unfavorable for convective development. In operations, GOES-16 imagery could be integrated with model analyses, surface observations and other observational data to try to understand why the imagery shows what it does.
On the following day, another round of severe thunderstorms took place this time in Oklahoma and the Texas panhandle. We’ll start with a loop of the IR band at 10.35 microns at 5 minute temporal resolution:
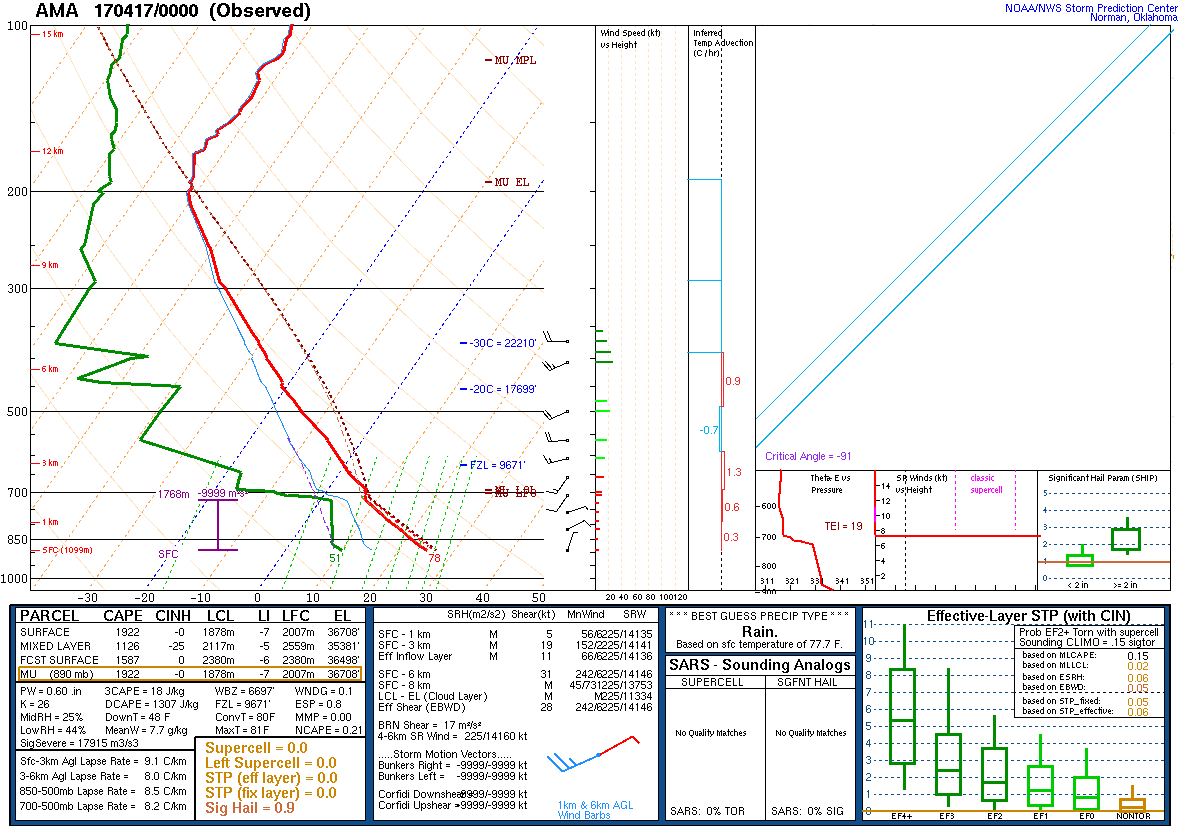
We observe a number of thunderstorms across the scene; the storm in southern Oklahoma has an enhanced-V signature as well as multiple gravity waves and is backbuilding southwestward for a while. We see other thunderstorms in the scene as well, however lets focus in on the eastern Texas panhandle activity. We see a westward moving boundary with low-clouds to its east and clear to the west. The northern part of this boundary leads to a triple point with an outflow boundary oriented east-west. It’s interesting to note that convective initiation occurs first south of the triple point and then later new convection develops at the triple point. The initial storm that developed along the westward moving boundary south of the triple point develops an enhanced-V signature and in fact severe hail was observed with this storm. Also note that this storm is moving southwestward in time as it backbuilds along the boundary against the mean west-southwest flow aloft shown in the 0000 UTC Amarillo, TX sounding:
Are there are any indications in the GOES-16 imagery to explain why the storm of interest along the boundary developed?
A 4 panel animation of the visible along with the 3 water vapor bands:
The visible band indicates what might be a gravity wave advancing east-southeast across the northeastern portion of the Texas panhandle (also shown in a subtle sense in the earlier IR loop). The storm seems to initiate coincident with the passage of this feature across the boundary. We include the 3 water vapor channels in an attempt to further identify this feature or any other feature that would not appear in the visible band. The most obvious feature (at least in the mid-level WV band) appears later in the loop and is a north-south oriented brightness temperature gradient moving eastward, perhaps this is an approaching shortwave. However, this comes after convective initiation for the storm noted above. For this case, it’s difficult to definitely attribute convective initiation to any signature from the water vapor imagery, although a 4 panel like this may help in other cases.
Shortly thereafter, this region was in a mesoscale sector with 1-minute imagery, here is a loop with METARs included:
One point to note is that this was not a classic dryline with very dry westerlies behind it, rather the winds here are easterly and the moisture gradient is more subtle. We do eventually see a storm initiate along the triple point discussed earlier north of the storm of interest.


