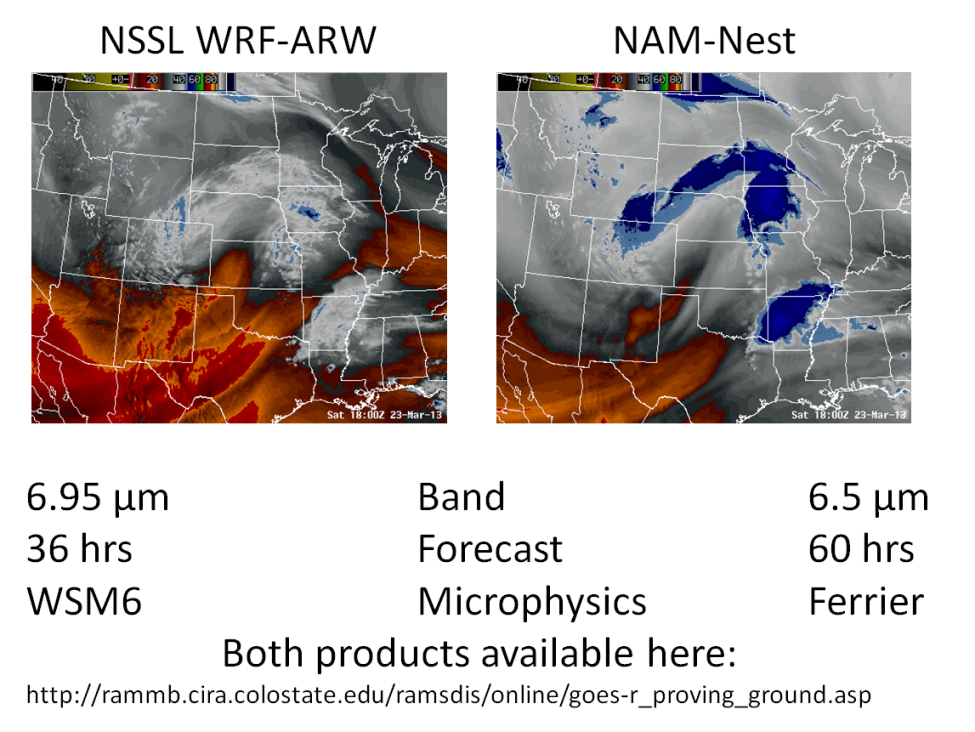
Synthetic imagery comparison from 2 different models
This blog entry will make a comparison between synthetic imagery generated from 2 different models, the NSSL WRF-ARW and the NAM-Nest, both with a horizontal grid spacing of 4 km. After comparing the synthetic imagery between the 2 models, we will compare them to the observed GOES imagery.
The major differences between the 2 models when considering synthetic imagery interpretation can be summarized with an example of an extra-tropical cyclone on 23 March 2013
The first thing to keep in mind is that since these are 2 different models, the forecasts will not be identical, the images in the example above are an 18 hour forecast. For the synthetic imagery from the NSSL WRF-ARW model, the bands being simulated are those that will be available on GOES-R, whereas the synthetic imagery from the NAM-Nest are the bands on the current GOES operational satellites. For the water vapor imagery, you can see that there is a substantial difference in the wavelength of the band being simulated (6.95 vs 6.5 microns). 6.95 microns has a weighting function that peaks lower in the atmosphere than 6.5 microns, this means the brightness temperatures will be warmer at 6.95 microns than at 6.5 microns. For most operational applications, (i.e., identifying troughs/ridges, shortwaves, jet streaks etc.) this warm bias has no impact on interpretation of the signature of interest for comparison between model forecast and GOES imagery. For the IR imagery, the difference is much less (10.35 microns for the WRF-ARW and 10.7 microns for the NAM-Nest), therefore the warm brightness temperature bias will not be present in the IR imagery. The other important contribution to the difference in the appearance of clouds between the 2 models is the microphysics package being used. They are different, which means the appearance of the clouds can be different due to this factor.
Consider the synthetic water vapor imagery from the 2 models (left is WRF-ARW, right is NAM-Nest) for a day with convection across the Plains, both initialized at 0000 UTC 29 March 2013:
Concentrate on synoptic / mesoscale features of interest rather than the difference in brightness temperature that is primarily due to the difference in the wavelengths of the bands being simulated. Can you see any shortwaves that appear to play a role in convective initiation? Are the shortwaves easier to identify in one model vs another? There is a difference in the appearance of the afternoon thunderstorms forecast to develop in the Plains which we will discuss in more detail when analyzing the synthetic IR imagery.
Next, let’s compare the synthetic water vapor imagery from the NSSL WRF-ARW (left) with the GOES imagery (right, at the corresponding times, hourly):
Compare any shortwaves / jet streaks between the model forecast and GOES imagery. Note the discrepancies between the way the imagery appears from GOES versus that from the model. Finally, evaluate how the model did in terms of forecast location / timing of these features.
Next, let’s compare the synthetic water vapor imagery from the NAM-Nest (left) with the GOES imagery (right, at the corresponding times, hourly):
Compare any shortwaves / jet streaks between the model forecast and GOES imagery. Note the discrepancies between the way the imagery appears from GOES versus that from the model. Finally, evaluate how the model did in terms of forecast location / timing of these features.
Now let’s consider the IR imagery, as before we will compare the appearance of the synthetic IR imagery between the WRF-ARW (left) and NAM-Nest (right) first:
Compare the difference in the appearance of forecast thunderstorms between the 2 models. Which of the models has smaller anvil cirrus? Compare the appearance of “non-convective” clouds (clouds that aren’t associated with thunderstorms).
Now compare the GOES imagery (right) with the synthetic IR imagery from the NSSL WRF-ARW (left):
and the synthetic IR imagery from the NAM-Nest (left):
For this case, which of the models represented the anvil cirrus more accurately? Which of the models did a better job with the timing / location of afternoon thunderstorms?
For reference, here are the SPC storm reports for that day:
http://www.spc.noaa.gov/climo/reports/130329_rpts.html
Synthetic IR imagery can be quite useful in forecasting where clouds may inhibit daytime heating and thus surface temperature. Which of the models appeared to do a better job with the cloud cover forecast on this day? How early (in the loop) did you have more confidence in one model versus the other when comparing the synthetic imagery with the GOES imagery?
Real-time imagery synthetic imagery from both models can be found here:
Training can be found here:
http://rammb.cira.colostate.edu/training/visit/training_sessions/
