Hawaii, Up Close and Personal
Jeff Braun
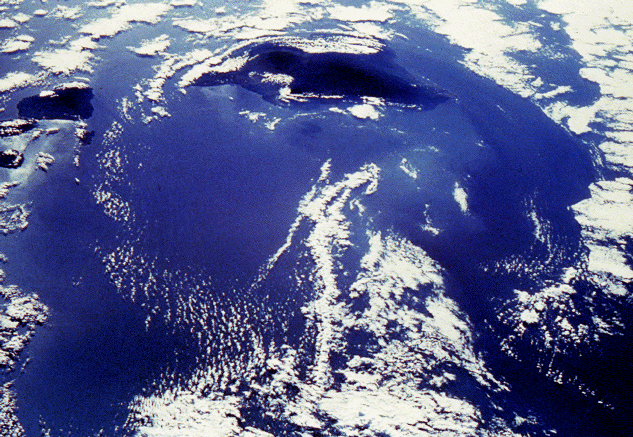
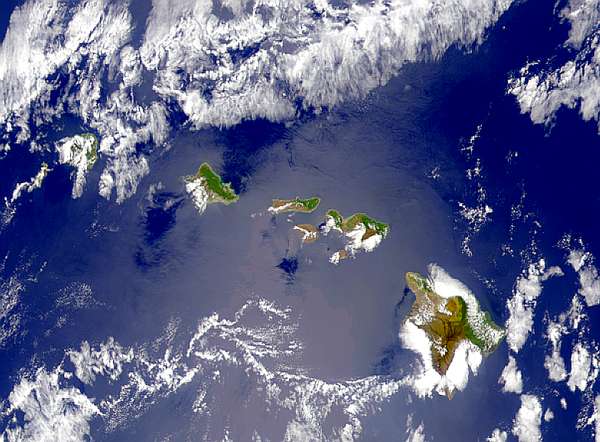
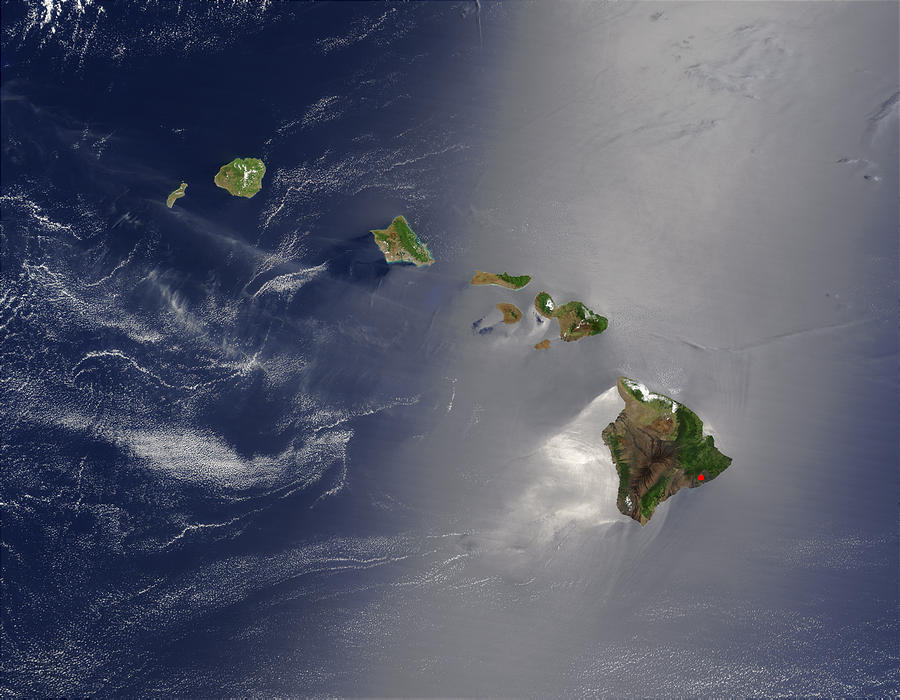
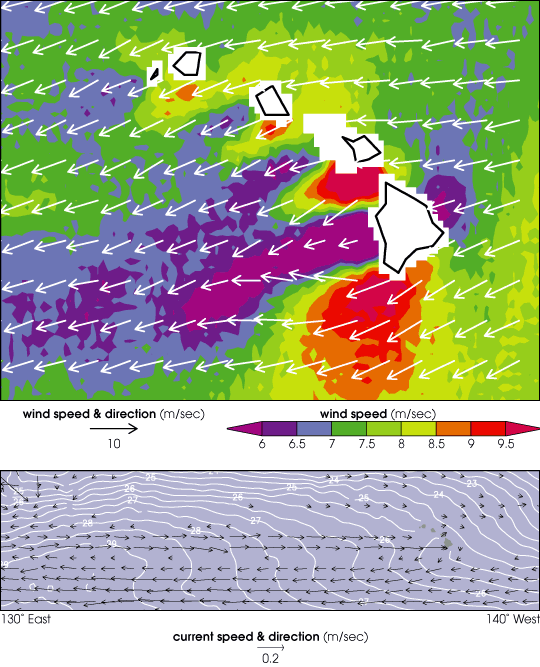
Look at the following three images from the TERRA (EOS AM-1) satellite and the plotted image from the QuickSCAT satellite (courtesy NASA TERRA project – http://terra.nasa.gov/) and try to determine: 1. What is going on around the Big Island (first photo – top)? 2. Which side of the islands tend to get more precipitation and how can you tell and why? 3. Generally, from which direction does the prevailing (low level) wind blow (second and third photos)? 4. Where the convergence zones (boundaries) lie and why (first, second and third photos)? 5. Why the “silvery” look to the ocean surrounding the islands (second and third photos)? 6. Why/how do you get the accelerations around the outside of and between the islands (plotted image four – bottom) and how/why do these lead to convergence between?


