10 June 2013 Colorado Dry Microburst
By Ken Pryor (NESDIS), Dan Bikos (CIRA) and Scott Lindstrom (CIMSS)
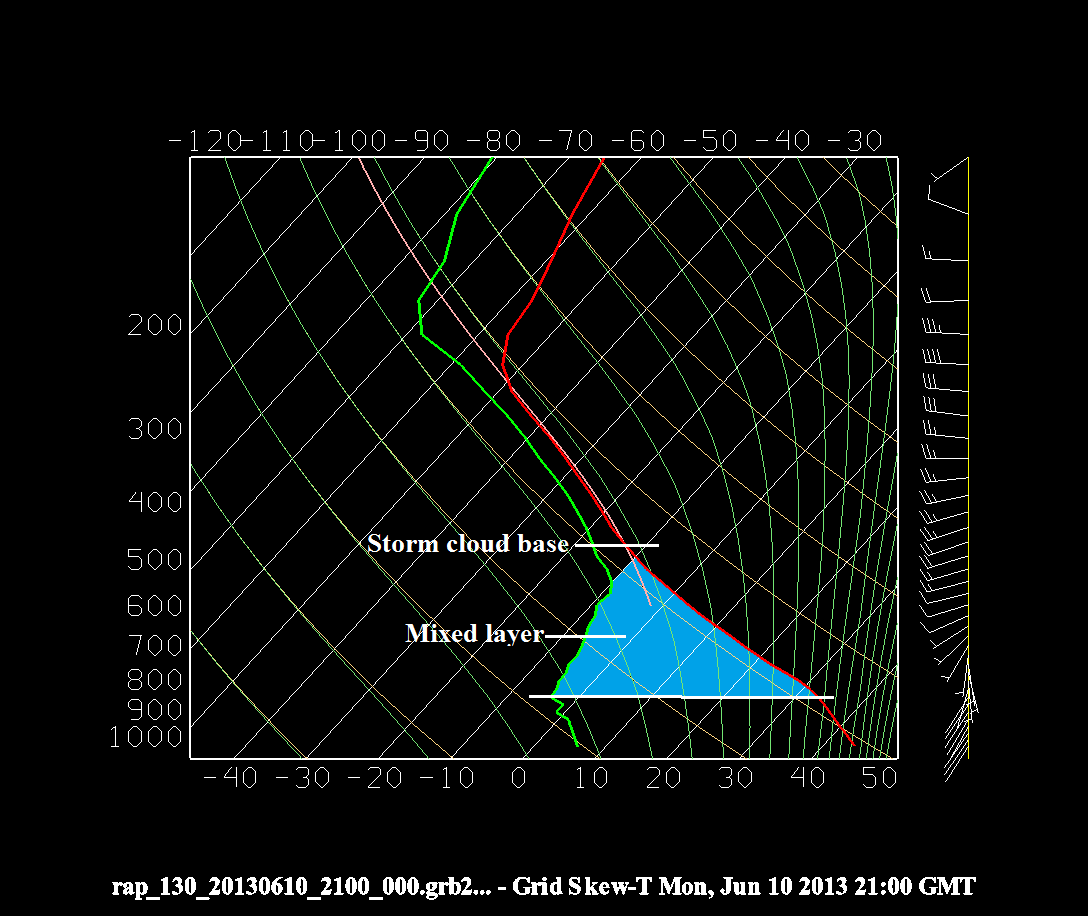
During the early afternoon of 10 June 2013, a cluster of convective storms developed over the front range of the Rocky Mountains of Colorado and then tracked eastward over the western High Plains, south and east of Denver. These storms were shallow, with bases near 20,000 feet and echo tops of only 30,000 to 35,000 feet AGL, and produced only light precipitation. By mid-afternoon (2100 UTC), the storm cluster tracked into a region with a deep, unstable mixed layer below the 500-mb level as illustrated in the Rapid Refresh (RAP) model analysis sounding profile over Parker, Colorado shown below:

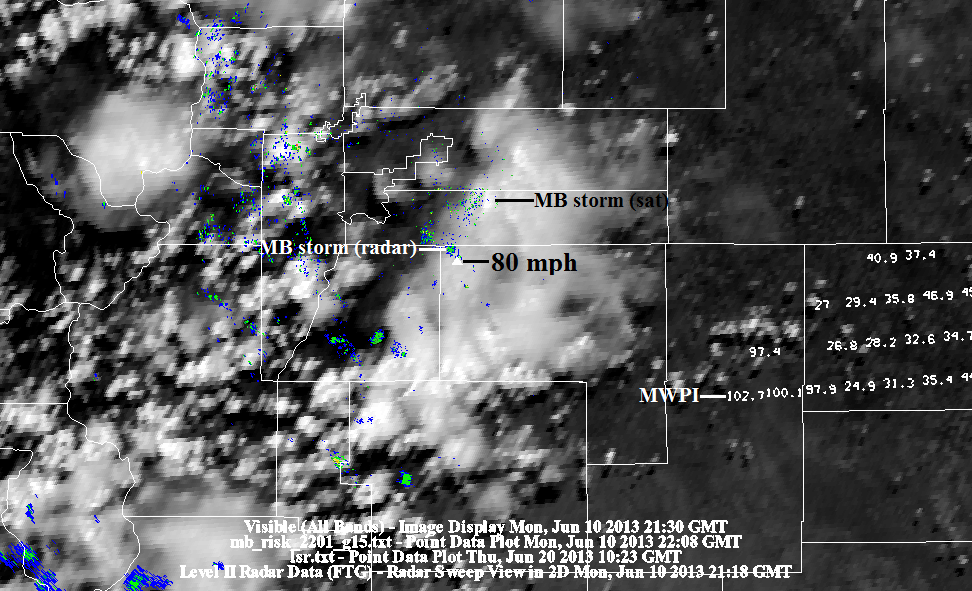
At 2120 UTC, a microburst with an 80-mph (70-knot) wind gust was observed 10 miles east of Parker, or 25 miles southeast of Denver (see SPC event summary). A GOES sounding processing outage from 1800 to 2100 UTC precluded the generation of the MWPI product prior to the microburst, however, the next available sounder scan at 2200 UTC, indicated excessively high Microburst Windspeed Potential Index (MWPI) values to the east of the storm cluster, over Lincoln County.

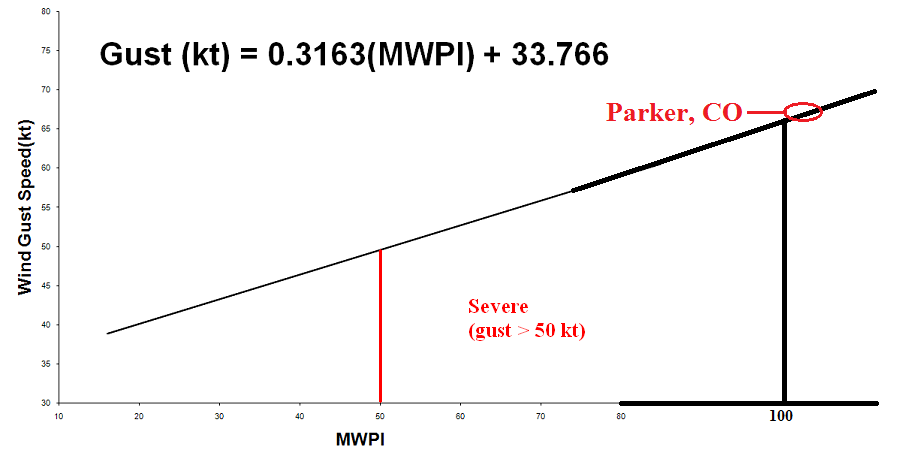
As seen in the GOES-15 MWPI/NEXRAD composite product image above, the 80-mph microburst wind observation originated from a cell that appeared to be weak, with radar reflectivity of only 25 to 30 dBZ. The displacement between the microburst (MB) storm as located by radar and by GOES-15 results from the viewing angle of the satellite. For this case, the MWPI was calculated using the lapse rate and dew point depression difference between the 500 and 700-mb levels. The closest representative MWPI values over Lincoln County were as high as 103 (102.7), and reflected a highly favorable environment for microbursts as characterized by the sounding profile above, with a large sub-cloud temperature lapse rate and vertical relative humidity gradient. MWPI values over 100 are rarely observed and are correlated to wind gust potential of 65 to 70 knots (75 to 80 mph) as shown by the regression chart below, adapted to the environment in the vicinity of Parker:

The GOES Microburst product(s) in this event played a very important role because it showed the risk for dry microburst(s) in a more substantial way than being detected on satellite or radar imagery.
GOES visible imagery (Parker, CO indicated by yellow pixel):
showed what would be considered “weak” convection from a satellite perspective.
Also, the 0.5 degree tilt radar reflectivity from the nearby WSR-88D at KFTG showed only a weak signature for this storm due to the lack of precipitation:
The 0.5 degree tilt velocity data did show a subtle signature with an increase of winds (to 30 to 45 kts) near the time of the wind report:
Given the subtle radar and satellite imagery signatures for dry microburst events such as this, one can readily see the utility of GOES microburst products to assess the potential for such events ahead of time. Real-time GOES microburst products can be viewed here:
