NOAA-21 VIIRS NCC Imagery Available in AWIPS via SBN
August 21st, 2023 by Jorel TorresThis summer 2023, NOAA-21 VIIRS Near-Constant Contrast (NCC) imagery has become available for National Weather Service (NWS) users to access in the Advanced Weather Interactive Processing System – II (AWIPS-II) via the Satellite Broadcast Network (SBN). With the addition of NOAA-21 VIIRS NCC, users can now access the nighttime visible imagery from three JPSS polar-orbiting satellites: Suomi-National Polar-orbiting Partnership (S-NPP), NOAA-20 and NOAA-21.
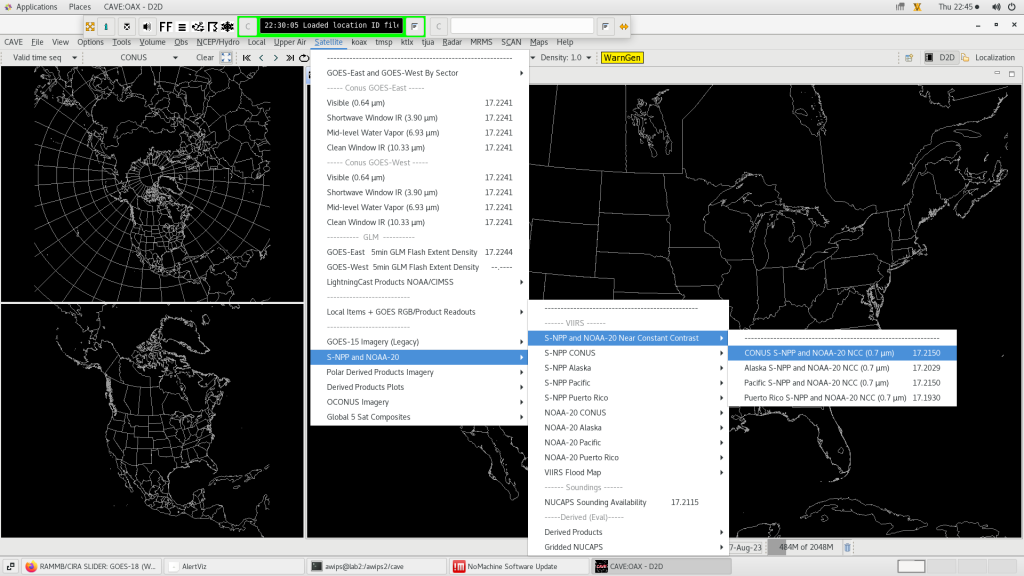
Refer to the screenshot below that shows how users can access CONUS VIIRS NCC imagery from all three satellites in AWIPS-II. In AWIPS, simply click on the ‘Satellite’ tab, scroll down to ‘SNPP and NOAA-20’, then to ‘S-NPP and NOAA-20 Near Constant Contrast’, and select ‘CONUS S-NPP and NOAA-20 NCC (0.7 um)’. Be aware that the AWIPS menu entries are not updated with the NOAA-21 VIIRS NCC menus. The current menu configurations are planned to be updated in the next TOWR-S RPM release, v24, tentatively scheduled for later this fall (~October 2023). However, users can update the NOAA-21 menu entries manually from the TOWR-S instructions that are described here. The instructions also provide details on how to fix an overlap issue that may be seen between VIIRS satellite swaths. Note, per TOWR-S, the current menu configuration may not be applicable for other regions (e.g., Alaska sector) who receive VIIRS imagery from Direct Broadcast (DB).
The animation below displays the VIIRS NCC imagery from all 3 satellites over CONUS during the overnight hours on 17 August 2023. The imagery is shown during the new moon phase of the lunar cycle. Notice how NOAA-21 VIIRS NCC imagery is placed in between NOAA-20 and SNPP VIIRS NCC imagery by 1/4 orbit (~25 minutes apart).
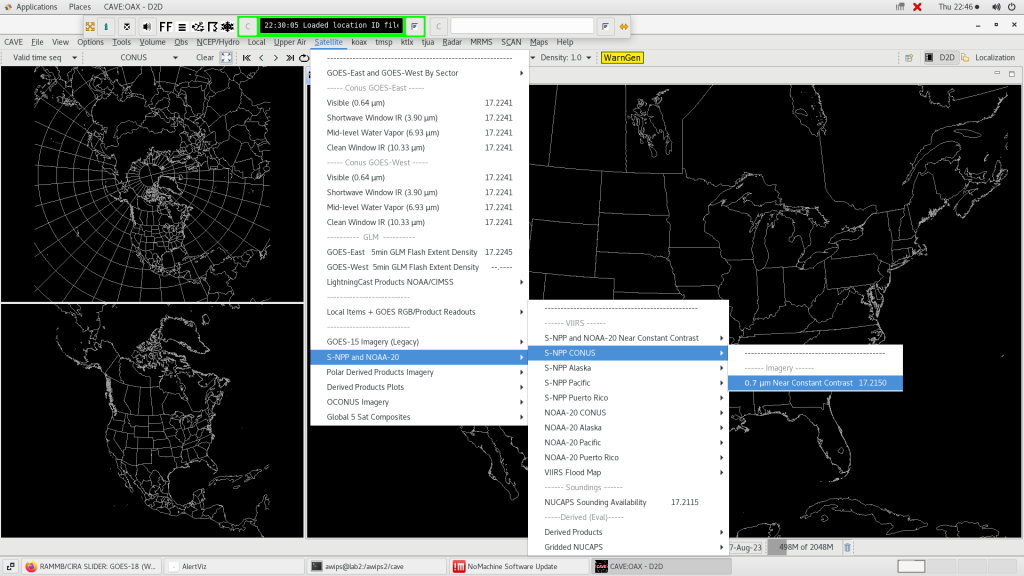
Over the CONUS sector, there is an additional way to access NOAA-21 VIIRS NCC imagery in the AWIPS menu. Users can click on the Satellite tab, scroll down to ‘SNPP and NOAA-20’, then to ‘S-NPP CONUS’ and select ‘0.7 um Near Constant Contrast’ (see the image below). For now, SNPP and NOAA-21 VIIRS imagery can be accessed here as well, however, the menu configurations will be updated in the future by TOWR-S RPM v24.
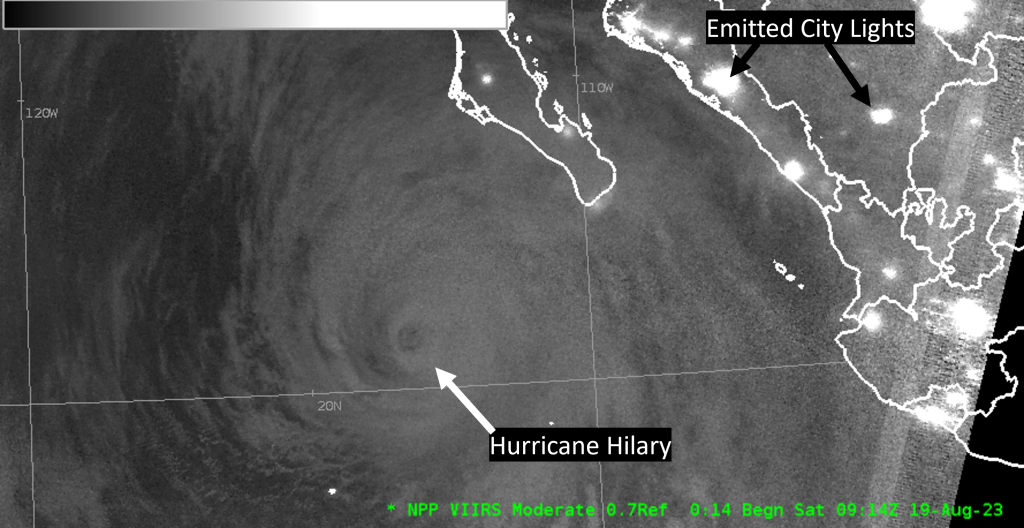
An AWIPS VIIRS NCC example from NOAA-21 observes the eye and areal extent of Hurricane Hilary. At ~0914Z, 19 August 2023, the hurricane was located southwest of the Baja California Peninsula. The hurricane proceeded to move into Southern California the next day and produced significant precipitation totals over the region.
Posted in: AWIPS, Miscellaneous, POES, Satellites, VIIRS, | Comments closed
When can users expect JPSS Data over CONUS?
August 3rd, 2023 by Jorel TorresThe Joint Polar Satellite System (JPSS) constellation consists of 5 satellites: SNPP, NOAA-20, NOAA-21, and the upcoming JPSS-3 and JPSS-4 satellites that will launch within the next decade. Focusing on the three active satellites, the current JPSS orbital configuration has NOAA-20 and SNPP at a 1/2 orbit apart (or ~50-minutes apart) where NOAA-21 is placed 1/4 orbit between the two.
Now this orbital configuration (see the image below) will change once NOAA-21 is designated as the primary satellite later this year. Users can look forward to a future blog entry on that topic.

With the current orbital configuration, how does it translate to when users can expect JPSS data over CONUS? Typically over the lower-48, at any one location, users can expect 3 to 5 overpasses during the overnight hours from approximately 05 to 12Z. During the daytime, 3 to 5 overpasses are expected between ~16-22Z over CONUS.
A nighttime and daytime animation are shown below that highlight JPSS Visible Infrared Imaging Radiometer Suite (VIIRS) swaths over CONUS on 30 July 2023.
Nighttime: 05-12Z, 30 July 2023 – VIIRS swaths from the 11.45 um (I-5 band).
Daytime: 16-22Z, 30 July 2023 – VIIRS GeoColor imagery.
Users should also be aware of the orbital sequence of the satellites. The sequence starts with a NOAA-20 satellite overpass, then a NOAA-21 overpass ~25-minutes later, and then a SNPP overpass ~25 minutes after that. Then there is a 50-minute gap, which then the sequence starts again with another satellite overpass from NOAA-20. Note, this sequence continues as the polar-orbiting satellites move from east to west across CONUS. A VIIRS GeoColor daytime animation (see below) highlights the satellite sequence across CONUS on 19 July 2023.
Additionally, users can identify JPSS orbit tracks (i.e., from near-real-time or archived data) via the Space Science and Engineering Center (SSEC) at the University of Wisconsin polar orbit tracks website. Users can access orbit tracks from SNPP, NOAA-20, and NOAA-21 and can be viewed in a global domain or via regional sector. The length of the archives depends on the satellite. For example, SNPP will have the longest archive, since it is the oldest satellite within the JPSS constellation and contains an archive since 2011. JPSS orbit tracks can be accessed via the NASA SPoRT Viewer webpage as well.
Posted in: Data Access, Miscellaneous, POES, Satellites, VIIRS, | Comments closed
The VIIRS Flood Map Product
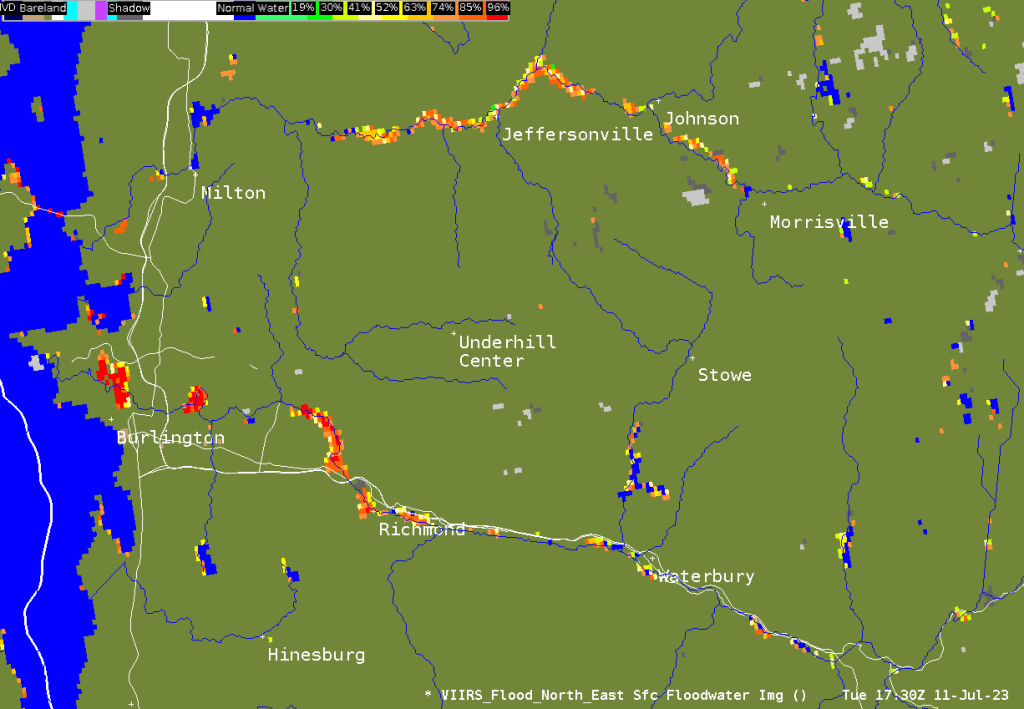
July 12th, 2023 by Jorel TorresNeed a new satellite product to observe flooding? Look no further than the VIIRS Flood Map product. The VIIRS Flood Map calculates the flood extent of a 375-m pixel (i.e., known as the floodwater fraction percentage from 0 to 100%, displayed in green-to-red colors). The product also differentiates between scene types (e.g., cloud cover, bare land, snow cover, vegetation). Currently, the product is only available during the daytime, and employs VIIRS imagery band data from the Suomi-National Polar-orbiting Partnership (SNPP) and the NOAA-20 satellites.
Users can access the product online: near-real-time flood data via RealEarth, data over Alaska via GINA, and a NOAA Satellite Proving Ground Global Flood Products Archive. National Weather Service (NWS) users can access the product online and via the Advanced Weather Interactive Processing System – II (AWIPS-II).
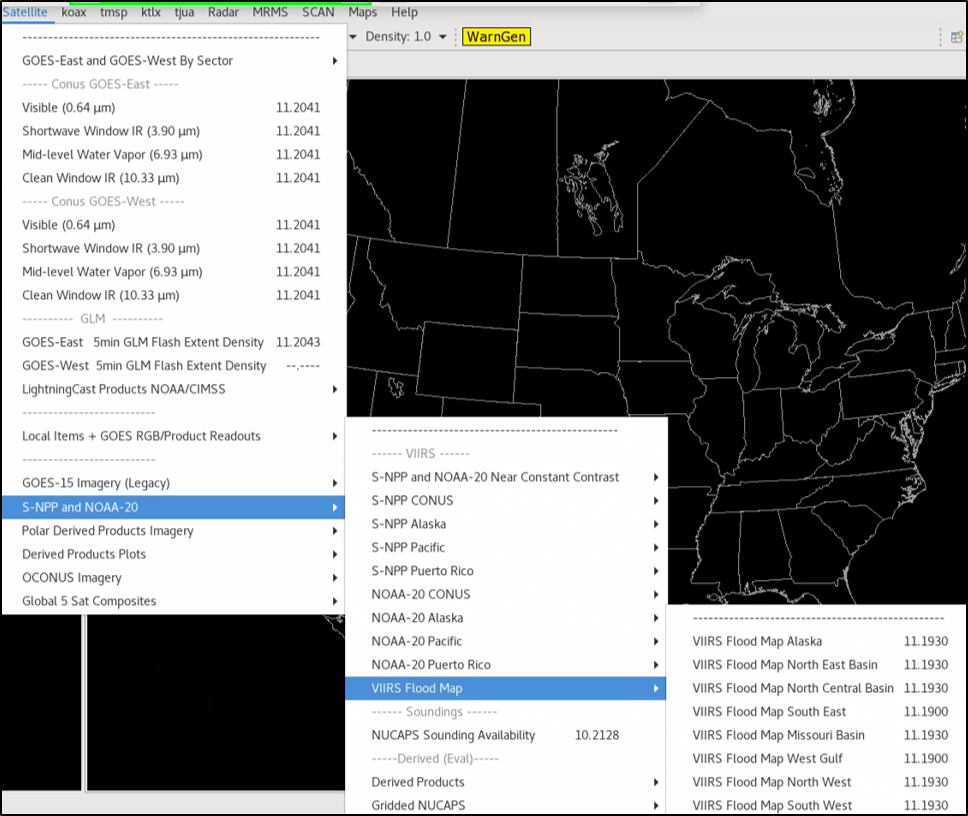
Note, in AWIPS-II, users can choose between 8 regional sectors to access the VIIRS Flood Map: 7 CONUS regions and 1 Alaska region. Under the AWIPS Satellite menu, users can scroll down and click on ‘S-NPP and NOAA-20’, then ‘VIIRS Flood Map’, and can select the domain of interest. Refer to the AWIPS screenshot below.
A VIIRS Flood Map example (see below) from the ‘North East Basin’ sector shows the recent flooding that transpired over the state of Vermont. The northeast United States received significant precipitation over the past few days (over 9 inches in Vermont) that led to flooding in a few states. Notice the inundation along Interstate 89 between Burlington, VT and Waterbury, VT.
Posted in: AWIPS, Data Access, Heavy Rain and Flooding Issues, POES, Satellites, VIIRS, | Comments closed
Smoky in the Northeast U.S.
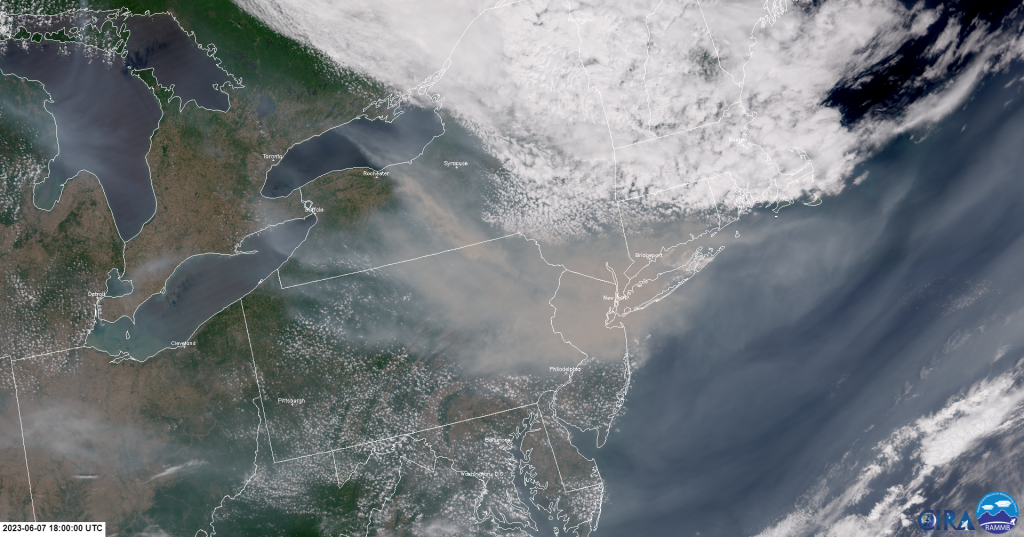
June 9th, 2023 by Jorel TorresOver the past week, the northeastern United States was inundated with smoke that was produced from fires raging in the Canadian province of Quebec. On the backside (i.e., west side) of a lingering upper-level low, wildfire smoke transported hundreds of miles southward and southeastward toward the northeastern U.S. New York City, NY, along with other cities in the northeast, were significantly impacted by high smoke concentrations near the surface. On 7 June 2023, a recorded timelapse showed the smoke reducing the visibility of the New York City skyline. Even professional sports games were rescheduled and airline flights were grounded due to the smoke and poor air quality that spread across the region.
The VIIRS GeoColor, a product that is quite useful for aerosol detection applications can be seen below. The product animation shows the smoke transport from Quebec to the northeast U.S. and consists of daytime overpasses from NOAA-20, NOAA-21, and SNPP VIIRS from 5-7 June 2023. Users will notice the smoke from numerous fires in Quebec that travels southward across southern Canada, the Great Lakes, the northeast U.S., and eventually over the North Atlantic Ocean. If users look closely, a few smoke plumes can be seen over southeastern Ontario as well.
Zoomed-in on the northeast U.S., the NOAA-20 VIIRS GeoColor observes the thick smoke offshore and across the states of New Jersey, Pennsylvania, New York and Connecticut on 7 June 2023 at ~18Z. See the image below.
Thanks to the newly released CIRA JPSS CONUS Sector, users can compare the smoke observations between the VIIRS GeoColor and the Advanced Baseline Imager (ABI) GeoColor at ~18Z, 7 June 2023. For users that are unaware, the ABI is an instrument onboard NOAA’s geostationary satellites, GOES-16 and GOES-18. Click the animation below, and notice the finer details of the smoke and clouds observed by VIIRS (~750-m spatial resolution at nadir) compared to the coarser ABI (~1-km at nadir). Users should keep in mind that the ‘actual resolutions’ of VIIRS and ABI vary across the VIIRS swaths and the ABI domains: their spatial resolutions degrade as the satellite viewing angle becomes larger. With oblique (i.e., non-nadir) viewing angles, parallax is also an issue; users can read more about it, here from gina.alaska.edu and here from the Satellite Liaison Blog.
Posted in: Fire Weather, GOES, POES, Satellites, VIIRS, | Comments closed
Nova Scotia Fires
June 2nd, 2023 by Jorel TorresSo far in 2023, western Canada has been overwhelmed with wildfires and smoke, and within the last week new fires erupted in the eastern province of Nova Scotia. At the time of this blog entry, over 22,000 hectares (or 54,000+ acres) were burned in the province.
A VIIRS Day Fire RGB animation of the Nova Scotian fires, the fire extent and smoke can be observed at a high spatial resoluti0n of 375-m. Click on the video below. The animation includes VIIRS daytime overpasses from SNPP, NOAA-20 and NOAA-21 over the span of several days, 27 May through 1 June 2023. Notice how the fires rapidly move eastward over time. Corresponding smoke plumes are produced as well, where smoke advects over land and over the North Atlantic Ocean.
The VIIRS Active Fires product also observed the fire hotspots and fire intensities (i.e., Fire Radiative Power, FRP, expressed in MegaWatts, MW) on the afternoon of 1 June 2023. The quantitative product from NOAA-20 can be seen below, showing higher fire intensities (i.e., orange and dark orange colors) along the southern, eastern and northern flanks of the fires.

Note to Users: The VIIRS Day Fire RGB can be accessed online via CIRA JPSS SLIDER, while the VIIRS Active Fires product is accessible online via RealEarth.
Posted in: Data Access, Fire Weather, POES, Satellites, | Comments closed
