
ALPW analysis for the 21 August 2021 flood event in central Tennessee
August 25th, 2021 by Dan BikosBy Sheldon Kusselson and Dan Bikos
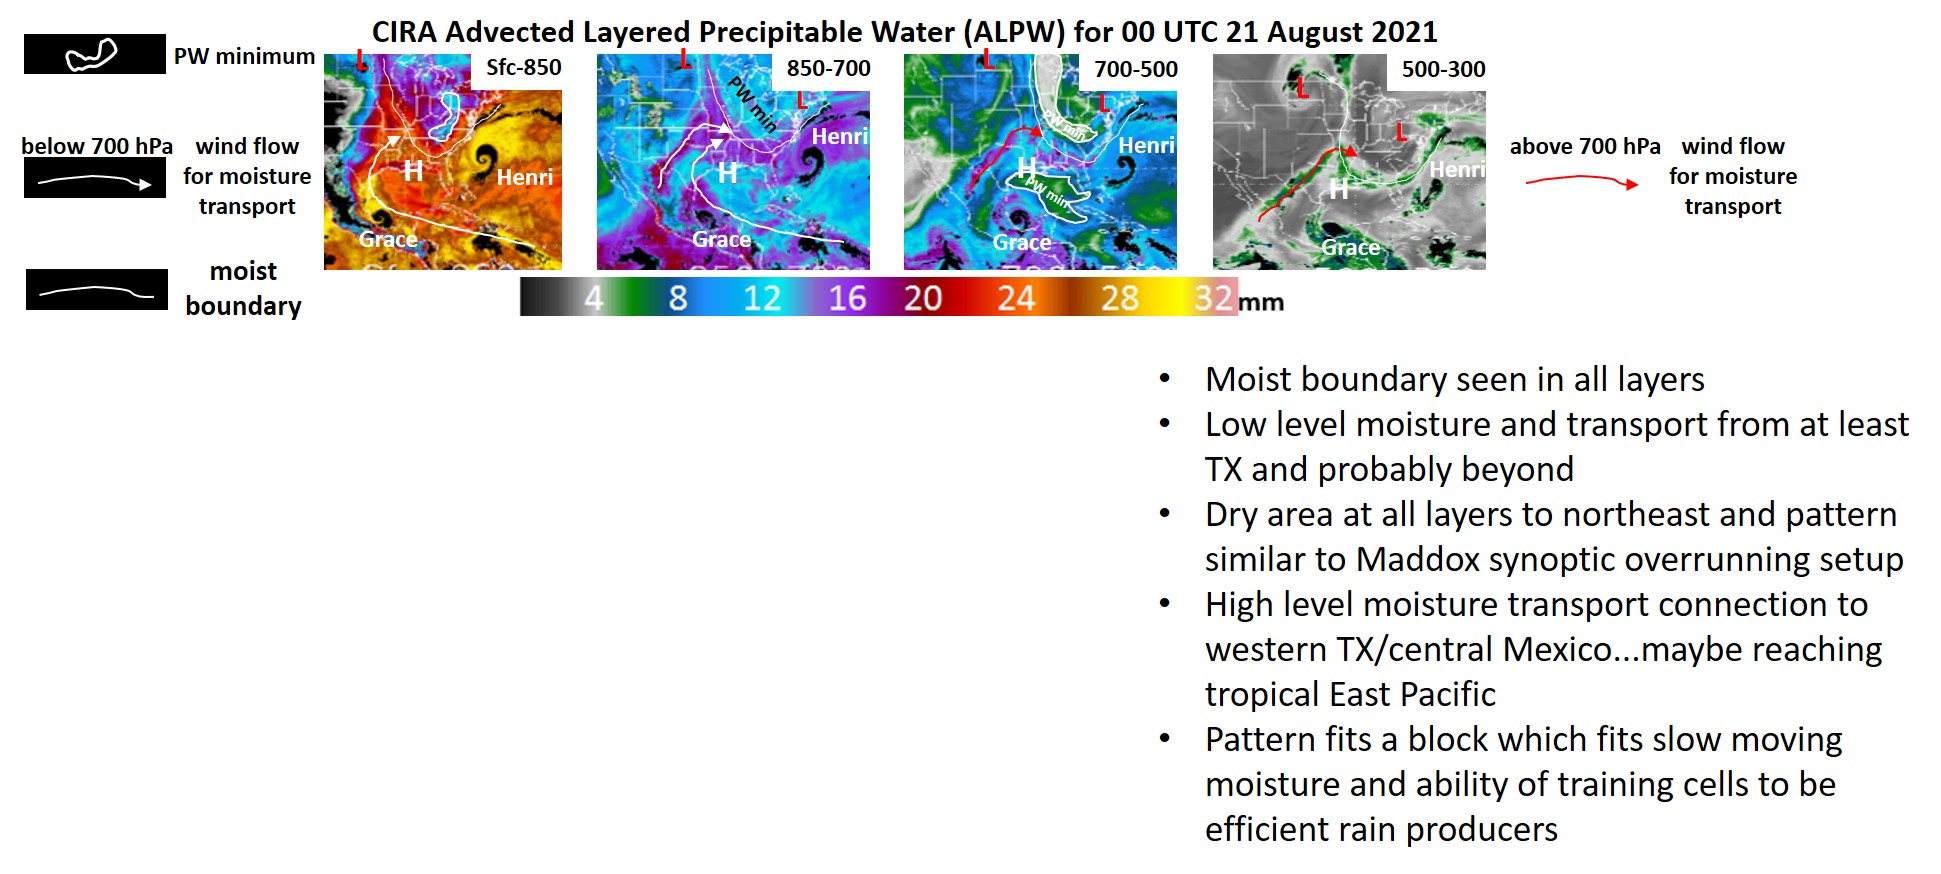
The following shows the Advected Layer Precipitable Water (ALPW) product just prior to the significant flood event in central Tennessee on 21 August 2021:
Posted in: Heavy Rain and Flooding Issues, | Comments closed
How far north can we see sun glint in GOES satellite imagery?
August 2nd, 2021 by Erin SandersBy Bernie Connell and Erin Sanders
Sun glint is an optical phenomenon that can be seen in visible and near-IR satellite imagery over water features such as ocean, lakes, and rivers. Its presence depends on the geometry between Sun, Earth, and satellite viewing angle. When sunlight is reflected off water features towards the satellite sensor at nearly equal angles, this type of reflection is called specular reflection.

How far north can we see sun glint? Sun glint is a common occurrence in the tropics and is typically seen in daytime satellite imagery between 30ºN and 30ºS. The following examples show sun glint at latitudes higher than 30ºN during northern hemisphere summer using visible imagery in the red part of the spectrum (0.64 μm). The first animation shows imagery from the GOES-17 satellite located at 137.2°W in the early hours between sunset and sunrise on July 21, 2021. From this perspective, a seasoned eye may discern the pattern of sun glint areas appearing to travel north and eastward with the changing angle of the sun.
GOES 17 – Arctic sunset and sunrise on July 21, 2021 from 8:30-10:30 UTC.
Let’s zoom in on a few of these regions and take a closer look. From this perspective the regions of sun glint are easier to spot. As the Sun, water surface, and satellite geometry changes, areas of brightness appear and then disappear in less than an hour.
GOES 17 – Arctic sunset on July 21, 2021 from 8:10-9:20 UTC.
These areas of sun glint indicate relatively calm waters with a smooth surface to reflect sunlight, much like a mirror. The increase in reflected solar energy that reaches the satellite sensor can saturate the image as seen by the bright white swaths. However, not all water surfaces reflect sunlight equally. Winds cause rougher water and waves that will scatter sunlight in multiple directions and appear darker, as less sunlight will be directed to the satellite sensor. Cloud cover will also obscure any water surface below. Both of these can lead to patchy areas of sun glint in satellite imagery. Can you differentiate between calm water, rough water, and cloud cover in the next two examples?
GOES 17 – Arctic sunrise on July 21, 2021 from 9:00-9:50 UTC.
GOES 17 – Arctic sunrise on July 21, 2021 from 9:20-10:20 UTC.
The following set of animations show sun glint detected by GOES-16 located at 75.2°W on July 26, 2021. We will again start with the full view from sunset to sunrise, and then focus on two examples.
GOES 16 – Arctic sunset and sunrise on July 26, 2021 from 3:30-6:30 UTC.
Zooming in over the Pacific Ocean off the western coast of the United States shows the contrast between the extensive bright glint area and darker surrounding areas of cloud. The sun glint can be seen well above 40ºN.
GOES 16 – Arctic sunset on July 26, 2021 from 3:30-4:20 UTC.
Sun glint highlights areas of calm water and can reveal details about the water surface and its reflective properties. In this next example, it also shows the ocean-land boundary with Greenland to the north. Sun glint appears on the water surface but not land, although land can certainly influence wind patterns over the water surface and affect how the light is reflected.
GOES 16 – Arctic sunrise on July 26, 2021 from 4:40-5:30 UTC.
So how far north can we see sun glint in GOES satellite imagery? It is clearly seen above 75ºN on this day! The latitudinal extent of where sun glint can be seen has a seasonal dependence. In the northern hemisphere it can be spotted between the vernal equinox (~20 March) and the autumnal equinox (~22 September). The summer solstice (~20 June) is when we would expect sun glint to be seen the farthest north of the equator based on the positioning of the Sun, Earth, and satellite.
Notice the unexpected.
Posted in: GOES, Satellites, | Comments closed
Flooding in Utah – 26 July 2021
July 29th, 2021 by Dan BikosBy Sheldon Kusselson and Dan Bikos
The North American monsoon has been in full swing during the summer of 2021, bringing much needed moisture to the Southwest.
At times though the abundant moisture has resulted in heavy rain and flash flood events.
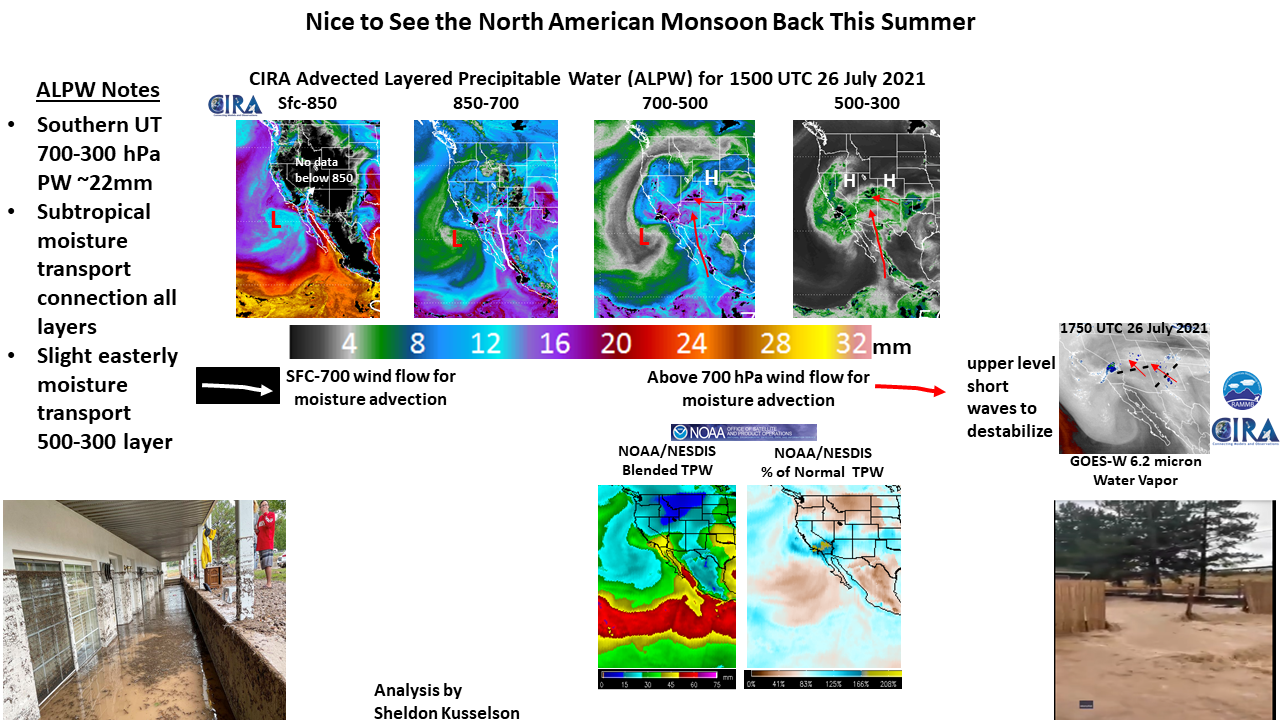
See the 4 panel Advected Layer Precipitable Water (ALPW) animation
Upper left: ALPW in the Surface to 850 mb layer
Upper right: ALPW in the 850 to 700 mb layer
Lower-left: ALPW in the 700-500 mb layer
Lower-right: ALPW in the 500-300 mb layer
When viewing this product in the west, keep in mind that data is missing over higher elevations. This effect is easily observed in the Surface to 850 mb layer, and even shows up in localized regions of the 850 to 700 mb layer. The 700-500 mb layer is very useful for the monsoon season with the typically high moisture values observed in mid-levels over regions of higher elevation. The relative maximum in moisture across southern Utah can be easily observed in this layer. The 500-300 mb layer can depicts regions of higher moisture at that level highlighting regions where the moisture is particularly deep which can enhance precipitation efficiency. Compare the animation with the slide above that denotes with arrows the direction moisture plumes are moving in the different layers. Source regions of moisture can be readily identified along with when these moisture layers become vertically aligned leading to a deep moist profile typically associated with excessive precipitation events.
See the 4 panel 700-500 mb ALPW, GOES-16 6.2 um water vapor band and 2 TPW products
Upper left: ALPW in the 850 to 700 mb layer
Upper right: GOES-16 6.2 um (upper-level) water vapor band
Lower-left: Blended TPW product (operational), (missing before 1400 UTC)
Lower-right: Merged (GOES + POES) TPW product (experimental)
Compare the animation of the water vapor imagery with the annotated water vapor image on the slide above that denotes short waves.
Compare the TPW products with the ALPW animation above, how do they complement and supplement each other?
Upper left: ALPW in the 850 to 700 mb layer
Upper right: MRMS composite reflectivity
Lower-left: GOES-16 IR (10.3 um)
Lower-right: GOES-16 upper-level water vapor (6.2 um)
Again, the water vapor imagery depicts the short wave.
Note how the ALPW seems to increase at certain times. If the increase is occurring over a large area, it is likely due to a new polar pass becoming available or a pass with a different sensor.
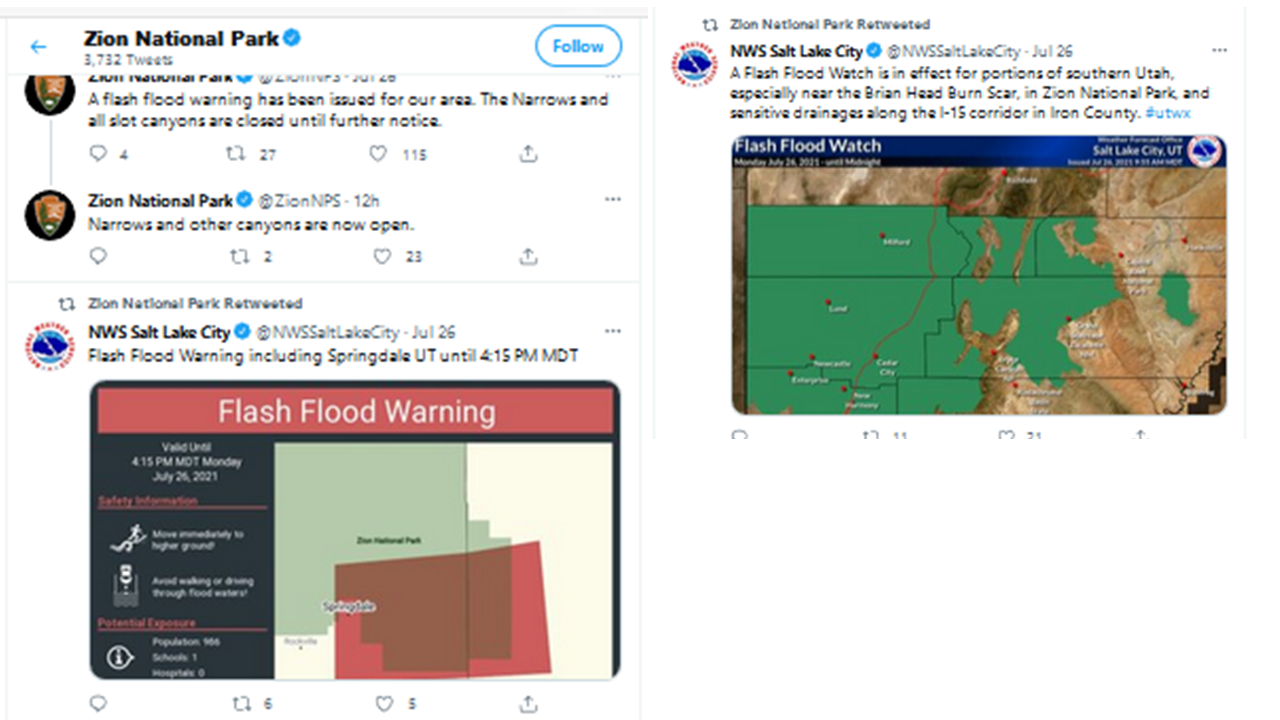
Detailed information on the flooding in southern Utah
Posted in: Heavy Rain and Flooding Issues, Hydrology, | Comments closed
30 November 2020 Severe Weather Event in the Mid-Atlantic
December 3rd, 2020 by Dan BikosBy Dan Bikos, Sheldon Kusselson and Jorel Torres
On 30 November 2020, a trough affected the Mid-Atlantic region and was responsible for the following severe weather reports:
In this blog post, we’ll examine aspects of the synoptic scale setup for this event.
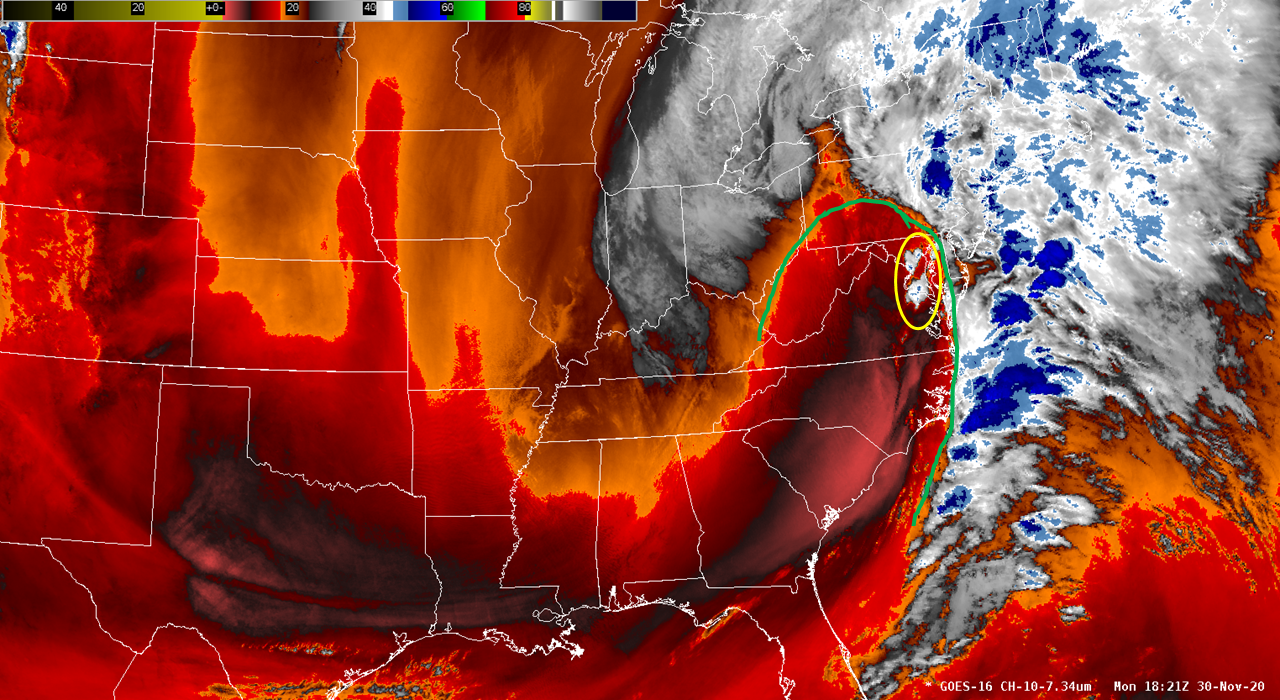
The following GOES-16 low-level water vapor (7.3 micron) animation:
depicts an extra-tropical cyclone moving northeastward. Thunderstorms developed in northeast Virginia around 1800 UTC and moved northeast across Maryland, Delaware, Pennsylvania and New Jersey. These thunderstorms appear to have developed at the nose of a dry slot apparent in the imagery as a region of warmer brightness temperatures. Click on the image below to see the thunderstorms of interest (yellow circle) and approximate boundary of the dry slot over the region of interest (green line):
 What role did the dry slot have on the thunderstorms?
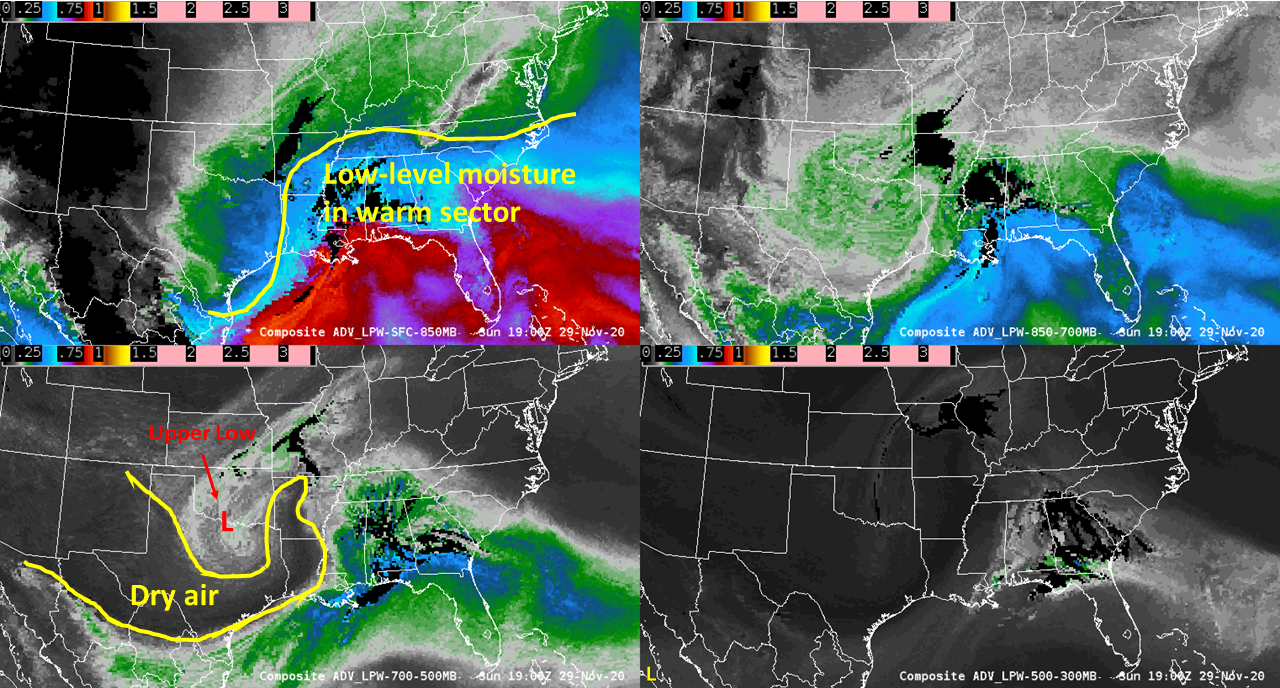
One of the more useful observational products to assess atmospheric water vapor in 4 dimensions is the Advected Layered Precipitable Water (ALPW) product which makes use of microwave instruments on several polar orbiting satellites. Water vapor is retrieved without the use of NWP output in the retrieval, short-term NWP output wind information is used only to advect the retrieved moisture fields. A loop of ALPW looks like this:
Upper-left panel: Surface to 850 mb Precipitable Water
Upper-right panel: 850 to 700 mb Precipitable Water
Lower-left panel: 700 to 500 mb Precipitable Water
Lower-right panel: 500 to 300 mb Precipitable Water
The loop goes back to 1800 UTC the previous day so that we may view how the moisture fields are changing in time. At low-levels, areas of higher moisture indicate the warm sector with moisture advection northward ahead of the developing cyclone. As we get higher into the atmosphere we see indications of the upper low in northern Texas / Oklahoma with drier air on its southern / southwest flank wrapping cyclonically around it on the eastern flank:
Subsidence within the dry slot would account for dry air at mid- to upper levels, but are there other sources of dry air?
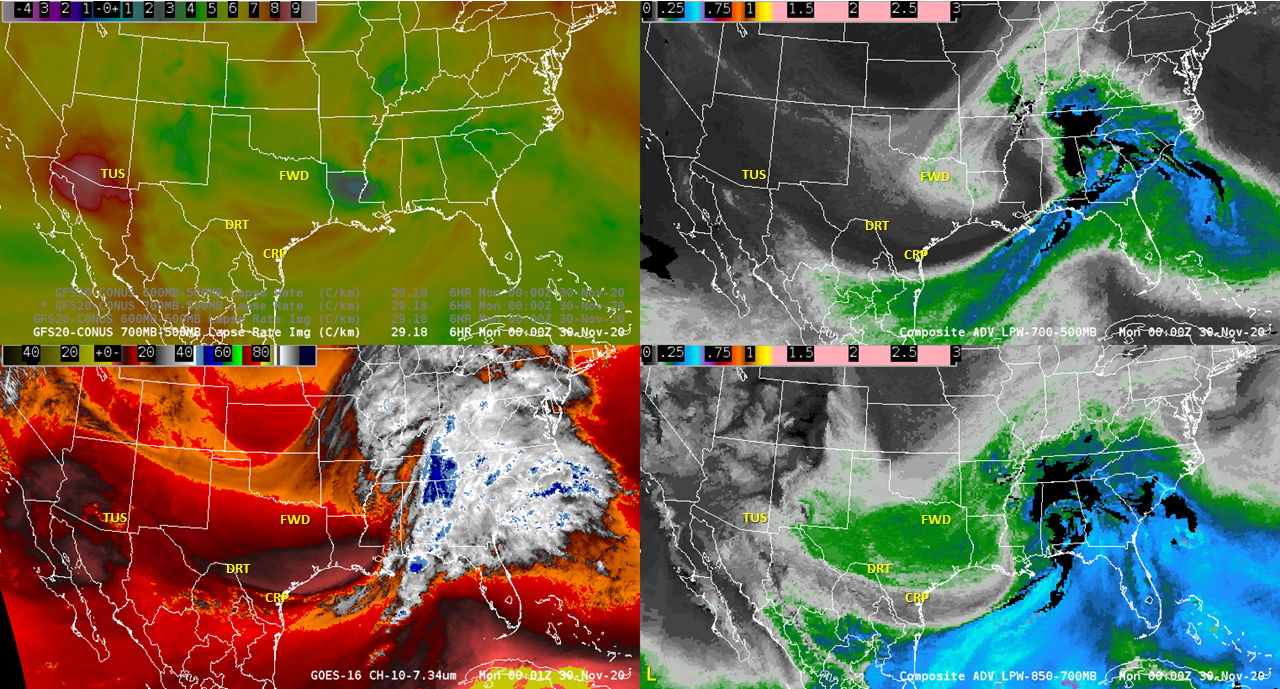
Next, we’ll consider this 4 panel animation:
Upper-left: GFS 700-500 mb lapse rate
Upper-right: ALPW product in the 700 to 500 mb layer
Lower-left: GOES-16 7.3 micron imagery
Lower-right: ALPW product in the 850 to 700 mb layer
Early in the loop, during the daytime hours of November 29 we see a rather obvious region of steeper mid-level lapse rates in Arizona and northwest Mexico. The evening sounding from Tucson, AZ:
Shows a deep well-mixed layer with very steep (nearly dry-adiabatic) mid-level lapse rates. In the GOES 7.3 micron imagery we see very warm brightness temperatures since the weighting function peaks around 600-700 mb, within the well mixed warm / dry air mass. The ALPW product in the 700-500 mb layer shows this as a very dry air mass as well. The animation indicates that this air mass advected eastward towards Texas, so we may suspect some portion of the dry air observed further east may have come from the Elevated Mixed Layer (EML) across Arizona and northern Mexico. Next we’ll look at soundings to assess this.
The 00Z soundings from Del Rio, TX:
and Corpus Christi, TX:
depict dry air at mid-levels, as well as very steep mid-level lapse rates characteristic of what you may expect with an EML as we observed in the Tucson sounding.
The animation appears to show the dry air mass moving from Arizona into Texas and Louisiana combining with the developing trough where you’d expect to see a subsidence signal (mid-level drying). In fact a sounding north of the EML plume as indicated by the steeper mid-level lapse rates in the GFS at Fort Worth, TX:
shows the dry air mass at mid-levels, but not the steeper mid-level lapse rates like we observe further south in Texas, much like you would associate with being in a subsidence region of a developing trough. The dry air mass we observe on satellite images appears to be a combination of both the subsidence region of a developing extra-tropical cyclone and an EML with origins over Arizona / northern Mexico. The EML is of particular note since the steeper mid-level lapse rates may lead to a more favorable environment for severe thunderstorms. Click on this image to compare the above 00Z sounding sites with the imagery at the corresponding time:
Next, let’s assess November 30 12Z soundings, we’ll be referring to the following sounding sites (corresponding imagery from 12Z is shown):
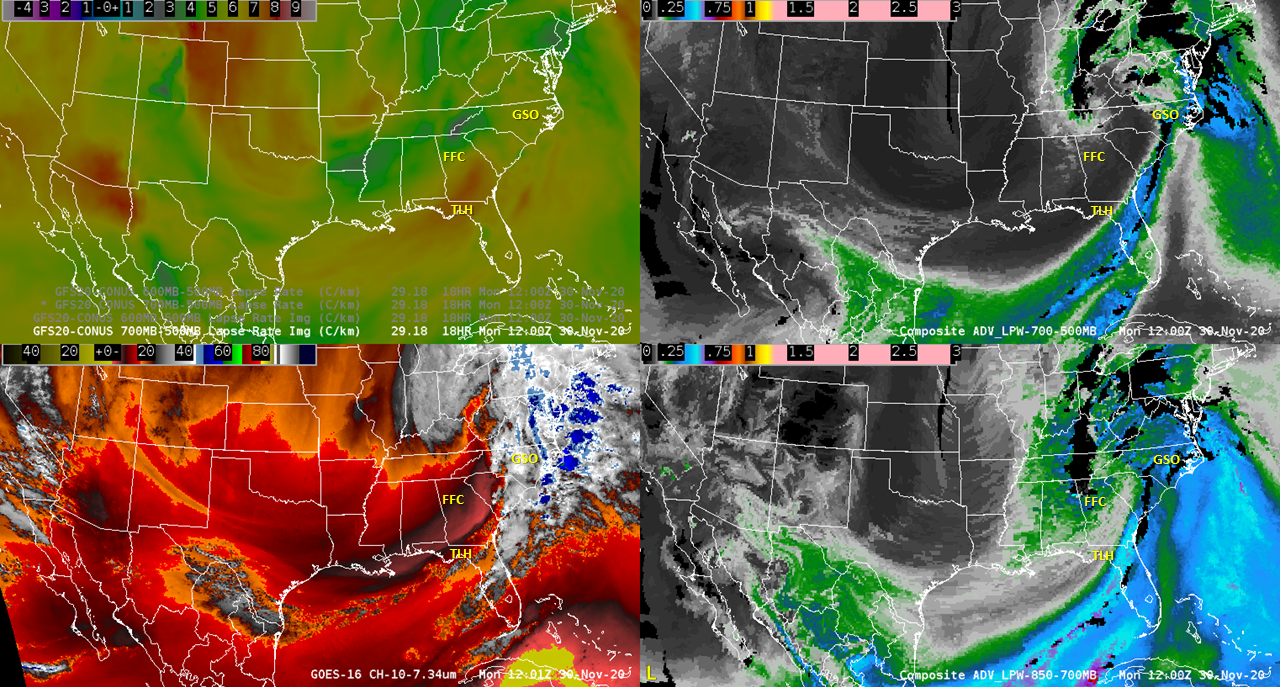
Was the EML evident in the Nov. 30 12Z soundings?
Yes, in Atlanta, GA:
and also in Tallahassee, FL:
Note that the region of warmer brightness temperatures in the GOES 7.3 micron band and drier air mass in the ALPW 700-500 mb layer is not quite to central North Carolina at 12Z:
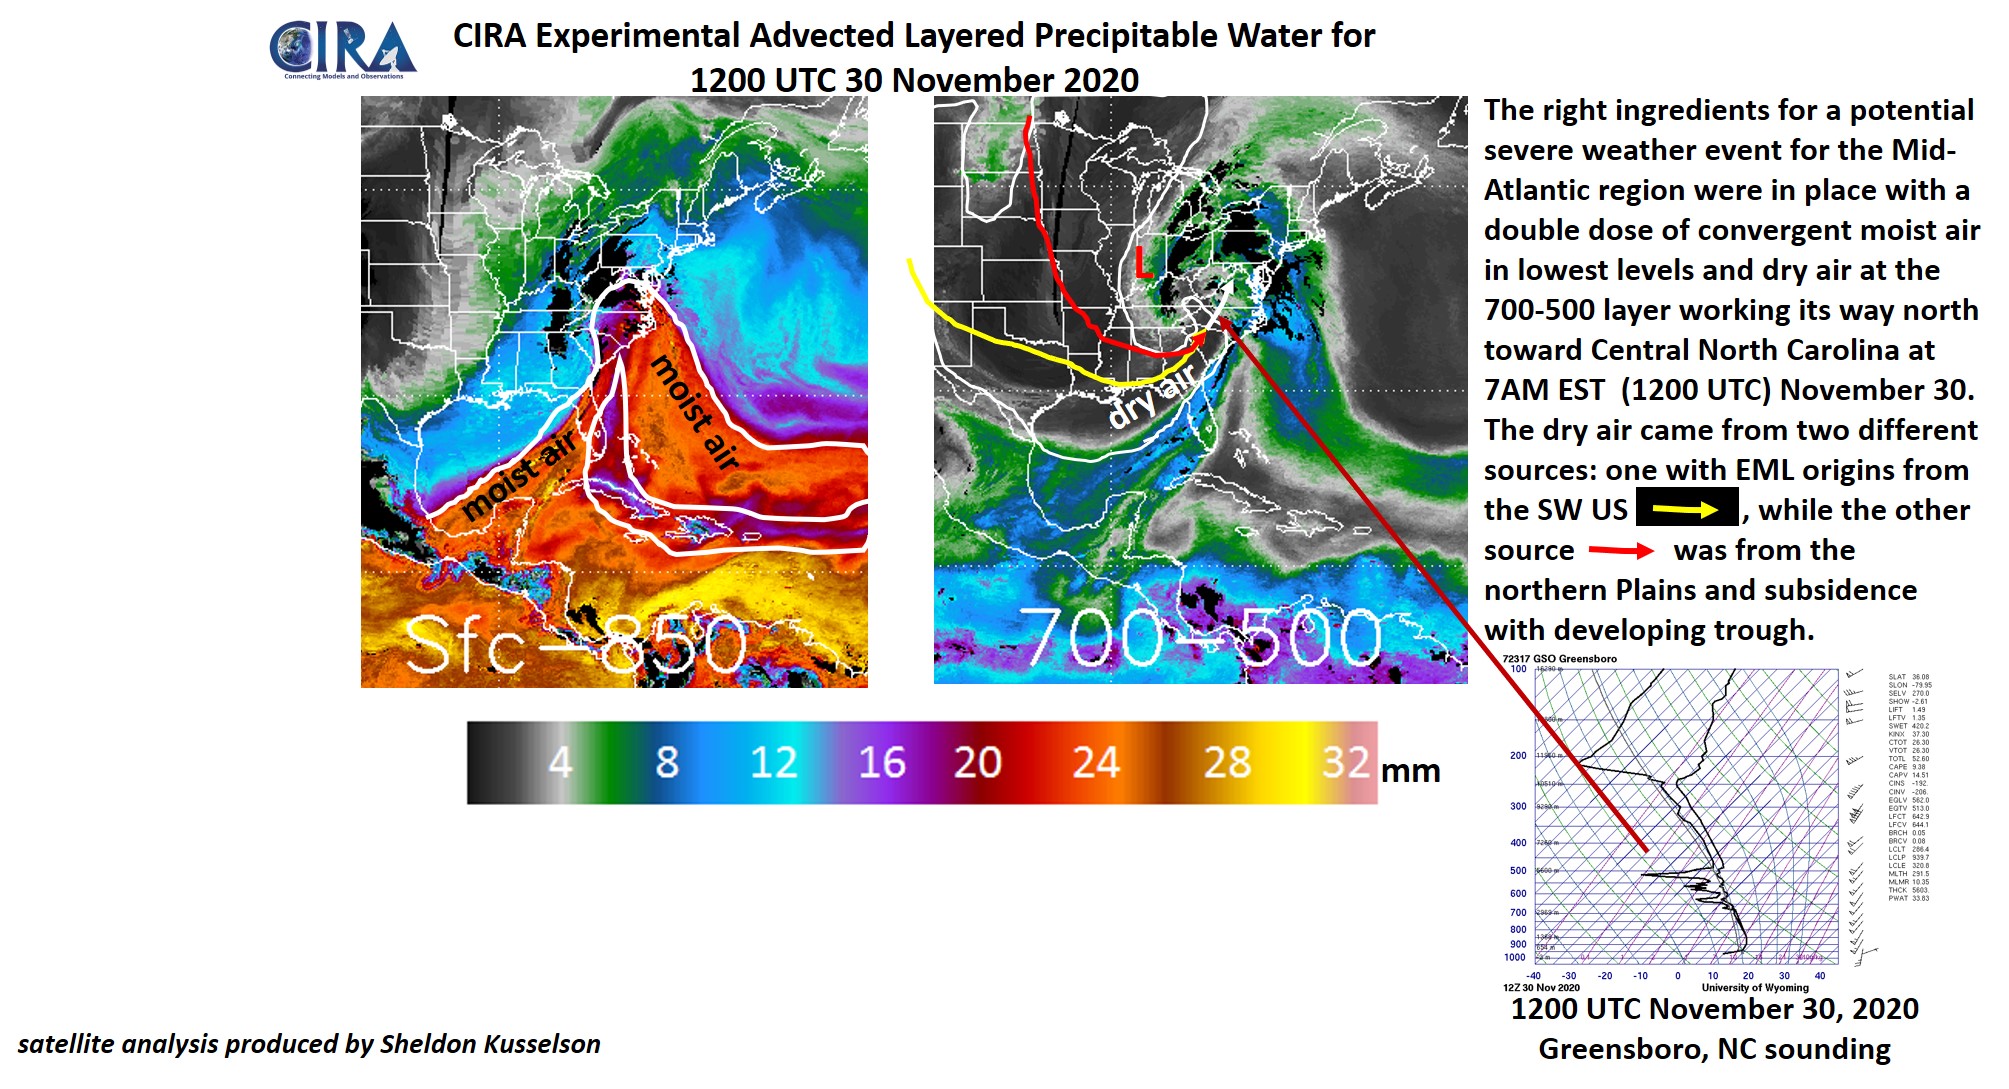
The mid-level dry air mass had not yet arrived at sounding time, however without an 18Z RAOB is there another way to assess the air mass at Greensboro, NC (GSO)?
Yes, NUCAPS provides soundings (except no wind data) around 18Z, here is the NUCAPS sounding at that time a little southeast of Greensboro, NC within the dry mid-level air mass:
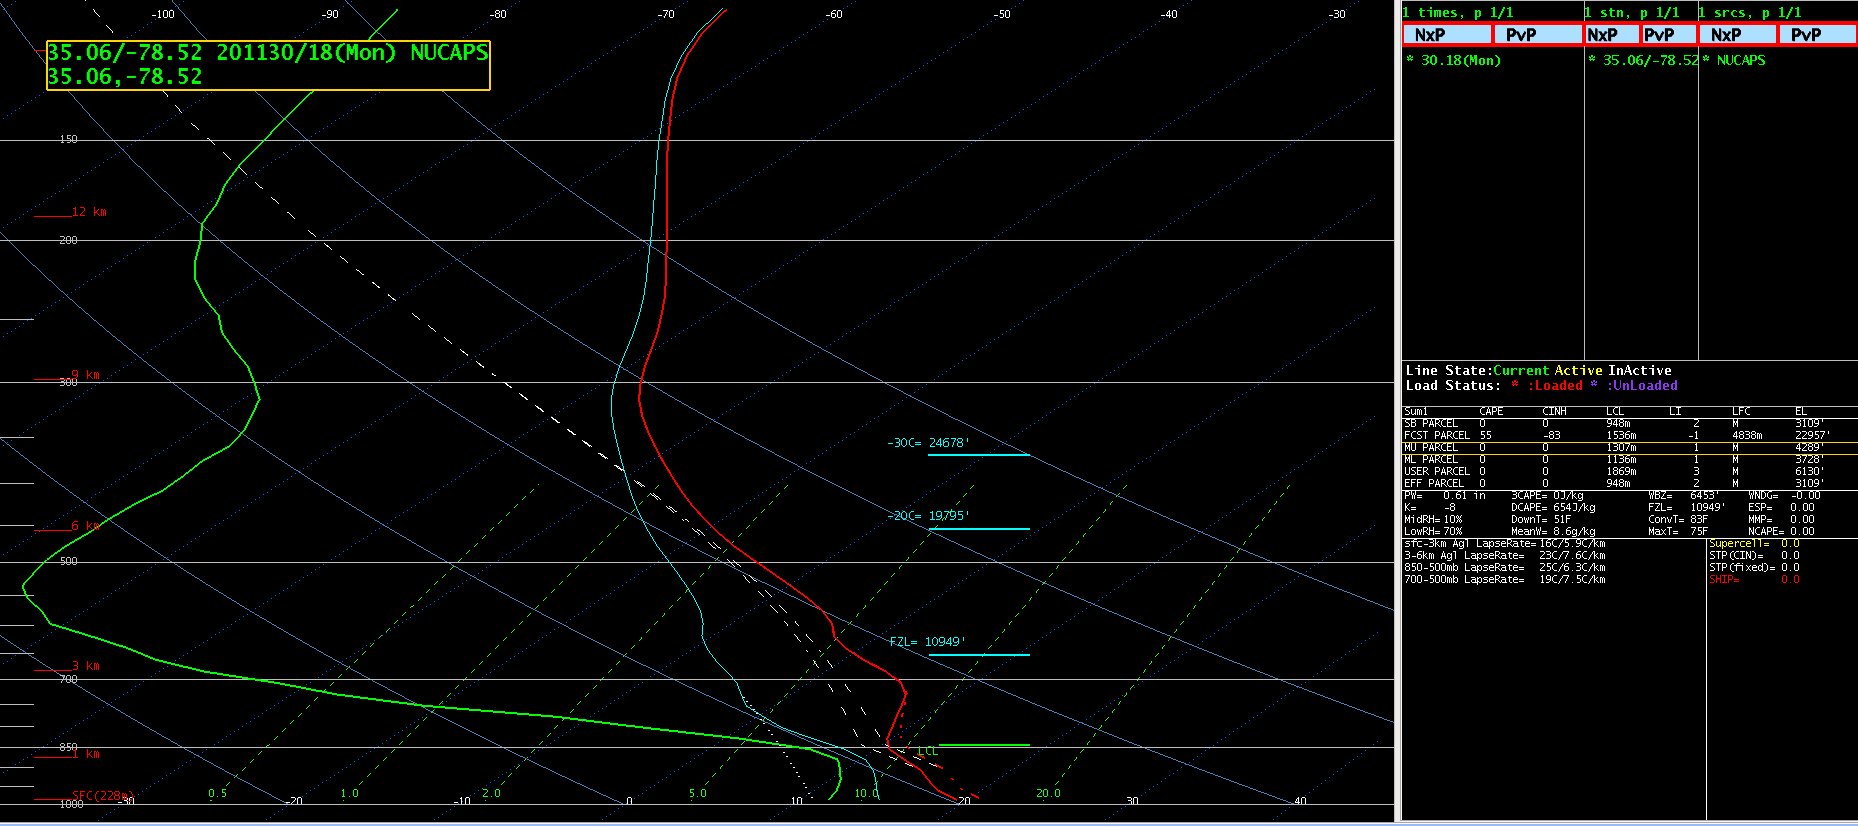
We can see that the mid-level dry air mass has moved through Greensboro, and the mid-level lapse rates are quite steep (7.5 degrees C per km), this is confirmation of the mid-level lapse rates caused by a combination of the EML and being in the subsidence region of the extra-tropical cyclone.
Compare the 12Z Greensboro sounding with the 18Z NUCAPS sounding near Greensboro
Note that low-level features such as sharp capping inversions may not be adequately resolved with NUCAPS soundings, however that is not an issue here since we are assessing mid-level drying and lapse rates.
Moving on to the time of the severe thunderstorms, we analyze the GOES visible (0.64 micron) imagery:
Cloud coverage was quite extensive during the morning hours over the region that experienced severe weather which likely limited the overall severe threat, however there was a narrow region of clearing that developed that allowed for sufficient insolation and thus destabilization that contributed to the severe thunderstorms.
Posted in: Severe Weather, | Comments closed
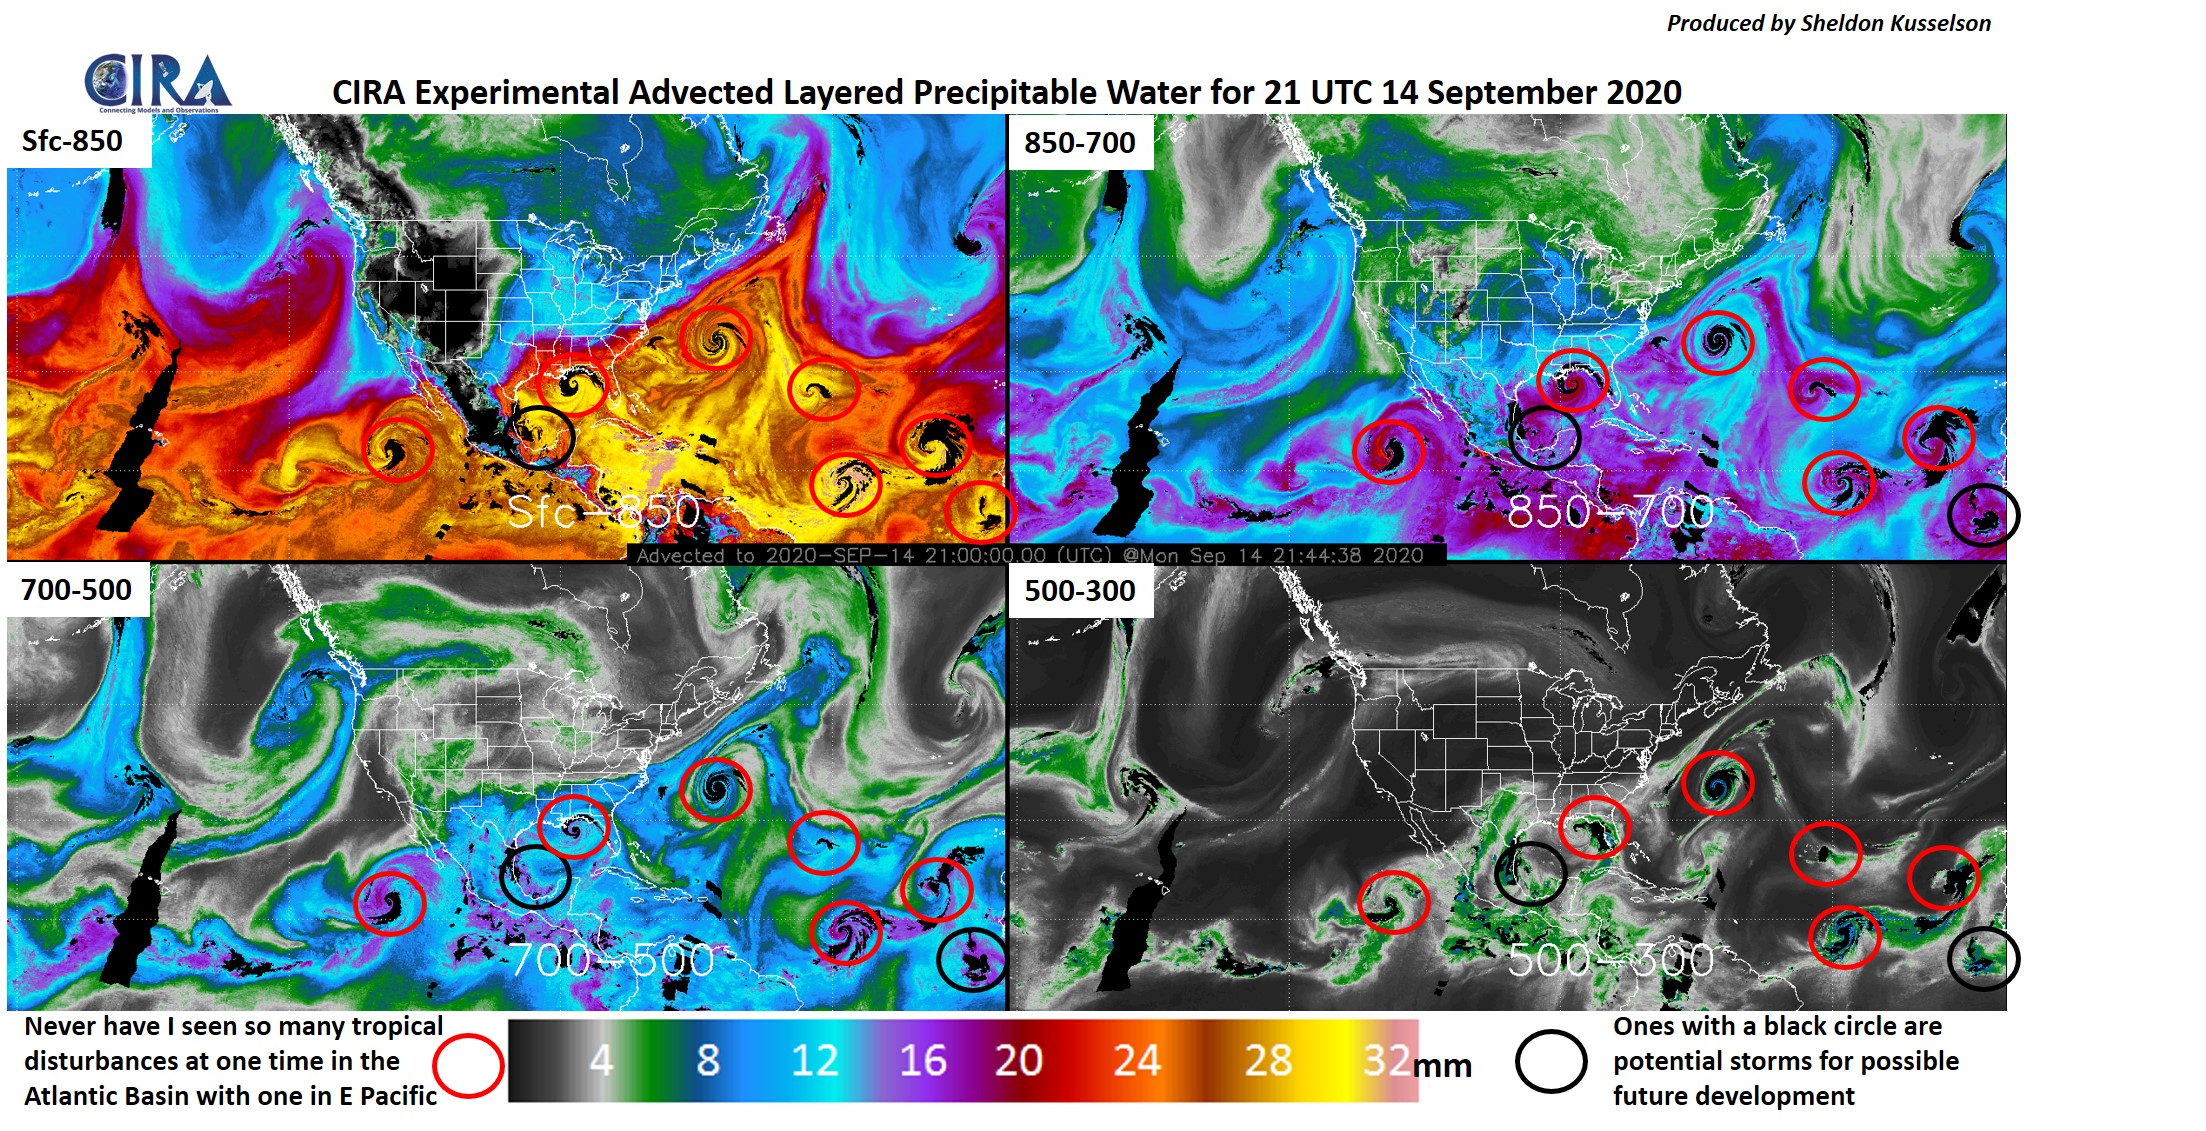
ALPW depiction of many tropical cyclones & disturbances – September 14, 2020
September 15th, 2020 by Dan BikosBy Sheldon Kusselson
Posted in: Tropical Cyclones, | Comments closed