
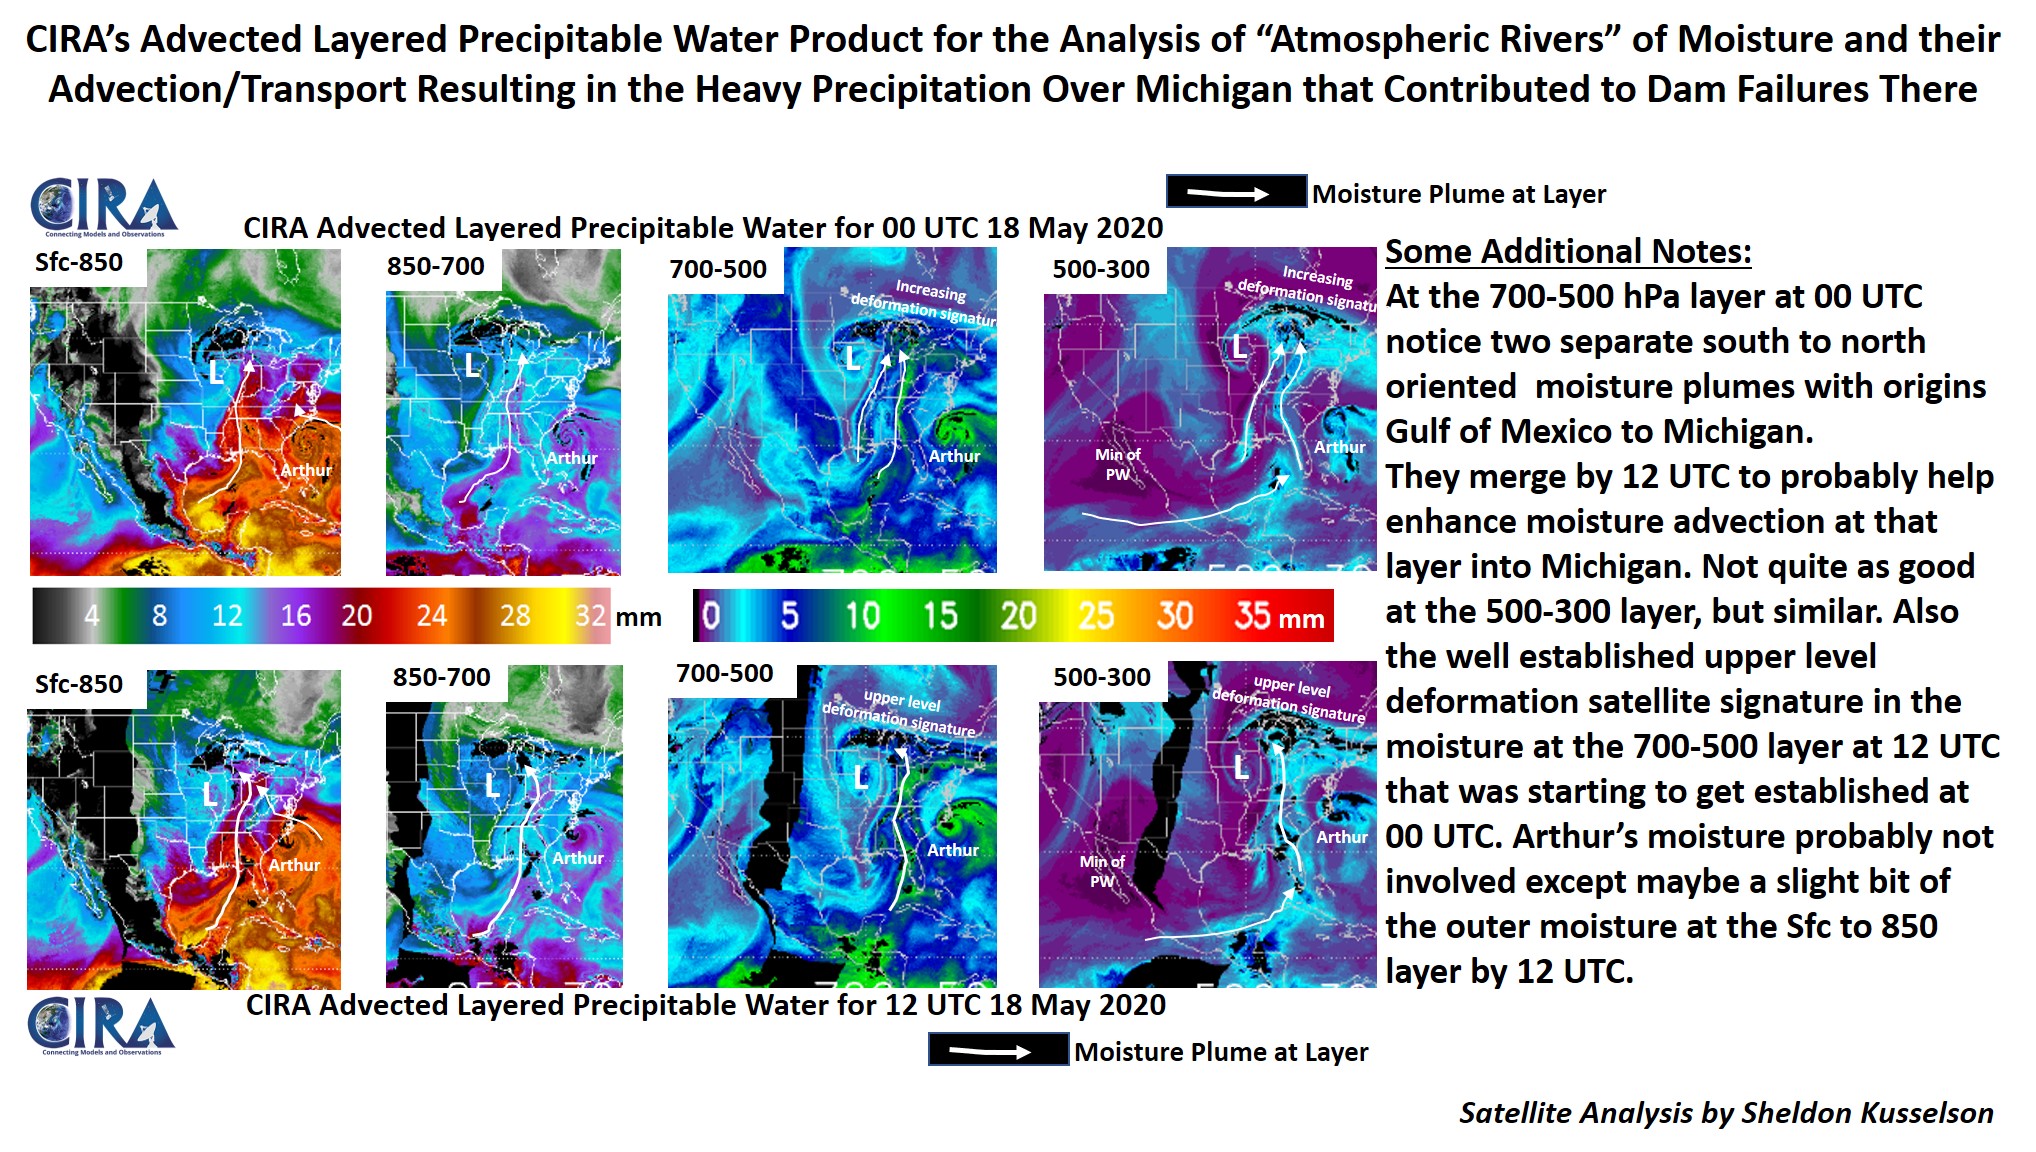
Heavy rain event around 18 May 2020 that contributed to dam failures in Michigan
May 22nd, 2020 by Dan BikosBy Sheldon Kusselson
Posted in: Heavy Rain and Flooding Issues, Hydrology, | Comments closed
GOES/JPSS Observations of Oklahoma Severe Storms and Elevated Mixed Layer
May 7th, 2020 by Jorel TorresBy Jorel Torres, Dan Bikos and Ed Szoke
A line of severe storms moved through the southern plains on 4 May 2020, producing numerous hail and wind reports across the region (accessed via SPC). The GOES-16 Day Cloud Phase Distinction RGB is shown below, overlaid onto the GOES-16 CAPE product from 17Z, 4 May 2020 to 00Z, 5 May 2020. Notice how the atmospheric environment in Oklahoma becomes more unstable (2500-3500 J/Kg – peak observations) before convective initiation occurs. A line of agitated cumulus develops around 20Z, 4 May 2020 just north of Oklahoma City, OK. moving east. The RGB observes liquid water clouds (seen in blue) that become glaciated (green), and start to grow rapidly upscale. The rapid vertical development indicates strong updrafts within the embedded line of storm cells, where mid-to-high level ice clouds are depicted in yellows, oranges and reds within the RGB.
Another way to observe atmospheric instability is by using Gridded NUCAPS, that is a product derived from polar-orbiting satellites (i.e. in this case, NOAA-20). Gridded NUCAPS provides users temperature and moisture fields via plan-view and cross-sections. For brevity sake, a plan-view of the temperature field is observed at 1912Z, 4 May 2020, highlighting the 850mb-500mb lapse rate (i.e. temperature change with height). Although Gridded NUCAPS imagery is static (i.e. not an animation), notice how lapse rates steepen with height from central Oklahoma to southern and southwestern Oklahoma, where values range from 6.5C/km to 9C/km. The steeper lapse rates indicate a more unstable environment favorable for severe storms to develop. Conversely weaker lapse rates (less than 5.5C/km; see northeast OK and northwest AR) are a sign of a stable environment. Note stable wave clouds were observed in these respective areas, earlier in the day, due to early morning convection.

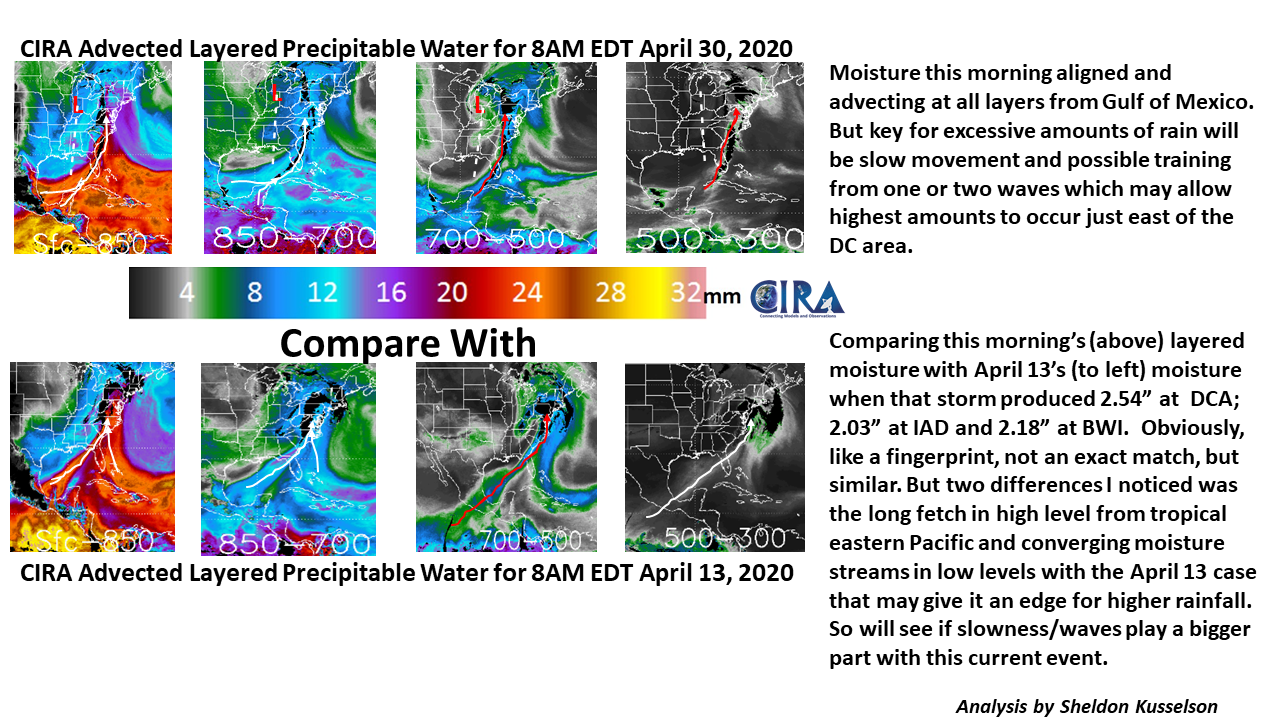
But what about the moisture component? Look no further than the Advected Layered Precipitable Water (ALPW) product that helps users inspect precipitable water values in 4 separate layers: surface-850mb, 850mb-700mb, 700-500mb, and 500-300mb. An ALPW animation (click image) is observed below from 16-23Z, 4 May 2020. Moisture is concentrated in the low levels of the atmosphere mainly between surface-850mb. Now to be fair, marginal precipitable water values are observed between 850-700mb early in the day, however dry air moves into this region at ~18Z.

Now this mid-level dry air appears to indicate the presence of an Elevated Mixed Layer (EML) which can be integral for the severe thunderstorm environment. An EML typically has a steep mid-level lapse rate, mid-level dry air, and a strong capping inversion, inhibiting convection. With an EML in place, this allows the possibility for high amounts of CAPE to exist but the question is whether the inversion can break. In this case, a lifting mechanism was present, a front, to presumably aid in upward forcing (i.e. rising motion associated with converging low level air) to break the inversion, and subsequently generate rapid convective initiation. For interested readers, more information on EMLs and how they can be identified and tracked can be accessed here: (Gitro et al 2019).
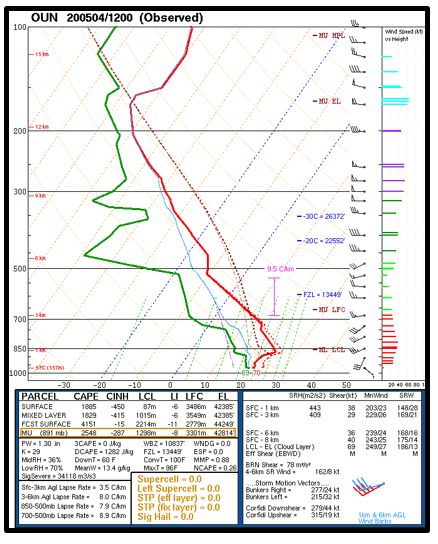
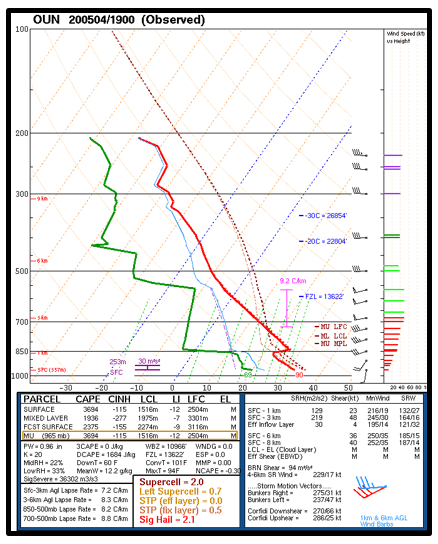
Furthermore, note the rapid drying in the moisture profiles of the 12Z and 19Z KOUN RAOB soundings, specifically from 850mb-700mb. Drying corresponds with ALPW 850mb-700mb precipitable water layer. Additionally, observe the steep mid-level and low-level lapse rates (also seen by Gridded NUCAPS above) along with the presence of a strong inversion depicted in the 19Z KOUN sounding. To zoom-in, click on individual soundings.
The EML can also be seen by GOES-16 7.3um from 16Z, 4 May 2020 to 00Z, 5 May 2020. See animation below. The low-level water vapor channel observes a narrow extent of very warm brightness temperatures oriented from southwest-to-northeast from the Texas Panhandle into Oklahoma. The southwest-to-northeast line of very warm temperatures then rapidly cool, due to the front generating upward motion, subsequently eroding the capping inversion, leading to rapid thunderstorm development.
Posted in: GOES R, POES, Satellites, Severe Weather, | Comments closed
Advected Layer Precipitable Water (ALPW) analysis for 30 April 2020 event
April 30th, 2020 by Dan Bikos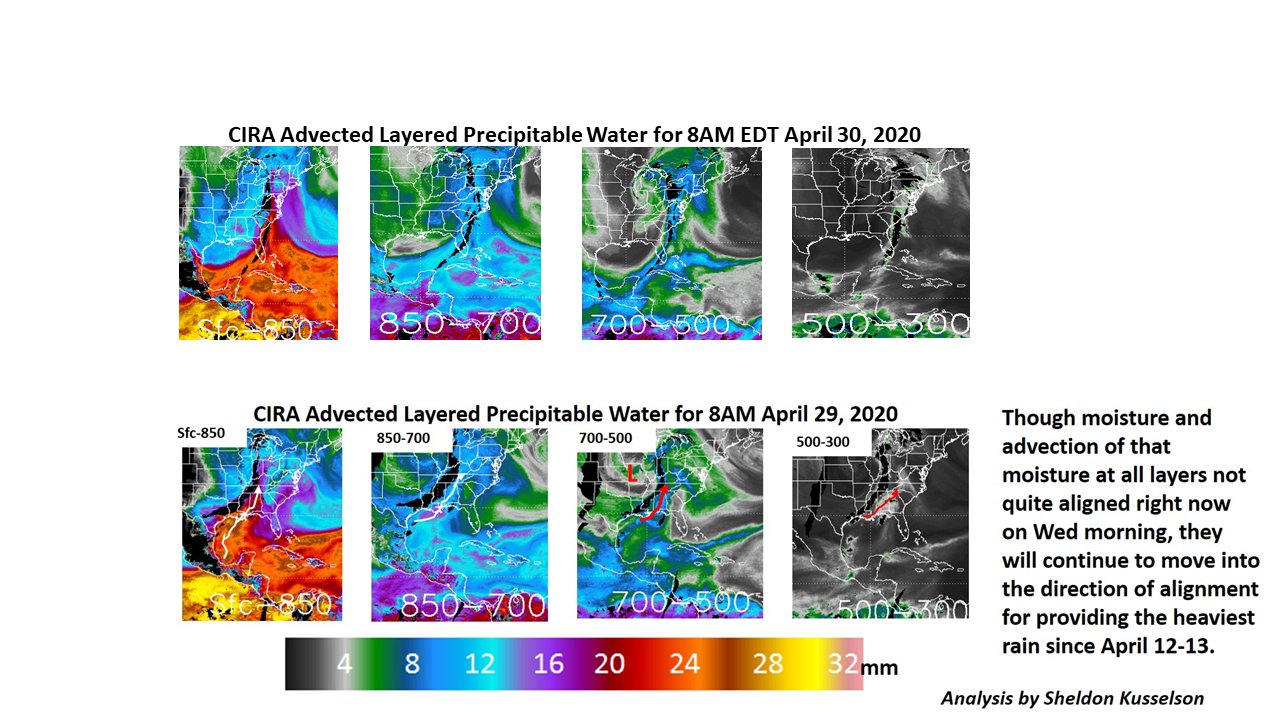
Posted in: Heavy Rain and Flooding Issues, Hydrology, | Comments closed
Nighttime view of inflow feeder clouds from GOES Nighttime Microphysics RGB
March 20th, 2020 by Dan BikosDuring the overnight hours of March 18-19, 2020, there were numerous reports of severe weather (including tornadoes) in north Texas:
https://www.spc.noaa.gov/climo/reports/200318_rpts.html
This blog entry will focus on the storm repsonsible for the tornado reports between 0615 – 0650 UTC near Abilene, TX.
The storm of interest can be viewed in this 4-panel display zoomed in to the storm near Abilene, TX:
Upper-left: GOES-16 Nighttime Microphysics RGB
Upper-right: GOES-16 IR (10.3 micron) band with default color table
Lower-left: GOES-16 Flash Extent Density grid (1 minute update)
Lower-right: MRMS 0.5 km MSL composite reflectivity
Note the clouds that develop east of Abilene that are circled here:
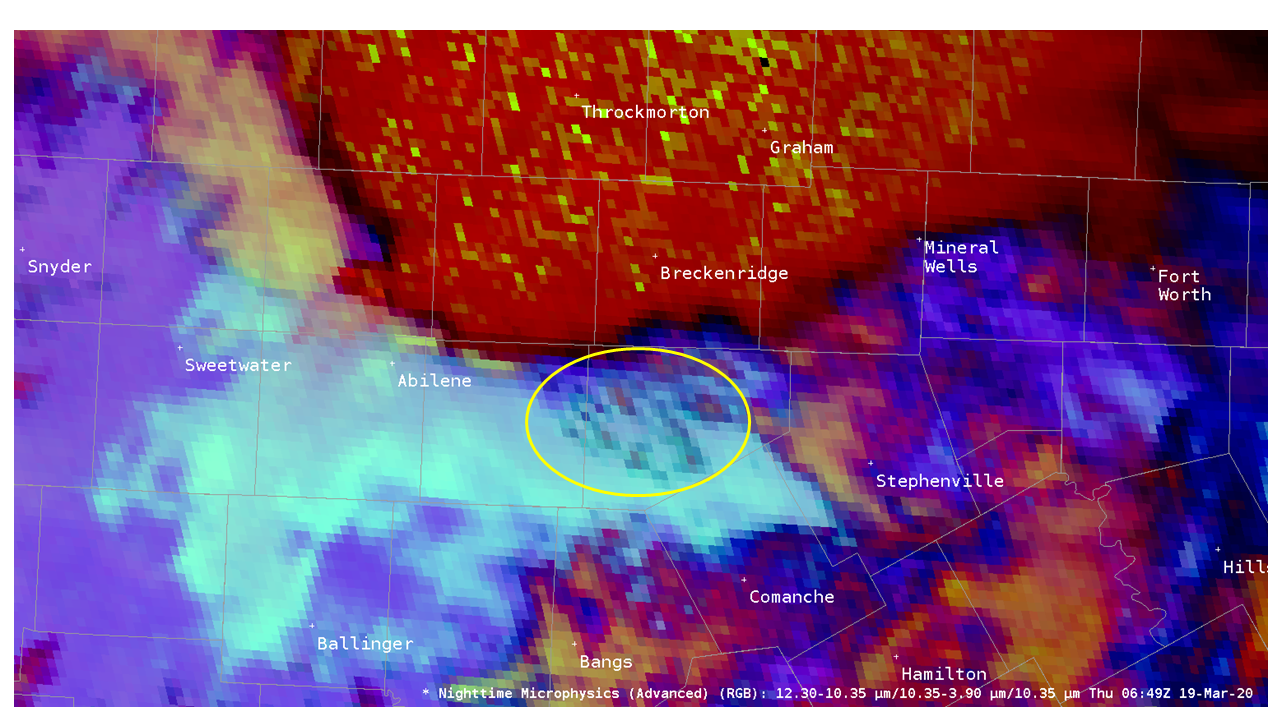
The clouds are bands oriented parallel to the low-level wind direction and exist in the converging inflow region of the storm. These are inflow feeder clouds – see this schematic which depicts where they are typically found (to the right of the flanking line in this diagram) and some examples to illustrate how they may appear in visible imagery:
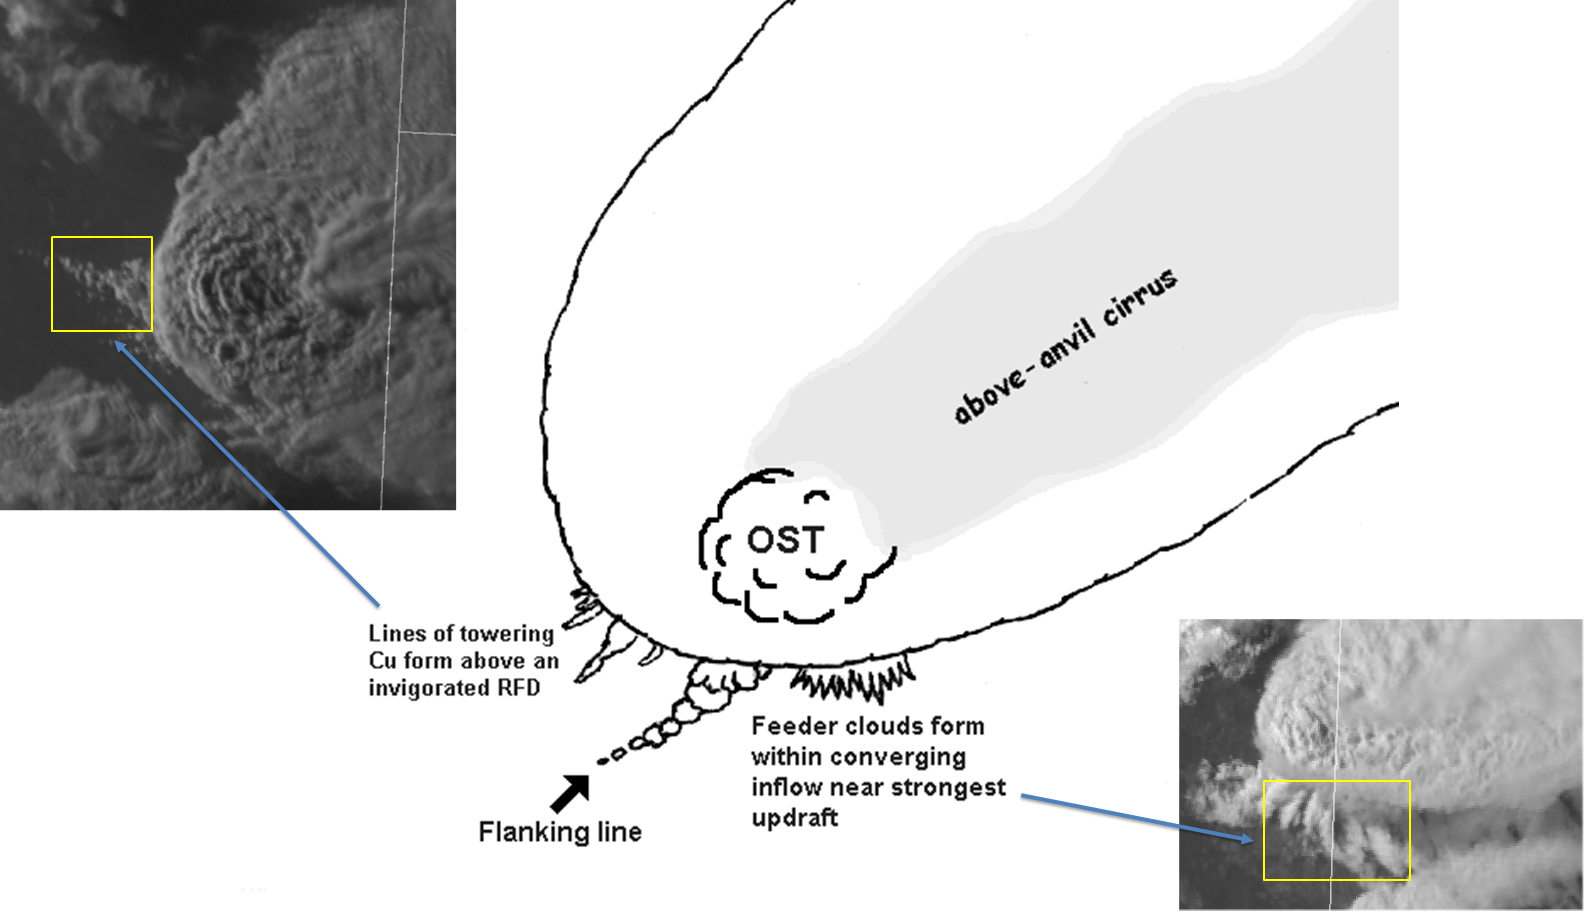
Since the resolution of the IR bands more coarse than that of visible bands, it’s typically more difficult to identify storm scale features seen from satellite at night such as inflow feeder clouds. In this case, they are not obscured by anvil cirrus and can be seen, albeit not as clearly as they typically appear with visible imagery analysis during daytime.
Let’s zoom in to view a larger perspective of the nighttime microphysics RGB:
Note that a mesoscale domain sector was available at this time, providing 1-minute imagery that was likely crucial for detecting inflow feeder clouds. How does this compare with other bands and products?
First, the IR imagery with the default color enhancement:
A different color table applied to the same imagery:
and the fog product:
The nighttime microphysics product appears to offer the most unambiguous view of the inflow feeder clouds at night.
Posted in: Convection, Severe Weather, | Comments closed
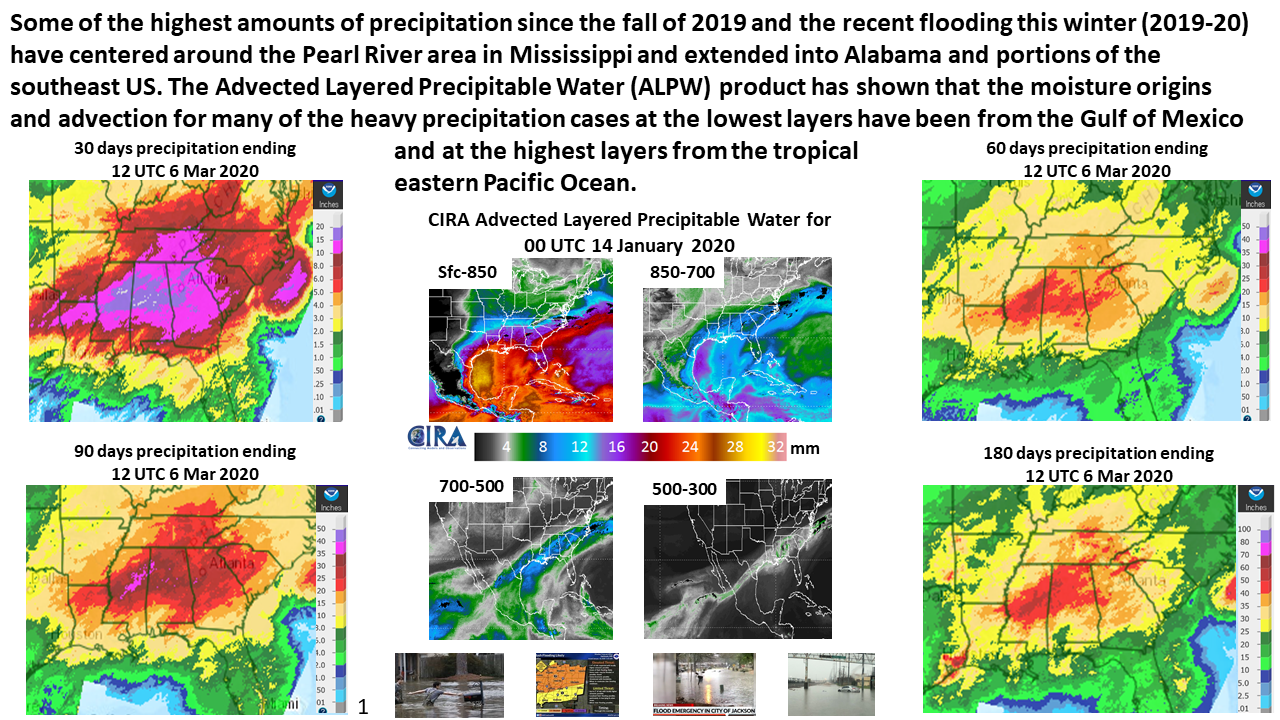
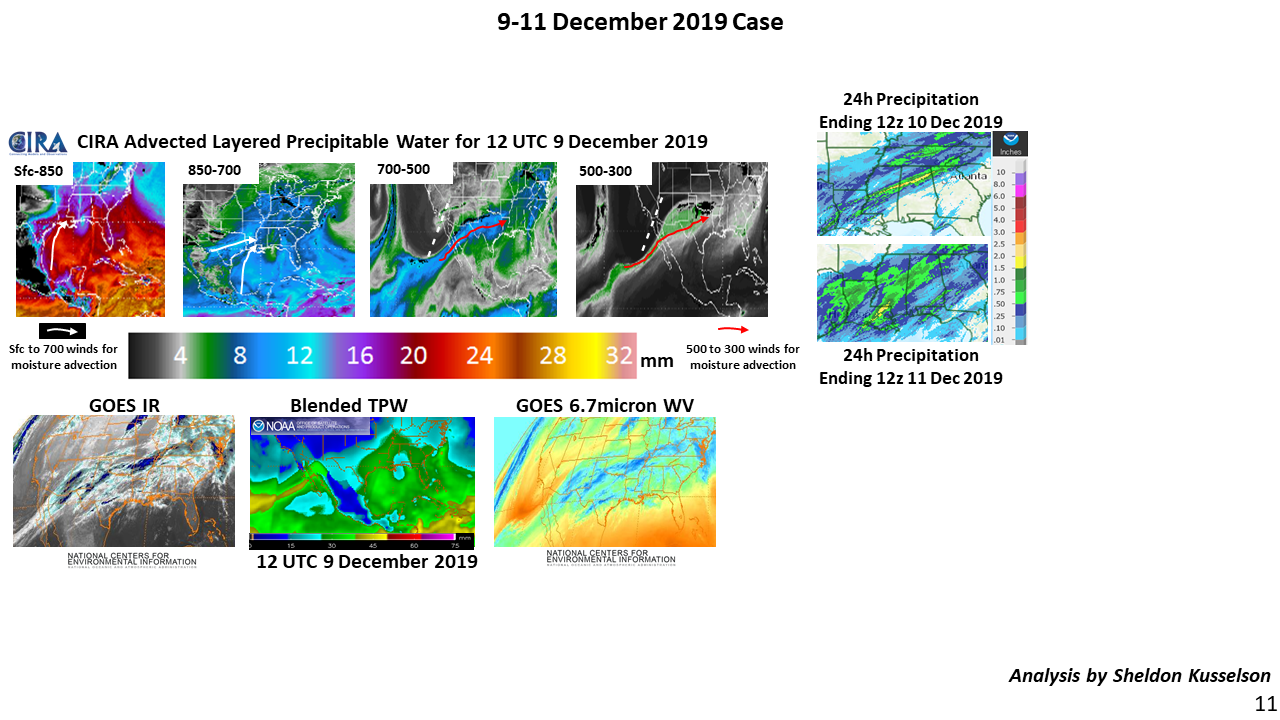
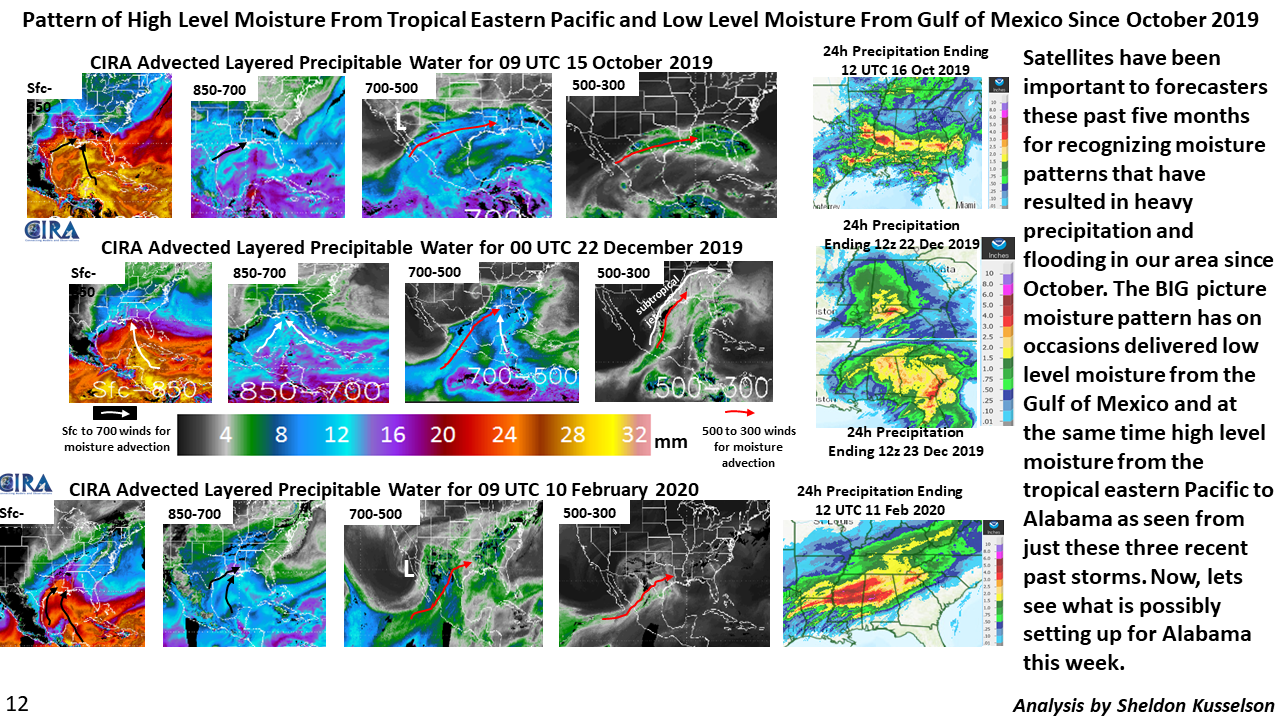
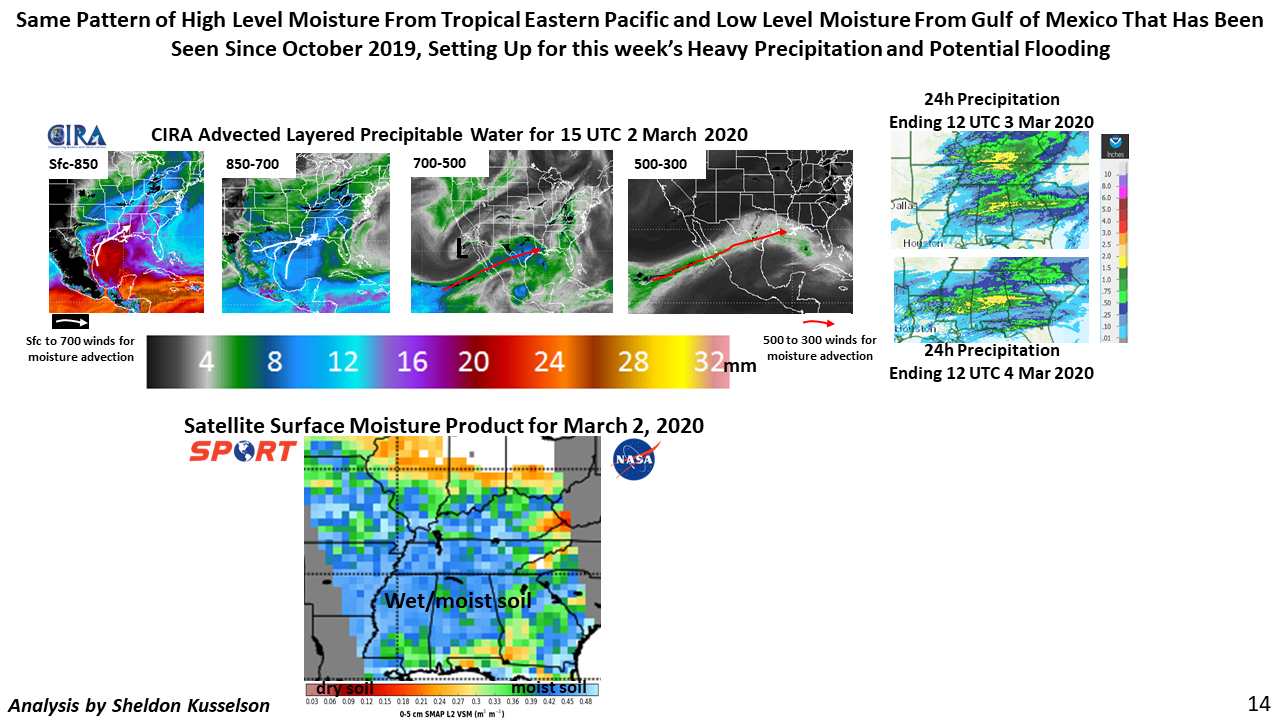
Fall 2019 through Winter 2020 Heavy Precipitation Events
February 24th, 2020 by Dan BikosBy Sheldon Kusselson
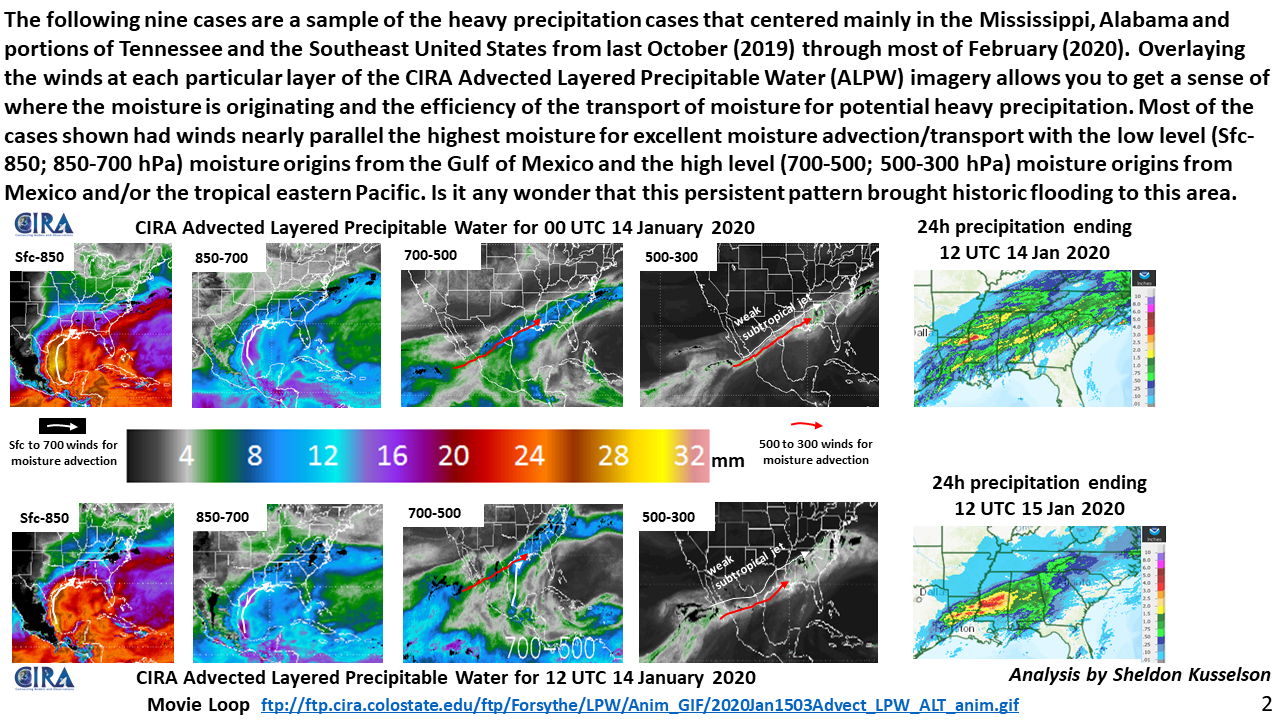
ftp://ftp.cira.colostate.edu/ftp/Forsythe/LPW/Anim_GIF/2020Jan1503Advect_LPW_ALT_anim.gif
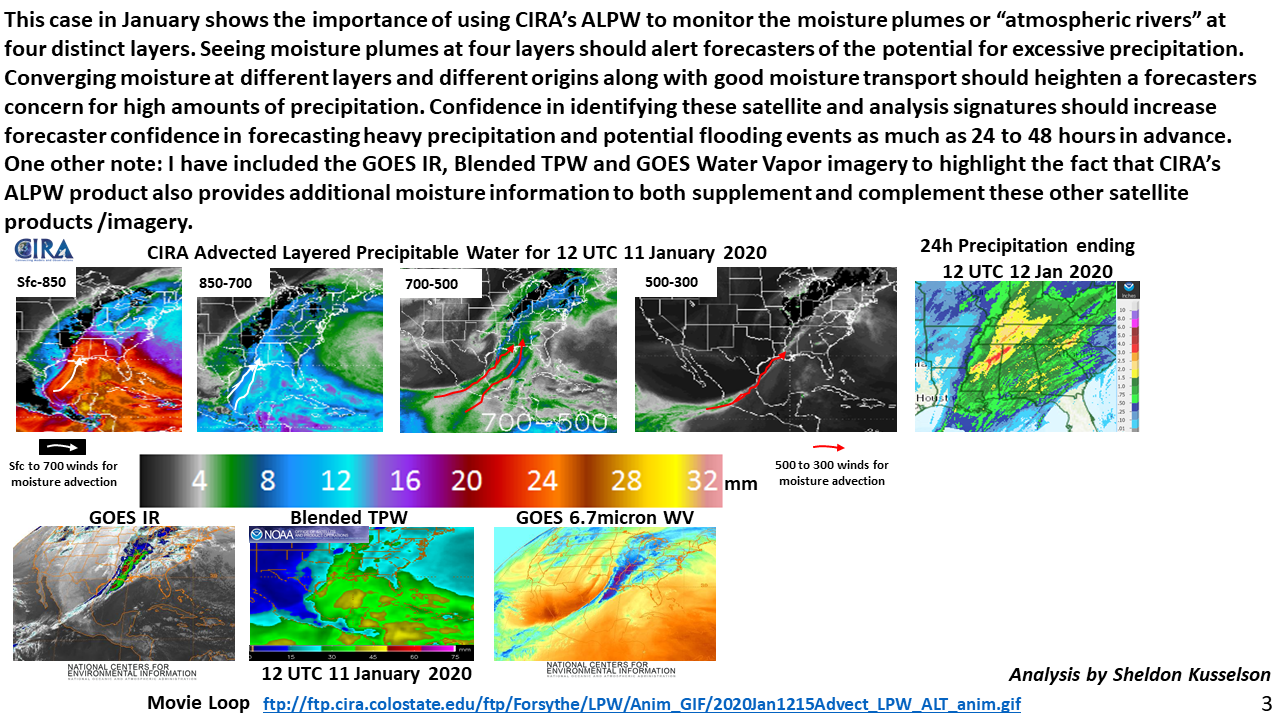
ftp://ftp.cira.colostate.edu/ftp/Forsythe/LPW/Anim_GIF/2020Jan1215Advect_LPW_ALT_anim.gif
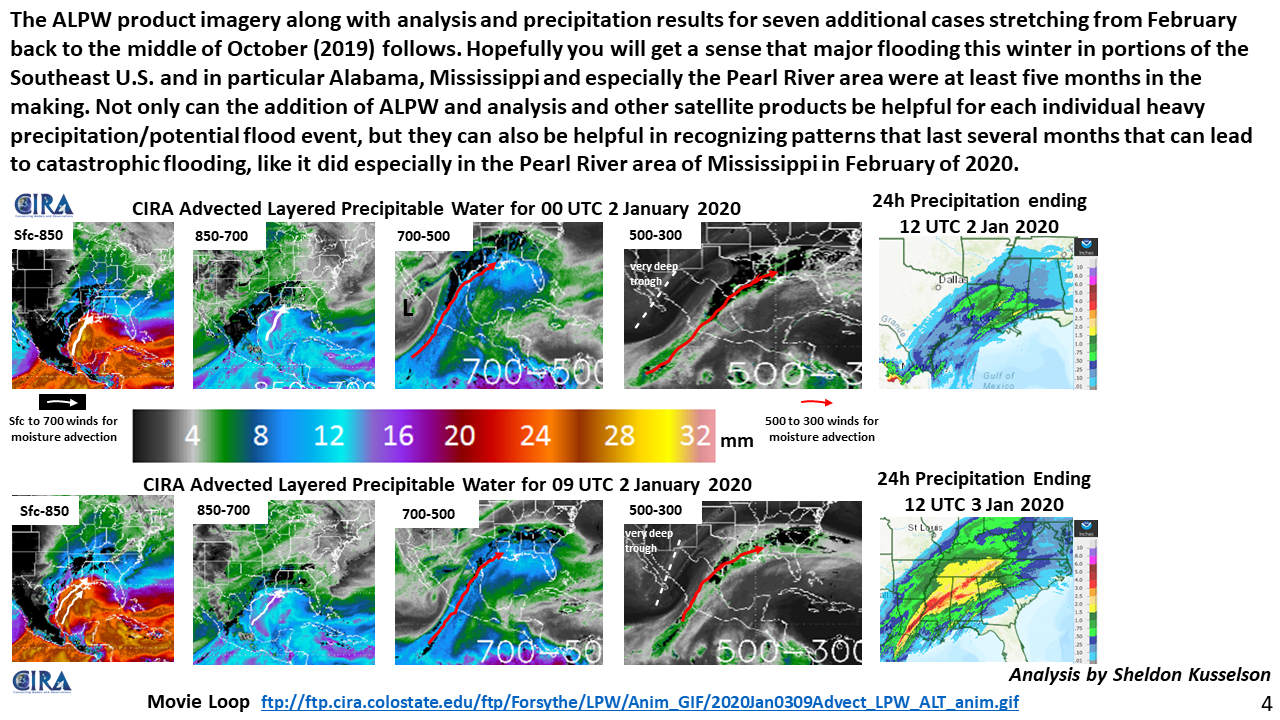
ftp://ftp.cira.colostate.edu/ftp/Forsythe/LPW/Anim_GIF/2020Jan0309Advect_LPW_ALT_anim.gif
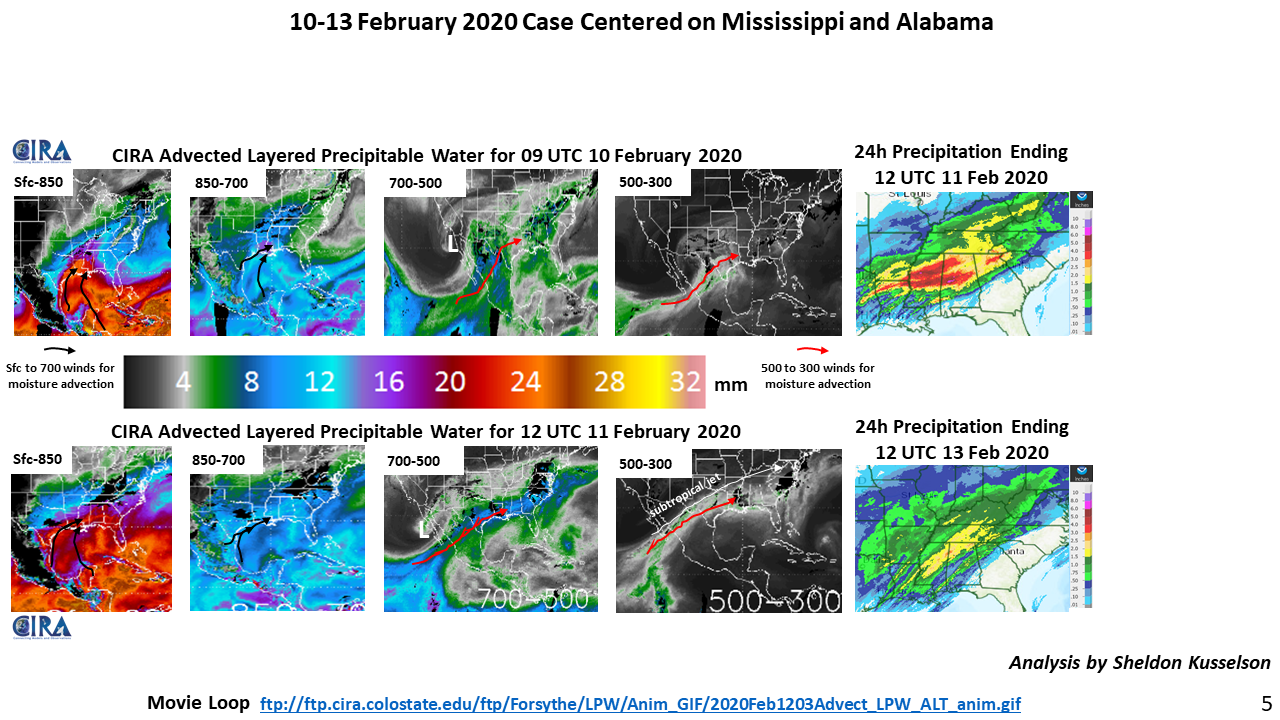
ftp://ftp.cira.colostate.edu/ftp/Forsythe/LPW/Anim_GIF/2020Feb1203Advect_LPW_ALT_anim.gif
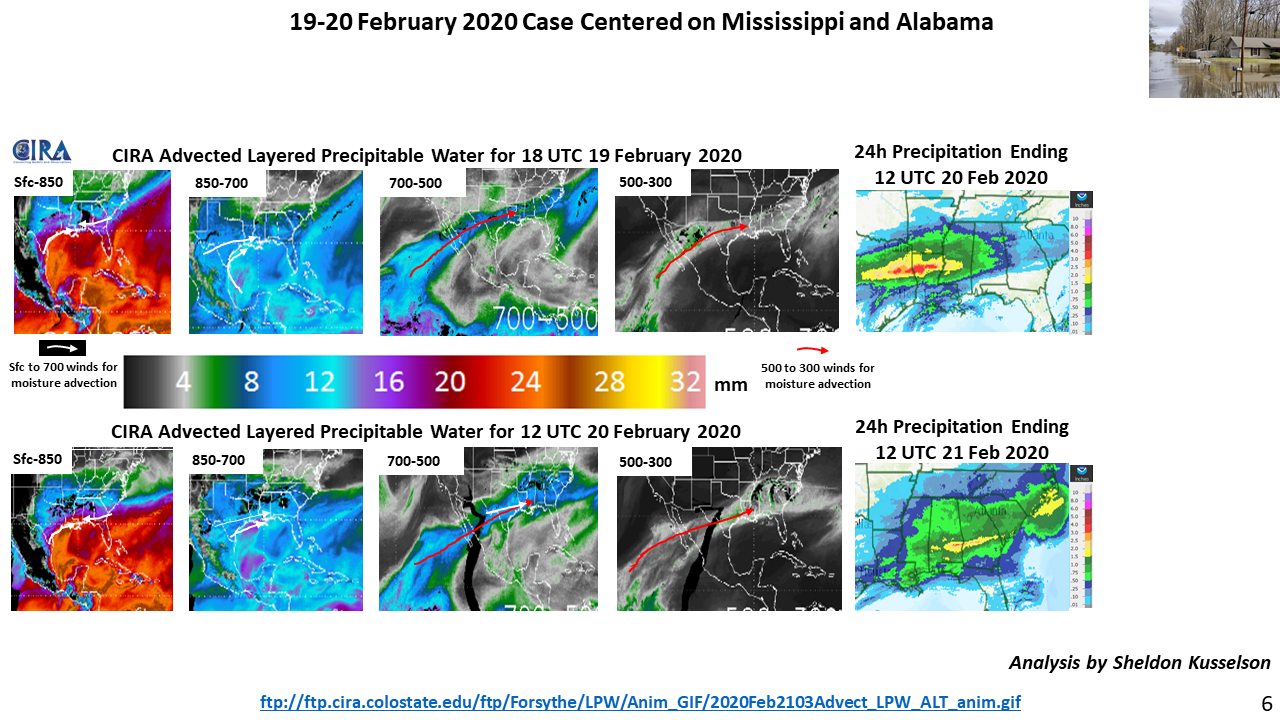
ftp://ftp.cira.colostate.edu/ftp/Forsythe/LPW/Anim_GIF/2020Feb2103Advect_LPW_ALT_anim.gif
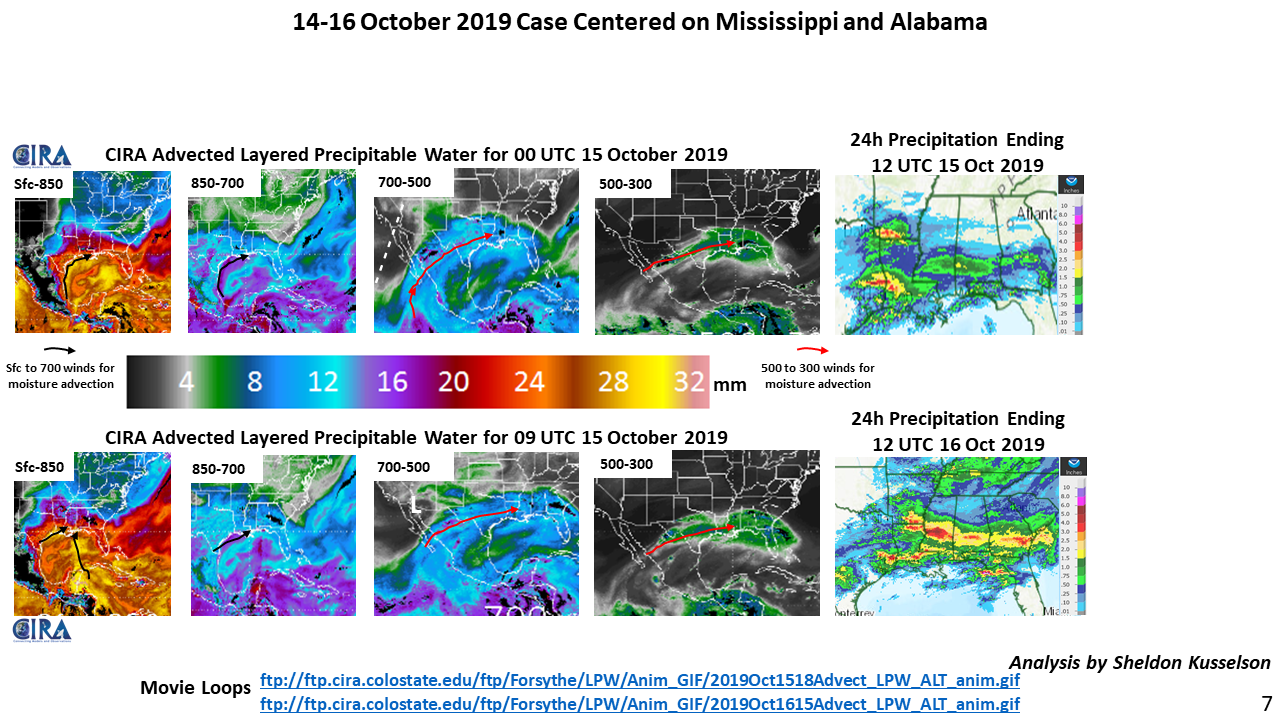
ftp://ftp.cira.colostate.edu/ftp/Forsythe/LPW/Anim_GIF/2019Oct1518Advect_LPW_ALT_anim.gif
ftp://ftp.cira.colostate.edu/ftp/Forsythe/LPW/Anim_GIF/2019Oct1615Advect_LPW_ALT_anim.gif
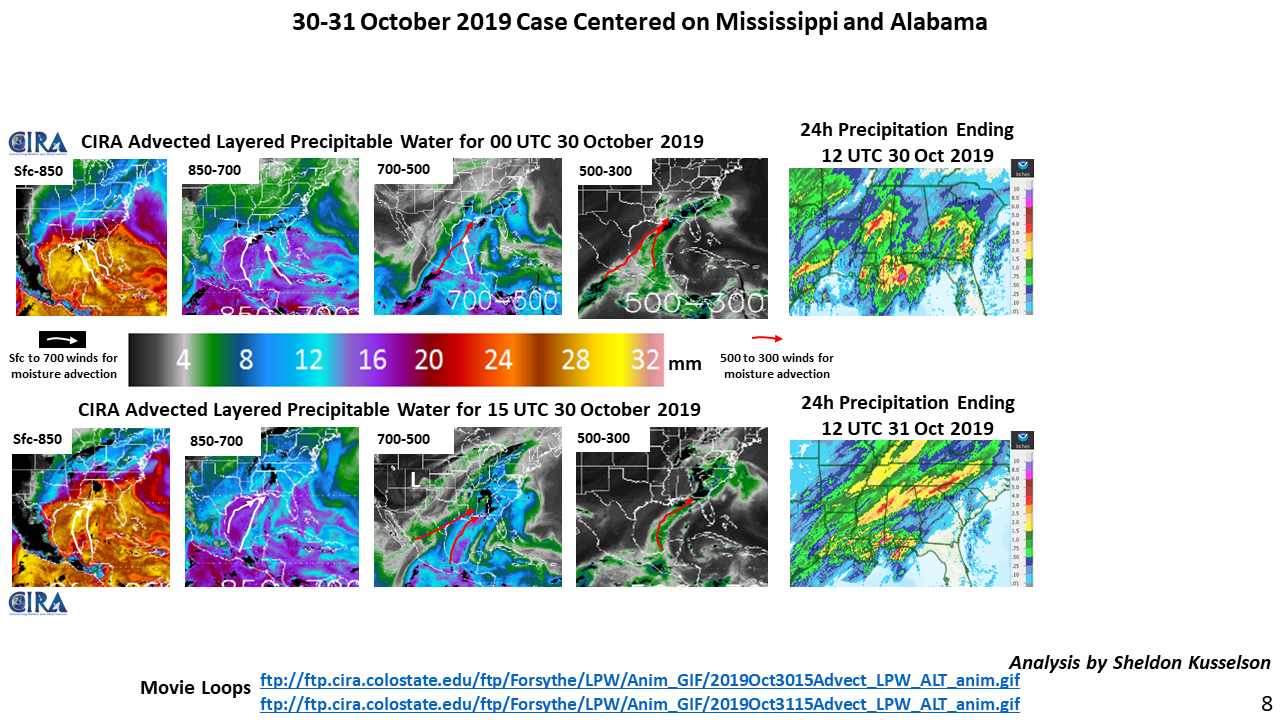
ftp://ftp.cira.colostate.edu/ftp/Forsythe/LPW/Anim_GIF/2019Oct3015Advect_LPW_ALT_anim.gif
ftp://ftp.cira.colostate.edu/ftp/Forsythe/LPW/Anim_GIF/2019Oct3115Advect_LPW_ALT_anim.gif
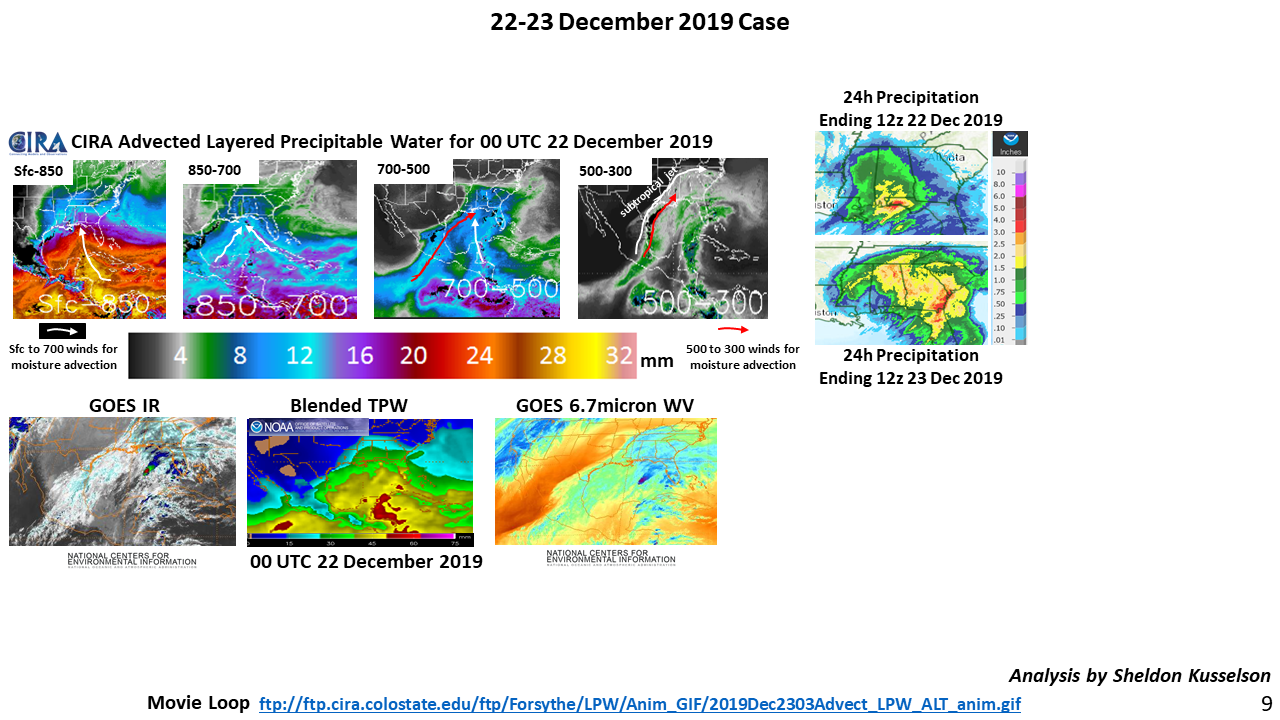
ftp://ftp.cira.colostate.edu/ftp/Forsythe/LPW/Anim_GIF/2019Dec2303Advect_LPW_ALT_anim.gif
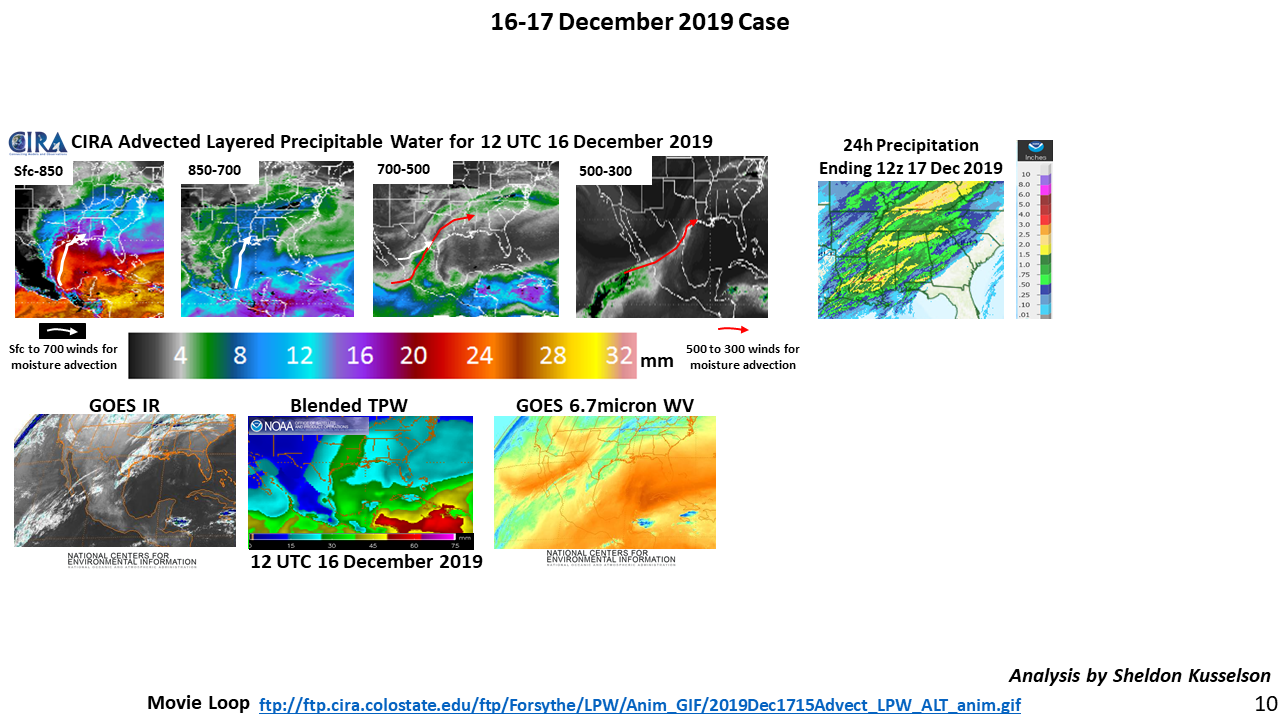
ftp://ftp.cira.colostate.edu/ftp/Forsythe/LPW/Anim_GIF/2019Dec1715Advect_LPW_ALT_anim.gif

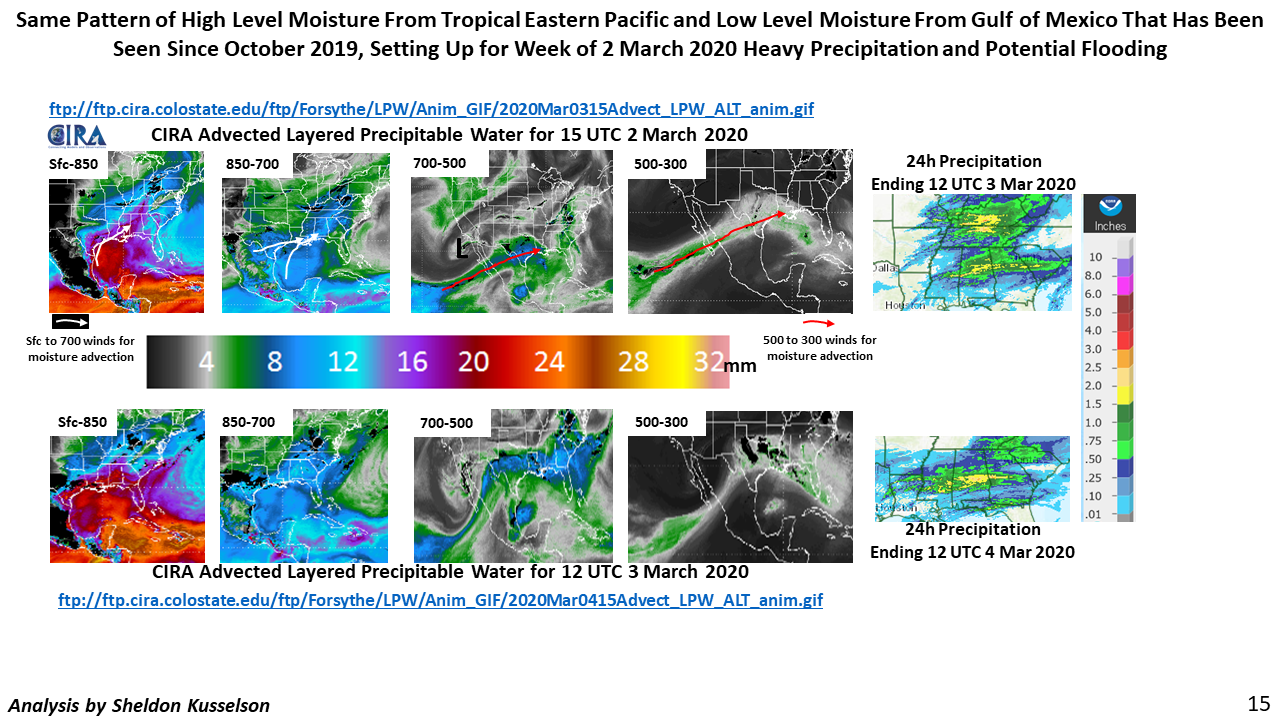
ftp://ftp.cira.colostate.edu/ftp/Forsythe/LPW/Anim_GIF/2020Mar0315Advect_LPW_ALT_anim.gif
ftp://ftp.cira.colostate.edu/ftp/Forsythe/LPW/Anim_GIF/2020Mar0415Advect_LPW_ALT_anim.gif
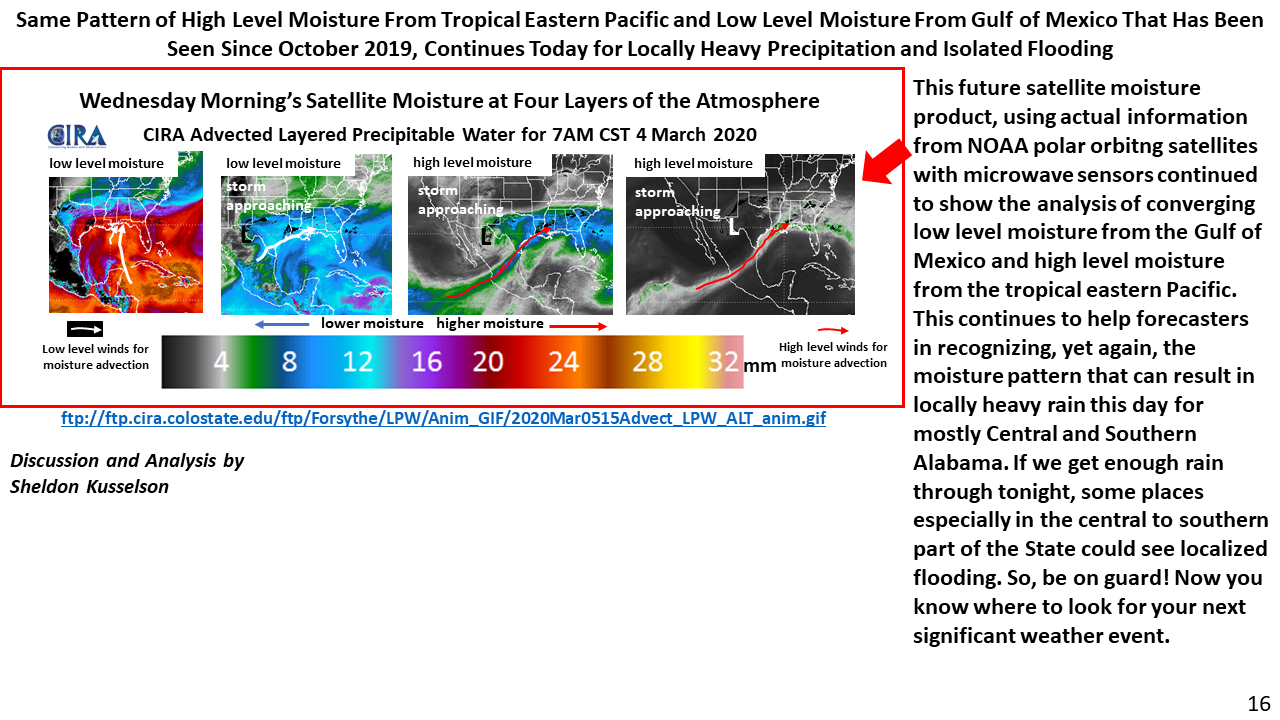
ftp://ftp.cira.colostate.edu/ftp/Forsythe/LPW/Anim_GIF/2020Mar0515Advect_LPW_ALT_anim.gif
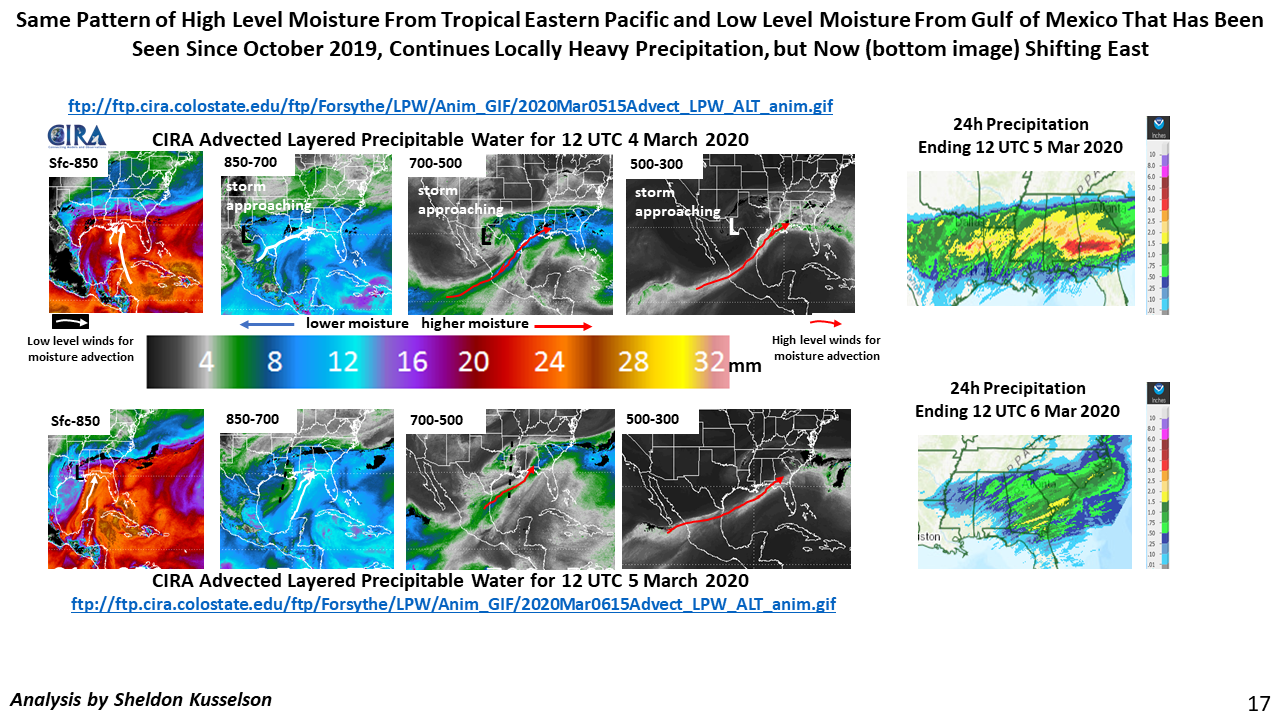
ftp://ftp.cira.colostate.edu/ftp/Forsythe/LPW/Anim_GIF/2020Mar0515Advect_LPW_ALT_anim.gif
ftp://ftp.cira.colostate.edu/ftp/Forsythe/LPW/Anim_GIF/2020Mar0615Advect_LPW_ALT_anim.gif
Posted in: Heavy Rain and Flooding Issues, | Comments closed