21 November 2018 Snow Squall event in upstate New York
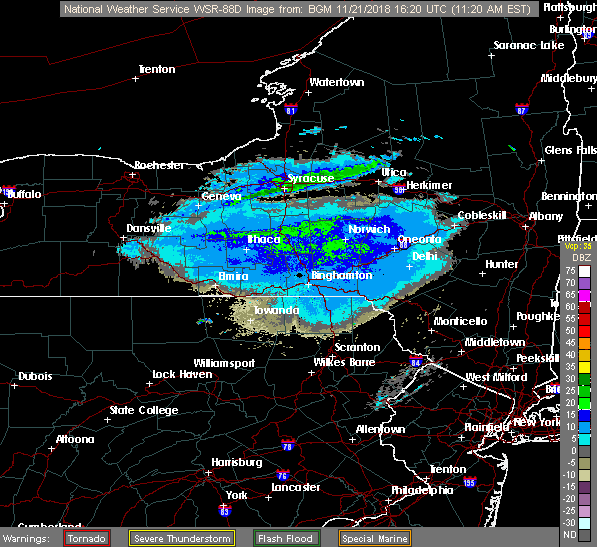
November 21st, 2018 by Dan BikosOn 21 November 2018 a cold front moved through upstate New York with an associated band of heavier snow, as seen in this WSR-88D reflectivity image:

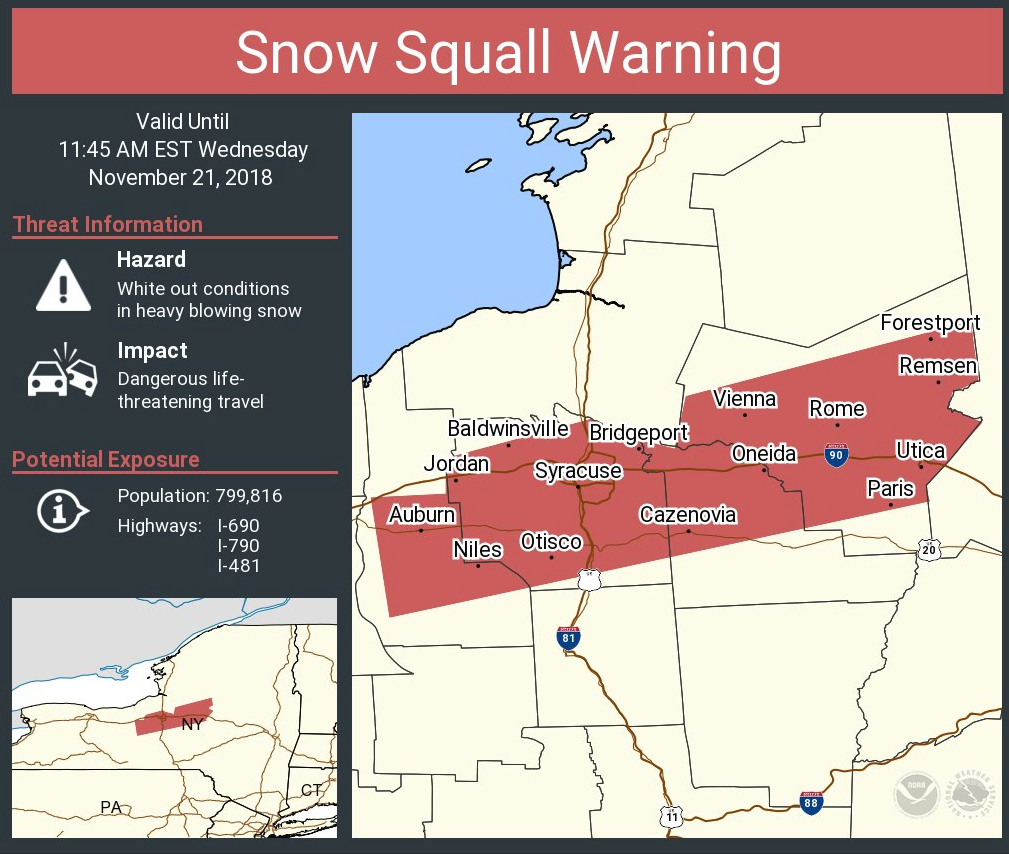
Note the narrow region of higher reflectivities extending from near Syracuse northeastward. This snowband prompted a snow squall warning issued by the NWS office in Binghamton:

How about the perspective from GOES-16? Here is a 4 panel display of visible (0.64 micron band) in the upper left, the day cloud phase distinction RGB (upper right), IR (10.3 micron band) with the default color curve (IR_Color_Clouds_Winter) in the lower left, and IR (10.3 micron band) with the GOES Snow Squall color curve in the lower right:
The imagery on the top 2 panels relies on information from the visible band, therefore it’s only valid during daylight hours. The familiar visible imagery in the upper left shows the snowband as more textured clouds along a narrow line, which is along the cold front as seen in the METARs. The day cloud phase distinction RGB shows the snowband as green with surrounding clouds as light blue or cyan. The surrounding clouds are clouds composed of liquid water, which show up as light blue or cyan in this RGB product. The snowband is associated with more vertically developed clouds, therefore have glaciated tops associated with them. Once glaciation occurs, the blue component of this RGB product (the 1.6 micron band) goes from a high contribution to a low contribution since ice clouds absorb radiation considerably more than liquid water clouds at this wavelength. Lower contribution of blue means that the green contribution (0.64 micron) shows up quite well (since clouds reflect during the daytime). How about the IR band shown in the bottom panels? There is insufficient contrast to identify the snowband with the IR imagery in the default color curve in the lower left panel. The lower right panel has a color curve designed for more contrast at temperature thresholds typically observed with snow squalls, however it’s still not as easy to identify compared with observing the glaciated cloud tops (in green) in the day cloud phase distinction RGB. If this was a nighttime case, the day cloud phase distinction product would be unavailable, leaving you with options such as changing the range on the IR imagery or perhaps making manual adjustments to the color curve in the AWIPS color curve GUI.
Posted in: GOES R, Satellites, Winter Weather, | Comments closed
Sea Ice Motion and VIIRS Spatial Resolutions
November 20th, 2018 by Jorel TorresIt’s nearing wintertime, and over the North and South Poles, sea ice accretion is occurring. Using RAMMB Slider, users can observe sea ice motion and sea ice breakup, via Visible Infrared Imaging Radiometer Suite (VIIRS) instrument on-board the Suomi-National Polar-orbiting Partnership (S-NPP), and NOAA-20 satellites. For unaware users, VIIRS has 22 spectral channels, where 16 channels are at 750-m resolution (i.e. known as ‘Moderate (M) bands’), 5 are at 375-m resolution (i.e. known as ‘Imagery (I) bands’) and the other is the Day/Night Band (DNB) channel at 750-m.
Below is a VIIRS M15 – 10.76um animation, between 5-16 UTC, 20 November 2018, of sea ice motion between Fort Russ, Nunavut, Canada (bottom-left of the animation) and Baffin Island, Canada (upper-middle of the animation). Note, sea ice breakup and erratic sea ice motion are due to varying surface winds. In the imagery, colder brightness temperatures are represented in green and yellow colors, while relatively warmer brightness temperatures are seen in navy blue, aqua and grey colors. Additionally, notice the extremely cold brightness temperatures over Baffin Island (i.e. large areal extent of yellow colors).
Now if users want to use a higher spatial resolution to observe sea ice motion, below is a comparison between the coarser spatial resolution of VIIRS M15 – 10.76um at 750-m to VIIRS I5 – 11.45um at 375-m resolution. The comparison is taken at 1045 UTC, 20 November 2018. Note the sea ice fissures (i.e. crevices and cracks within the sea ice) that are more conspicuous in the I5 that the M15 band.
Posted in: Miscellaneous, POES, | Comments closed
Alaskan Aurora
November 5th, 2018 by Jorel TorresEarly this morning, 5 November 2018, an aurora was visible over the state of Alaska. The aurora was large in areal extent and produced green hues over the Anchorage, AK night sky. A photo of the aurora can be seen, via the following link. Polar-orbiting satellite products observed the phenomenon; imagery is seen before (4 November 2018) and during the event (5 November 2018). Images courtesy of CIRA POLAR Slider.
VIIRS GeoColor @ 2327 UTC, 4 November 2018 (Before the Event)
GeoColor imagery combines 5 spectral channels, where three channels; the aerosol (~0.47um), visible (~0.64um) and vegetation (~0.87um) channels are used during the daytime to contrast between the ocean (i.e. blue, aqua colors), land (i.e. brown colors), overlying cloud cover (i.e. white smooth, thin, or clumpy textures) and snow (i.e. white colors resembling dendritic formations, especially over high, complex terrain).

Day/Night Band (DNB) @ 1349 UTC, 5 November 2018 (During the Event)
DNB product utilizes a sun/moon reflectance model that illuminates atmospheric features and in this case, senses emitted (i.e. auroras, city lights) and reflected light sources (i.e. clouds, snow) during the nighttime. Spatial resolution is at 750-meters and DNB imagery is taken during the new moon phase of the lunar cycle (i.e. moon below the horizon, no available moonlight). In this particular moon phase, without available moonlight, atmospheric features in the imagery are sensed via satellite from ‘atmospheric nightglow‘.
In this particular case, in the DNB imagery, the aurora produces an elongated, horizontal, white streak that dominates the scene. However, if one looks closely, the aurora was so bright (i.e. appearing to assist the atmospheric nightglow phenomenon in sensing features), it reflected light off the snowy surface, that the satellite sensed. Hint for readers: over Alaska, look to the north and to the south of the aurora, to find areas of snow. Ambient cloud cover is also noticed in the imagery.

Day/Night Band (DNB) @ 1349 UTC, 5 November 2018 – ‘Zoomed In’ (During the Event)
If the snow is not visually apparent to readers in the last image, refer to the following ‘zoomed in’ DNB imagery; where the domain is just south of the aurora. ‘Zoomed in’ DNB imagery highlights snow via dendritic formations (also seen in the VIIRS GeoColor, above) along the Alaskan coast. Notice, the emitted city lights from Kenai, AK and Nikiski, AK as well.

Posted in: POES, | Comments closed
DNB: Ship Light Monitoring and Sea Ice Motion
October 31st, 2018 by Jorel TorresThe Day/Night Band (DNB) utilizes a sun/moon reflectance model that illuminates atmospheric features, and senses emitted and reflected light sources during the nighttime hours. The DNB is at 0.7um and is apart of 22 spectral channels on-board the Suomi National Polar-orbiting Partnership (S-NPP) satellite and the new NOAA-20 satellite.
In the DNB video below (using CIRA POLAR Slider) DNB is monitoring emitted ship lights in the East Siberian Sea, just northwest of Pevek, Russia. Refer to the yellow circle in the video. The ship appears to be moving to the east, traversing through the sea ice, over the course of four hours. Note, during this time period, the sea ice motion is moving to the north as well (i.e. refer to yellow arrow). Emitted town lights near Pevek, Russia and along the coast can be seen in the imagery as well.
For more information on DNB, refer to the following training material.
Posted in: POES, Satellites, | Comments closed
Hurricane Willa
October 23rd, 2018 by Jorel TorresHurricane Willa is forecasted to make landfall, along the coast of Mexico, within the next few hours. Willa, once deemed a Category 5 hurricane, has been downgraded to a Category 3 hurricane within the last 24 hours, with max sustained winds at 125 mph, moving north-northeast at 6 mph according to the National Hurricane Center (NHC) at 9AM MDT. The majority of people that reside in Willa’s path have been ordered to evacuate, with high winds, copious precipitation, storm surge and flooding to be expected. Below, geostationary and polar-orbiting satellites observed the event, where satellite imagery can be inspected below.
Advected Layered Precipitable Water (ALPW): 1800-1200Z, 22-23 October 2018
ALPW measures Precipitable Water (PW) values within four layers of the atmosphere (i.e. surface-850mb, 850-700mb, 700-500mb, 500-300mb) to identify where the majority of PW is concentrated (i.e. usually within the first 3 kilometers above the surface). For simplicity, the ALPW surface-850mb layer video is shown below, showing the location of Hurricane Willa, as it approaches the Mexican coast. Note, ALPW utilizes GFS model winds in the algorithm, and is updated every 6 hours. The modeled product shows the hurricane’s forecasted track yesterday, through this morning, 23 October 2018. High PW values are shown in red, where black pixels within the hurricane, denote precipitating regions. Microwave products such as ALPW, cannot retrieve data samples within areas of precipitating regions (i.e. displayed areas of missing data), however retrievals can sample within cloudy regions.
GOES-16 10.3um: 1450-1600Z, 23 October 2018
Infrared imagery, at a high temporal resolution (i.e. in this case, every 5 minutes) shows the magnitude of the Willa as the eyewall begins to traverse the Islas Marias then move toward the Mexican coast. Deep convection (i.e. regions of heavy precipitation) denoted in dark red-to-black colors, is spotted predominately to the north and west of the eyewall.
For the latest updates on Hurricane Willa, click on the following link.
Posted in: Tropical Cyclones, | Comments closed
