
Southeastern Australia Bushfires
January 16th, 2026 by Jorel TorresAfter the start of the new year, hot, dry, and windy conditions were conducive to bushfires erupting over southeastern Australia. The fires were primarily observed in the state of Victoria, where the capital city of Melbourne resides. According to the broadcast outlet, 10-News Melbourne, approximately 400,000 hectares (or ~980,000 acres) were burned over the region, as of 14 January 2026. Refer to the social media link below that describes the bushfires and the impacts to the local communities.
The Japan Meteorological Agency’s Advanced Himawari Imager (AHI) captured the fires between 6-11 January 2026. The shortwave infrared imagery from AHI observes the fire hotspots (white and red pixels) at a 2-km spatial resolution, with a 10 minute temporal resolution. Notice, several fires can be spotted across the state of Victoria while multiple rounds of cloud cover and convection pass over the scene.
Himawari-9 AHI 3.9 um from 18Z, 6 January 2026 to 18Z, 11 January 2026
Zooming into the eastern portion of the state of Victoria, a daytime animation from the VIIRS Day Fire RGB shows the initial fire hot spots (red), the rapid fire spread and the corresponding burn scars (reddish brown) during the five-day period. The RGB is sensitive to fire hotspots, vegetation health (e.g., burn scars), and smoke (blue colors) where the RGB’s spectra contains a combination of the 3.7 um, 0.86 um, and the 0.64 um channels. The RGB exhibits a 375-m spatial resolution.
VIIRS Day Fire RGB daytime images from 6 January 2026 to 11 January 2026
During the same timeframe, nighttime visible imagery provided a view of the emitted city lights (individual white pixels or clusters), while also observing the emitted lights produced from the fires (bright, non-uniform white pixels). The VIIRS Near-Constant Contrast (NCC) animation below captures the spread of several fires, moving rapidly toward the south/southeast over the five-day period. Additionally, a distinct, nighttime fire smoke plume can be identified in the imagery on 9 January 2026. A large fire, located in the northeastern part of Victoria, produced a significant smoke plume on its southeast flank, which carried toward the coastline. Southwest of the fires, the emitted lights from Melbourne can be seen along the coastline.
VIIRS NCC nighttime images from 6 January 2026 to 11 January 2026
To help differentiate between the emitted lights from cities, to those from fires, users can compare the VIIRS NCC with the VIIRS shortwave infrared imagery. Refer to the imagery animation below. Emitted lights from fires have corresponding thermal hotspots (i.e., black pixels, seen in the VIIRS 3.7 um), while emitted lights that do not have a corresponding thermal signature in the shortwave infrared can be inferred as city or town lights.
VIIRS NCC and VIIRS 3.7 um (I-4) Band at 1533Z, 9 January 2026
Posted in: Uncategorized, | Comments closed
Hawaii – The Big Island’s Winter Wonderland
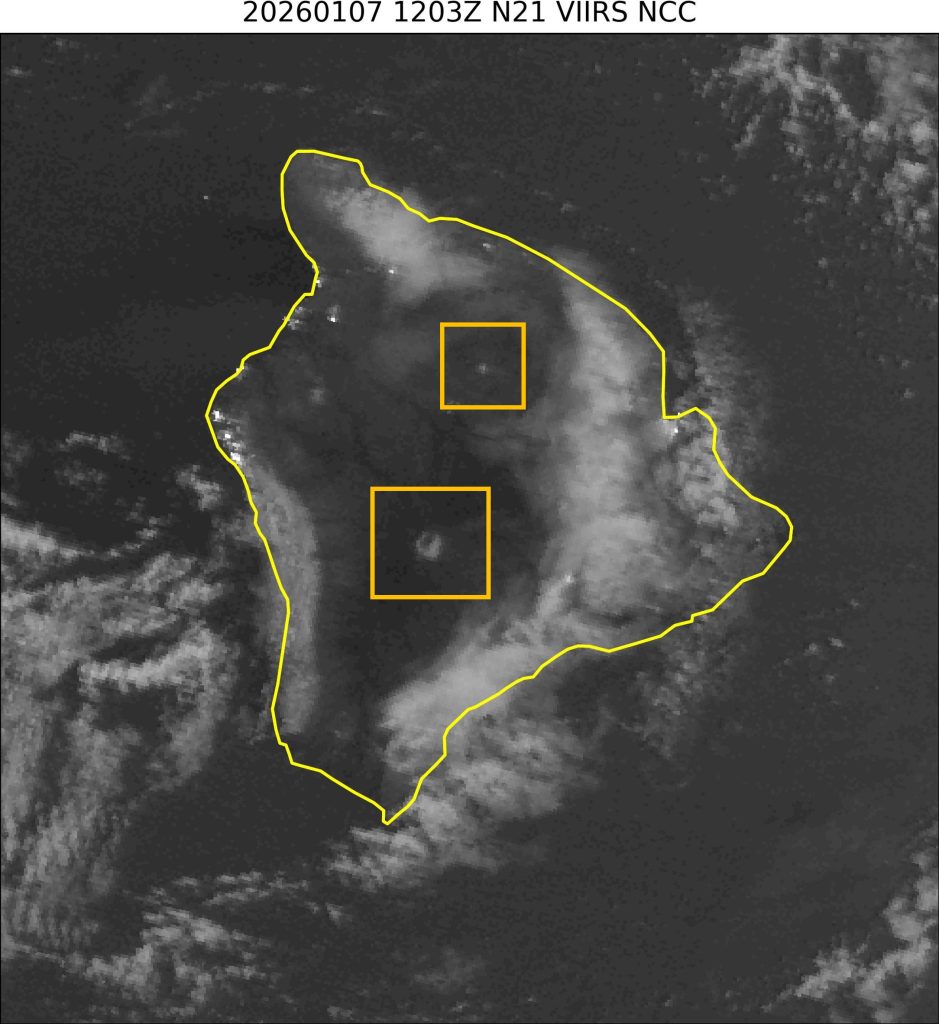
January 9th, 2026 by Jorel TorresEarlier this week, the Big Island of Hawaii received snow over the volcanic summits of Mauna Kea and Mauna Loa. Both summits are 13,000 plus feet above sea level, where they can accumulate snowfall, typically throughout Hawaii’s wet season (October through April). On Monday, 5 January 2026, winter storm warnings forecasted high winds and 5-10 inches of snowfall along the higher elevations of the Big Island of Hawaii. Pictures of the snow peaks can be viewed here, while the United States Geological Survey (USGS) provides a video (below) that captures the snowy summit of Mauna Loa.
Nighttime visible imagery from NOAA-21 VIIRS captured the snow cover over the peaks on 7 January 2026. Refer to the orange boxes in the imagery. Moonlight illuminates the snow cover while a mix of clouds and emitted city lights are seen scattered across the island.
VIIRS NCC at 1203Z, 7 January 2026
Later that afternoon, remnant snow cover can be viewed by the VIIRS Day Cloud Phase Distinction RGB, that observes the snow in green pixels (seen within the orange boxes) at 375-m spatial resolution.
VIIRS DCPD RGB from 2313Z-2343Z, 7 January 2026
Posted in: Uncategorized, | Comments closed
Yuma County, CO – Wildfires
December 22nd, 2025 by Jorel TorresLast week, a few fires erupted within Yuma County, located in northeastern Colorado. The fire hotspots were first captured by geostationary satellites at ~0500 UTC, 18 December 2025, after cloud cover moved out of the region. GOES-19 5-minute infrared imagery shows the hotspots in white and red pixels at 2-km spatial resolution. At ~0630 UTC, a strong cold front moves in from the north, bringing high, gusty winds that amplified the fire spread toward the south. As of 19 December 2025, the fires burned approximately 14,000 acres.
GOES-19 ABI 3.9 um from 3-12Z, 18 December 2025
Surface observations depict the strong, west-northwest winds (with 50+ mph wind gusts) moving quickly through northeastern Colorado and western Kansas, as the cold front lowered air temperatures into the low 30’s overnight.
Surface Observations from ~3-12Z, 18 December 2025
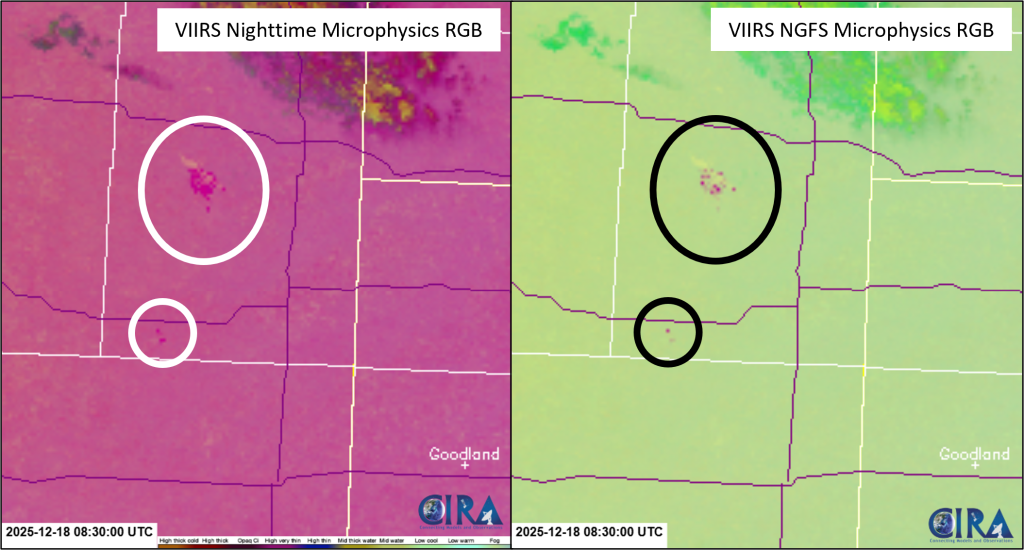
During the overnight hours, SNPP VIIRS observed two of the fires located in the southern portion of Yuma County. The VIIRS Nighttime Microphysics RGB, primarily used for fog and low cloud detection, can also be used for fire monitoring at night, as the green spectra of this RGB utilizes a brightness temperature difference that includes the 3.7 um. Within this RGB, the fire pixels are shown in dark pink pixels. Additionally, the new VIIRS NGFS Microphysics RGB, utilizes a combination of longwave and shortwave infrared channels to observe fires during the day or night. The NGFS Microphysics RGB depicts fires in pink pixels during the nighttime. Both RGBs have a 750-m spatial resolution.
JPSS VIIRS Nighttime Microphysics RGB and NGFS Microphysics RGB at 0830Z, 18 December 2025
Posted in: Uncategorized, | Comments closed
Tule Fog over the California Central Valley
December 18th, 2025 by Jorel TorresOver the past three weeks, tule fog blanketed the California Central Valley, oscillating in size and extent across the region. The 400+ mile long, ~50+ mile wide valley, was inundated with fog that led to reduced ground visibilities for motorists and aviation, along with bringing cooler temperatures to the area. The VIIRS instrument from JPSS polar-orbiting satellites captured the fog and low stratus from late November to mid-December 2025. Daytime overpasses from the VIIRS GeoColor product, at 750-m spatial resolution, observed the fog embedded within the California Central Valley, that is situated between the Sierra Nevada Mountain Range (to the east) and the Coast Ranges (to the west).
VIIRS GeoColor from 22 November 2025 to 16 December 2025
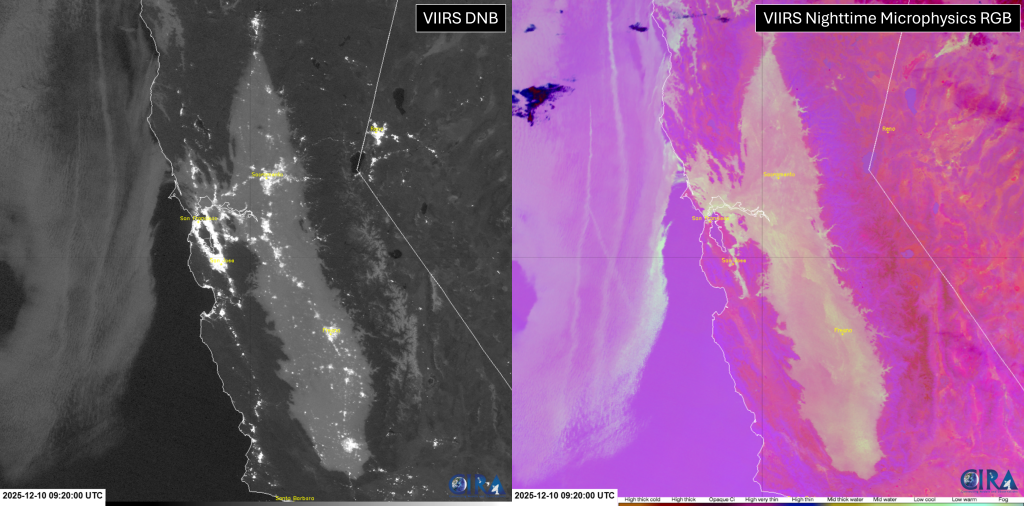
During the full moon phase of the lunar cycle, nighttime visible imagery from the VIIRS Day/Night Band (DNB, left) shows the extensive fog across the Central Valley and near the San Francisco Bay area. VIIRS DNB also depicts an array of emitted city lights across California, where at this timestamp, several cities were impacted by the fog. East of the valley, moonlight also reflects off the existing snow cover along the Sierra Nevadas. Corresponding VIIRS Nighttime Microphysics RGB imagery (right) identifies the fog in yellow-gray colors, indicating that the liquid water droplets were observed in cooler temperatures. Both products exhibit a 750-m spatial resolution.
VIIRS DNB & VIIRS Nighttime Microphysics RGB at 0920Z, 10 December 2025
Additionally, a video can be viewed here that captures motorists driving into the Tule Fog in December 2025.
Posted in: Uncategorized, | Comments closed
Southern Argentinian Dust Storm
November 21st, 2025 by Jorel TorresEarlier this week, a significant dust storm impacted the Chubut and Santa Cruz Provinces of southern Argentina. A strong low-pressure system, initially located in the South Pacific Ocean, traversed through the Andes Mountain Range and exited into the South Atlantic Ocean, which brought hurricane force winds that supported the development of the dust storm. Widespread dust was picked up from the interior of Argentina, then lofted eastward and dispersed over Golfo San Jorge and the South Atlantic Ocean. The upper-level water vapor animation from GOES-19 (shown below) shows the migration of the low pressure system (spinning cyclonically) over a two day period.
GOES-19 6.2 um from ~00Z, 17 November 2025 to ~00Z, 19 November 2025
During a similar time period, the dust can be spotted in bright magenta and pink colors within the GOES Dust RGB. The dust was initially located over the Argentinian interior, then advected eastward over the South Atlantic Ocean.
GOES-19 Dust RGB from ~10Z, 17 November 2025 to ~00Z, 19 November 2025
The aerosols were also captured by the GOES GeoColor product, depicted in light brown and tan colors, during the daytime hours of 17 November 2025.
GOES-19 GeoColor from ~10Z to 21Z, 17 November 2025
Four daytime overpasses from JPSS satellites also observed the dust plumes at high spatial resolution (750-m), provided by the VIIRS True Color RGB imagery. Refer to the imagery animation below.
JPSS VIIRS True Color RGB from 1734Z-1915Z, 17 November 2025
Posted in: Uncategorized, | Comments closed